

Abilene Christian vs Texas Tech Live Score (5 Sep, 2026)
Score by Quarter
| Team | Q1 | Q2 | Q3 | Q4 | Final |
|---|---|---|---|---|---|
 Abilene Christian | 0 | 3 | 0 | 7 | 10 |
 Texas Tech | 14 | 3 | 9 | 7 | 33 |
Scoring Plays
Q1
12:14
12:14
Quinten Joyner 14 Yd Run (Stone Harrington Kick)
Rushing Touchdown
0 – 7
Q1
2:22
2:22
J'Koby Williams 5 Yd Run (Stone Harrington Kick)
Rushing Touchdown
0 – 14
Q2
1:38
1:38
Stone Harrington 23 Yd Field Goal
Field Goal Good
0 – 17
Q2
0:07
0:07
Brandon Perez 41 Yd Field Goal
Field Goal Good
3 – 17
Q3
13:03
13:03
Stone Harrington 28 Yd Field Goal
Field Goal Good
3 – 20
Q3
7:36
7:36
Stone Harrington 33 Yd Field Goal
Field Goal Good
3 – 23
Q3
1:52
1:52
Stone Harrington 45 Yd Field Goal
Field Goal Good
3 – 26
Q4
2:45
2:45
Malcolm Simmons 64 Yd pass from Will Hammond (Stone Harrington Kick)
Passing Touchdown
3 – 33
Q4
2:29
2:29
Alex Broome 98 Yd Kickoff Return (Brandon Perez Kick)
Kickoff Return Touchdown
10 – 33
Game Leaders
Abilene ChristianTexas Tech
 J. Black QB
Passing Yards
 W. Hammond QB
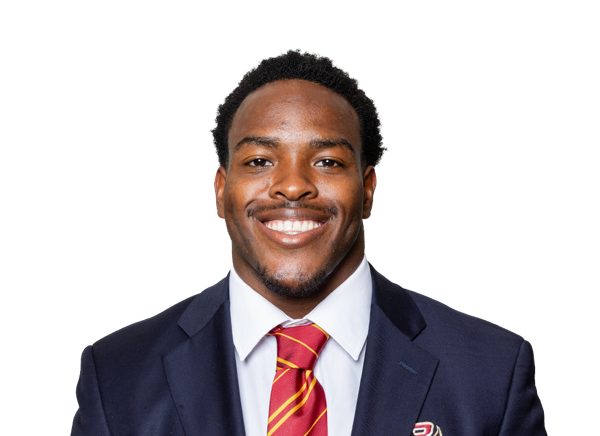 A. Broome RB
Rushing Yards
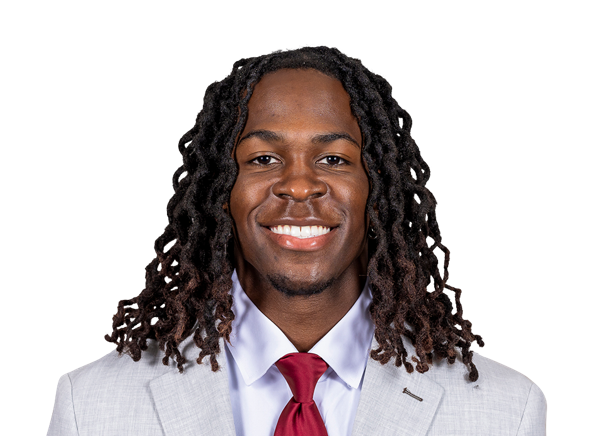
 J. Williams RB
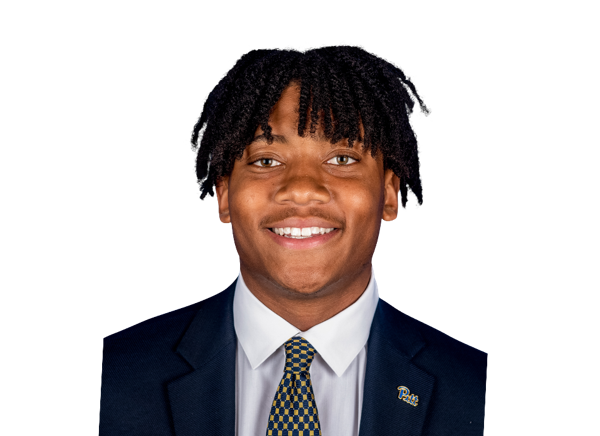
 C. Driver WR
Receiving Yards
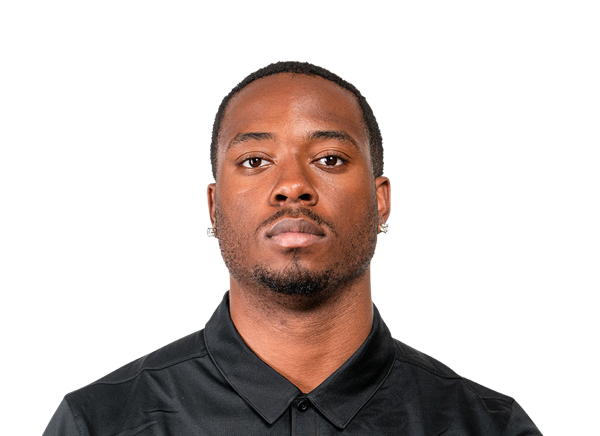
 K. Johnson WR
 D. Williams DB
Tackles
 J. Mathis LB
—
Sacks
J. Mathis LBPlayer Box Score
Abilene Christian| Player | C/ATT | YDS | AVG | TD | INT |
|---|---|---|---|---|---|
| John David Black#9 | 18/32 | 119 | 3.7 | 0 | 1 |
Texas Tech| Player | C/ATT | YDS | AVG | TD | INT |
|---|---|---|---|---|---|
| Will Hammond#15 | 26/33 | 298 | 9.0 | 1 | 1 |
 Kirk Francis#18 | 0/1 | 0 | 0.0 | 0 | 0 |
Abilene Christian| Player | CAR | YDS | AVG | TD | LONG |
|---|---|---|---|---|---|
| Alex Broome#20 | 10 | 52 | 5.2 | 0 | 14 |
 Rovaughn Banks Jr.#2 | 12 | 25 | 2.1 | 0 | 7 |
| John David Black#9 | 7 | -2 | -0.3 | 0 | 17 |
Texas Tech| Player | CAR | YDS | AVG | TD | LONG |
|---|---|---|---|---|---|
| J'Koby Williams#20 | 13 | 71 | 5.5 | 1 | 14 |
 Cameron Dickey#8 | 14 | 48 | 3.4 | 0 | 12 |
 Quinten Joyner | 10 | 43 | 4.3 | 1 | 14 |
| Will Hammond#15 | 2 | 11 | 5.5 | 0 | 6 |
Abilene Christian| Player | REC | YDS | AVG | TD | LONG |
|---|---|---|---|---|---|
| Cristian Driver#4 | 8 | 93 | 11.6 | 0 | 18 |
 Itty Henry#87 | 2 | 7 | 3.5 | 0 | 7 |
 Luke Moffitt#16 | 1 | 6 | 6.0 | 0 | 6 |
 Jayden York | 1 | 5 | 5.0 | 0 | 5 |
 Romelo Boykin#19 | 1 | 5 | 5.0 | 0 | 5 |
| Alex Broome#20 | 3 | 5 | 1.7 | 0 | 9 |
 Makenzie McGill#1 | 1 | 0 | 0.0 | 0 | 0 |
 Larry Benton III#88 | 1 | -2 | -2.0 | 0 | 0 |
Texas Tech| Player | REC | YDS | AVG | TD | LONG |
|---|---|---|---|---|---|
| Kenny Johnson#2 | 4 | 76 | 19.0 | 0 | 31 |
 Malcolm Simmons#11 | 1 | 64 | 64.0 | 1 | 64 |
| J'Koby Williams#20 | 8 | 57 | 7.1 | 0 | 28 |
 Terrance Carter Jr.#7 | 3 | 28 | 9.3 | 0 | 19 |
 Micah Hudson#1 | 2 | 26 | 13.0 | 0 | 15 |
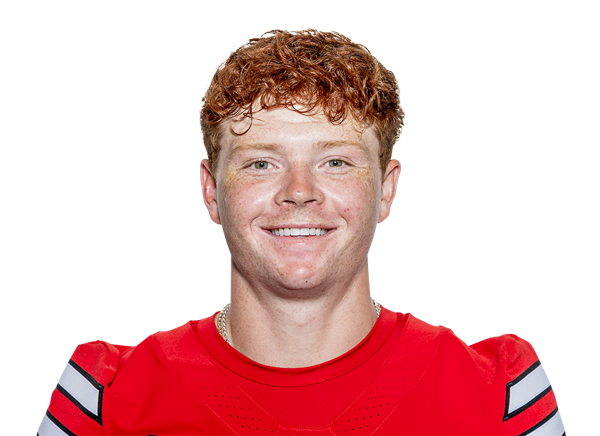 Coy Eakin#3 | 2 | 13 | 6.5 | 0 | 8 |
 Jett Carpenter#85 | 2 | 10 | 5.0 | 0 | 9 |
 Jalen Jones#6 | 1 | 9 | 9.0 | 0 | 9 |
| Cameron Dickey#8 | 2 | 8 | 4.0 | 0 | 5 |
 Bryson Jones#14 | 1 | 7 | 7.0 | 0 | 7 |
Abilene Christian| Player | TOT | SOLO | SACKS | TFL | PD | QB HUR | TD |
|---|---|---|---|---|---|---|---|
| Dillon Williams#3 | 10 | 4 | 0 | 2.5 | 1 | 1 | 0 |
 Gabe Brown#13 | 8 | 6 | 0 | 1 | 0 | 0 | 0 |
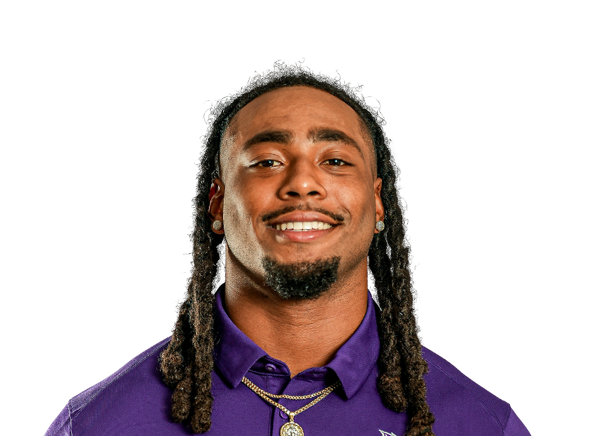 Darius Moore | 7 | 5 | 0 | 0 | 0 | 0 | 0 |
 Deangelo Ponder#12 | 7 | 5 | 0 | 0.5 | 1 | 0 | 0 |
 Javeon Wilcox#22 | 7 | 3 | 0 | 0 | 0 | 0 | 0 |
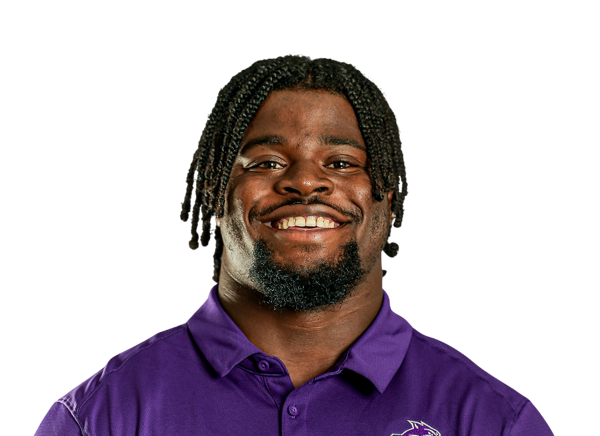 Kortlin Rausaw#9 | 6 | 2 | 0 | 0 | 0 | 0 | 0 |
 Jocelyn Malaska#5 | 5 | 2 | 0 | 0 | 0 | 0 | 0 |
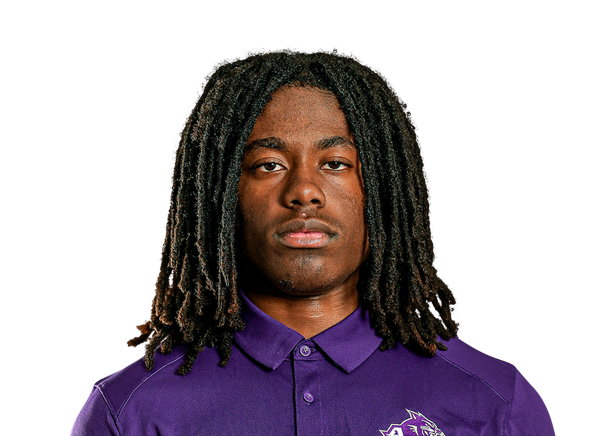 Christian Oku#7 | 4 | 3 | 0 | 0 | 0 | 0 | 0 |
 Boone Morris#23 | 4 | 2 | 0 | 0.5 | 0 | 0 | 0 |
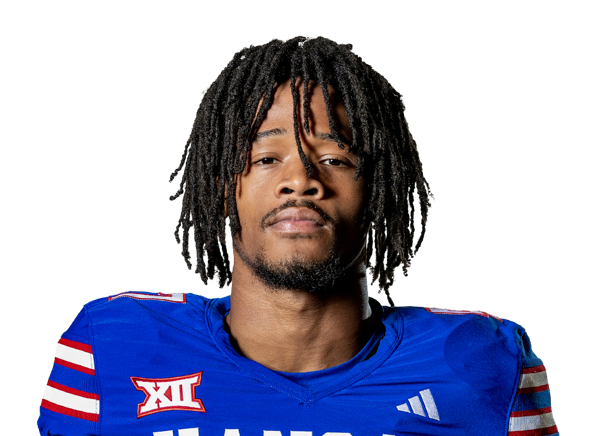 Jacoby Davis#16 | 3 | 3 | 0 | 0 | 0 | 0 | 0 |
 Chris Herpin#93 | 3 | 2 | 0 | 0 | 0 | 0 | 0 |
| Julius Laine#25 | 3 | 2 | 0 | 0 | 0 | 0 | 0 |
| Hudson Page#42 | 3 | 2 | 0 | 0 | 0 | 1 | 0 |
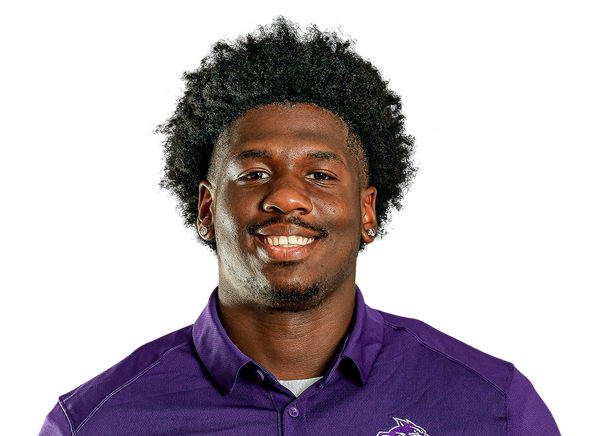 Jailyn Gibbs#18 | 2 | 2 | 0 | 1 | 0 | 0 | 0 |
| Evenson Malaska#26 | 2 | 1 | 0 | 0 | 0 | 0 | 0 |
 Obi Udom#92 | 2 | 0 | 0 | 0.5 | 0 | 0 | 0 |
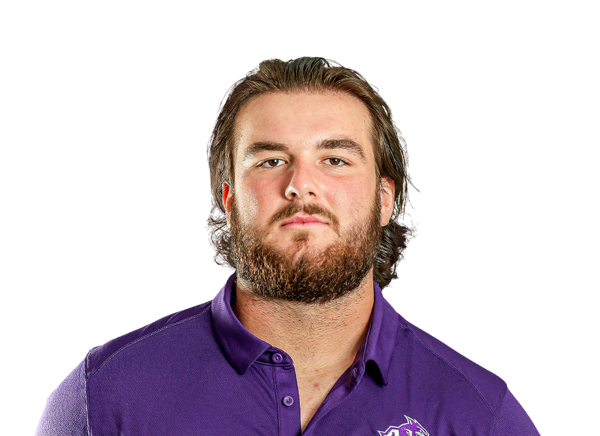 Luke Roaten#62 | 1 | 1 | 0 | 0 | 0 | 0 | 0 |
| Jamarion Hardemon#29 | 1 | 1 | 0 | 0 | 0 | 0 | 0 |
 Tanner Allen#90 | 1 | 0 | 0 | 0 | 0 | 0 | 0 |
| Saadel Davis Jr.#27 | 1 | 0 | 0 | 0 | 0 | 0 | 0 |
| Alex Broome#20 | 0 | 0 | 0 | 0 | 0 | 0 | 1 |
Texas Tech| Player | TOT | SOLO | SACKS | TFL | PD | QB HUR | TD |
|---|---|---|---|---|---|---|---|
| Jamond Mathis#8 | 6 | 3 | 2.5 | 2.5 | 0 | 1 | 0 |
 Ben Roberts#13 | 5 | 3 | 0 | 1 | 1 | 0 | 0 |
 Malik Esquerra#24 | 4 | 3 | 0 | 0 | 1 | 0 | 0 |
 Corey Platt Jr.#9 | 4 | 2 | 0 | 0 | 0 | 0 | 0 |
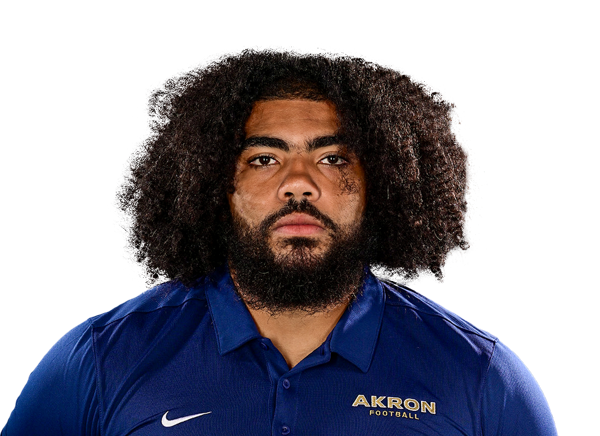 Julien Laventure#1 | 4 | 1 | 0 | 0 | 0 | 0 | 0 |
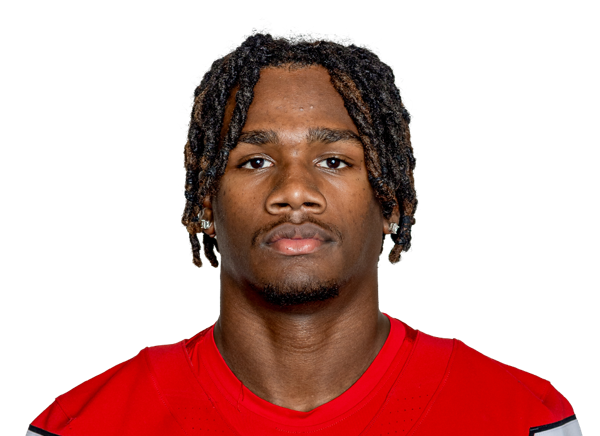 Brice Pollock#14 | 3 | 3 | 0 | 0 | 1 | 0 | 0 |
 Peyton Morgan#3 | 3 | 3 | 0 | 1 | 0 | 0 | 0 |
 Adam Trick#20 | 3 | 2 | 0 | 0 | 0 | 2 | 0 |
 John Curry#6 | 3 | 2 | 0 | 0 | 1 | 0 | 0 |
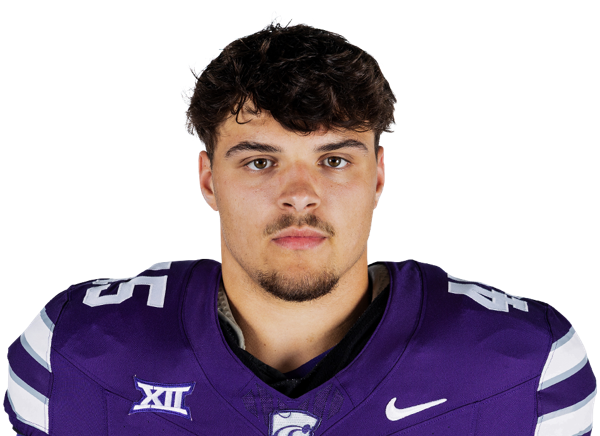 Austin Romaine#15 | 3 | 2 | 0 | 1 | 0 | 0 | 0 |
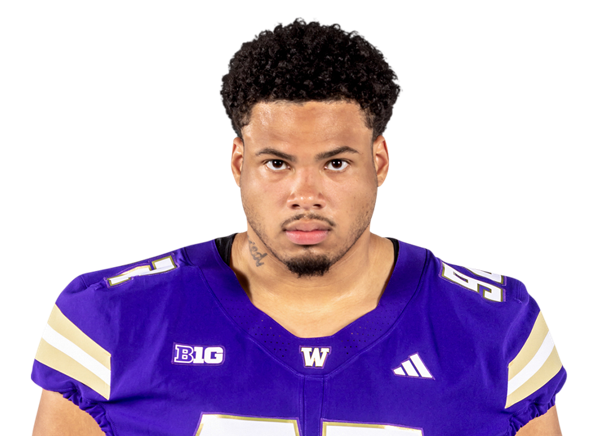 Bryce Butler#92 | 3 | 1 | 0 | 0 | 0 | 0 | 0 |
| Maddox Quiller#23 | 3 | 1 | 0 | 0 | 0 | 0 | 0 |
 Jayden Cofield#51 | 3 | 0 | 0 | 0 | 0 | 0 | 0 |
 Mateen Ibirogba#98 | 3 | 0 | 0 | 0 | 0 | 1 | 0 |
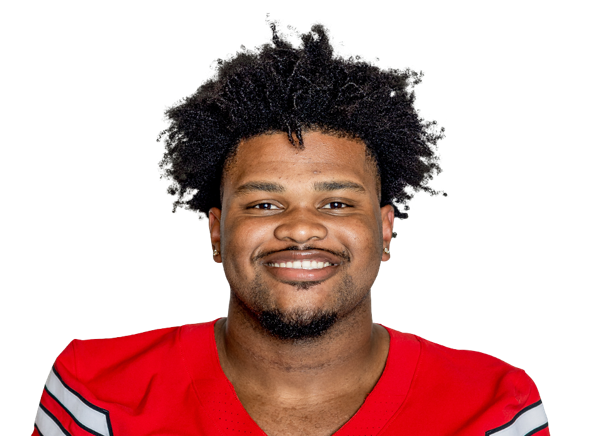 A.J. Holmes Jr.#10 | 2 | 0 | 0.5 | 0.5 | 0 | 1 | 0 |
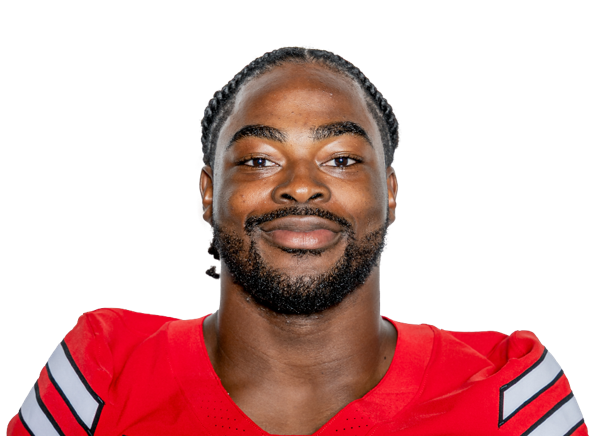 Ansel Nedore#33 | 2 | 0 | 0 | 0 | 0 | 0 | 0 |
 Mikal Harrison-Pilot | 1 | 1 | 0 | 0 | 0 | 0 | 0 |
 Amier Boyd#27 | 1 | 1 | 0 | 0 | 1 | 0 | 0 |
 Marcus Ramon-Edwards#22 | 1 | 0 | 0 | 0 | 0 | 0 | 0 |
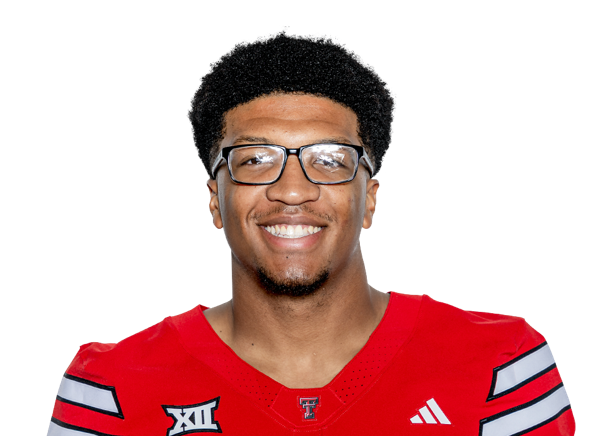 Charles Anderson Jr.#97 | 1 | 0 | 0 | 0 | 0 | 0 | 0 |
 Davin Martin#4 | 0 | 0 | 0 | 0 | 1 | 0 | 0 |
Abilene Christian| Player | FUM | LOST | REC |
|---|---|---|---|
| Cristian Driver#4 | 1 | 0 | 0 |
| Rovaughn Banks Jr.#2 | 1 | 0 | 0 |
Abilene Christian| Player | FG | PCT | LONG | XP | PTS |
|---|---|---|---|---|---|
 Brandon Perez#23 | 1/2 | 50.0 | 41 | 1/1 | 4 |
Texas Tech| Player | FG | PCT | LONG | XP | PTS |
|---|---|---|---|---|---|
 Stone Harrington#48 | 4/4 | 100.0 | 45 | 3/3 | 15 |
Abilene Christian| Player | NO | YDS | AVG | TB | In 20 | LONG |
|---|---|---|---|---|---|---|
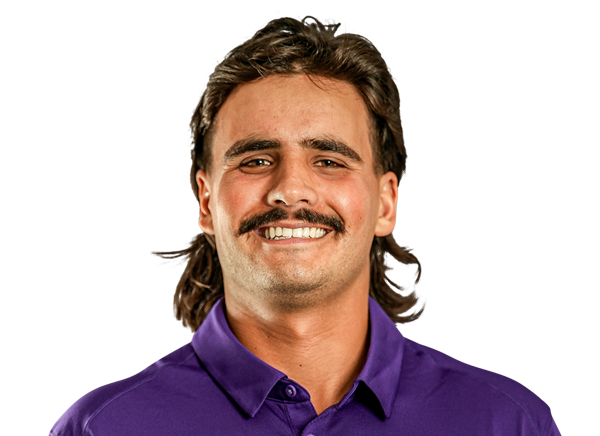 Hugo Nash#33 | 3 | 117 | 39.0 | 0 | 2 | 43 |
 Jace Gilbert#20 | 2 | 96 | 48.0 | 0 | 1 | 49 |
Texas Tech| Player | NO | YDS | AVG | TB | In 20 | LONG |
|---|---|---|---|---|---|---|
 Will Karoll#49 | 2 | 101 | 50.5 | 0 | 0 | 51 |
Abilene Christian| Player | NO | YDS | AVG | LONG | TD |
|---|---|---|---|---|---|
| Alex Broome#20 | 1 | 98 | 98.0 | 98 | 1 |
Texas Tech| Player | NO | YDS | AVG | LONG | TD |
|---|---|---|---|---|---|
| J'Koby Williams#20 | 1 | 13 | 13.0 | 13 | 0 |
| Matt Ludwig#5 | 1 | 8 | 8.0 | 8 | 0 |
Abilene Christian| Player | NO | YDS | AVG | LONG | TD |
|---|---|---|---|---|---|
| Cristian Driver#4 | 1 | -1 | -1.0 | 0 | 0 |
Texas Tech| Player | NO | YDS | AVG | LONG | TD |
|---|---|---|---|---|---|
| Malcolm Simmons#11 | 1 | 4 | 4.0 | 4 | 0 |
| Kenny Johnson#2 | 1 | 2 | 2.0 | 2 | 0 |
Abilene Christian| Player | INT | YDS | TD |
|---|---|---|---|
| Javeon Wilcox#22 | 1 | 0 | 0 |
Texas Tech| Player | INT | YDS | TD |
|---|---|---|---|
| John Curry#6 | 1 | 15 | 0 |
Drive Summary
TTU
Touchdown
75
ACU
Punt
15
TTU
Touchdown
87
ACU
Punt
33
TTU
Interception
61
ACU
Punt
7
TTU
Field Goal
45
ACU
Field Goal
51
TTU
End of Half
3
ACU
Interception
0
TTU
Field Goal
3
ACU
Punt
-5
TTU
Field Goal
52
ACU
Missed FG
41
TTU
Field Goal
40
ACU
Downs
61
TTU
Punt
5
ACU
Punt
22
TTU
Touchdown
91
TTU
Touchdown
98
TTU
Punt
6
ACU
End of Game
9
Injury Report
No current injury report is available for this matchup.
Head-to-Head
Historical meetings are not available for this matchup.
Game Information
StageWeek 1
Season2026
KickoffSat, Sep 5, 7:00 pm
VenueGalaxy Stadium
LocationLubbock, TX
SurfaceArtificial Turf
BroadcastFS1
Attendance60,229
Division Standings
FCS — United Athletic Conference
| Team | W | L | T | Pct | PF | PA | Home | Away | Strk |
|---|---|---|---|---|---|---|---|---|---|
 West Florida | 0 | 0 | 0 | .000 | 0 | 0 | — | — | — |
 Tarleton State | 1 | 0 | 0 | 1.000 | 20 | 13 | 0-0 | 1-0 | W1 |
 Austin Peay | 0 | 1 | 0 | 0.000 | 9 | 28 | 0-0 | 0-1 | L1 |
 North Alabama | 0 | 1 | 0 | 0.000 | 14 | 31 | 0-0 | 0-1 | L1 |
| Abilene Christian | 0 | 1 | 0 | 0.000 | 10 | 33 | 0-0 | 0-1 | L1 |
 Eastern Kentucky | 0 | 1 | 0 | 0.000 | 7 | 49 | 0-0 | 0-1 | L1 |
 West Georgia | 0 | 2 | 0 | 0.000 | 7 | 99 | 0-0 | 0-2 | L2 |
 Central Arkansas | 0 | 1 | 0 | 0.000 | 7 | 34 | 0-0 | 0-1 | L1 |
FBS — Big 12 Conference
| Team | W | L | T | Pct | PF | PA | Home | Away | Strk |
|---|---|---|---|---|---|---|---|---|---|
 BYU | 7 | 2 | 0 | 0.778 | 279 | 178 | 5-0 | 2-2 | L1 |
 Cincinnati | 5 | 4 | 0 | 0.556 | 297 | 265 | 5-1 | 0-3 | L2 |
 Colorado | 3 | 6 | 0 | 0.333 | 178 | 255 | 2-2 | 1-4 | L1 |
 Houston | 7 | 2 | 0 | 0.778 | 319 | 192 | 5-0 | 2-2 | W1 |
 Iowa State | 4 | 5 | 0 | 0.444 | 263 | 260 | 4-1 | 0-4 | L1 |
 Kansas | 3 | 6 | 0 | 0.333 | 265 | 223 | 3-3 | 0-3 | L2 |
 Kansas State | 4 | 5 | 0 | 0.444 | 282 | 241 | 4-2 | 0-3 | L3 |
| Texas Tech | 8 | 1 | 0 | 0.889 | 338 | 217 | 6-0 | 2-1 | W2 |
 UCF | 5 | 4 | 0 | 0.556 | 271 | 234 | 4-1 | 1-3 | W1 |
 Utah | 9 | 0 | 0 | 1.000 | 339 | 147 | 6-0 | 3-0 | W9 |
 West Virginia | 5 | 4 | 0 | 0.556 | 335 | 311 | 3-2 | 2-2 | L1 |
 Arizona State | 5 | 4 | 0 | 0.556 | 256 | 246 | 4-1 | 1-3 | W1 |
 Arizona | 7 | 2 | 0 | 0.778 | 308 | 179 | 5-0 | 2-2 | W1 |
 Baylor | 6 | 3 | 0 | 0.667 | 287 | 153 | 4-1 | 2-2 | W2 |
 Oklahoma State | 6 | 3 | 0 | 0.667 | 395 | 245 | 4-0 | 2-3 | W1 |
 TCU | 4 | 5 | 0 | 0.444 | 214 | 142 | 3-3 | 1-2 | L1 |
Abilene Christian
11th in FCS
VS
Texas Tech
2nd in Big 12
Quarterbacks & Specialists
#9
John David Black
#20
Jace Gilbert
#33
Hugo Nash
Offensive Line
#62
Luke Roaten
Receivers & Backs
#2
Rovaughn Banks Jr.
#88
Larry Benton III
#19
Romelo Boykin
#20
Alex Broome
#4
Cristian Driver
#87
Itty Henry
#1
Makenzie McGill
#16
Luke Moffitt
Jayden York
Defensive Line & Linebackers
#90
Tanner Allen
#13
Gabe Brown
#18
Jailyn Gibbs
#93
Chris Herpin
#25
Julius Laine
Darius Moore
#23
Boone Morris
#42
Hudson Page
#9
Kortlin Rausaw
#92
Obi Udom
Defensive Backs
#16
Jacoby Davis
#27
Saadel Davis Jr.
#29
Jamarion Hardemon
#26
Evenson Malaska
#5
Jocelyn Malaska
#7
Christian Oku
#12
Deangelo Ponder
#22
Javeon Wilcox
#3
Dillon Williams
Other
#23
Brandon Perez
Quarterbacks & Specialists
#18
Kirk Francis
#15
Will Hammond
#49
Will Karoll
Receivers & Backs
#85
Jett Carpenter
#7
Terrance Carter Jr.
#8
Cameron Dickey
#3
Coy Eakin
#1
Micah Hudson
#2
Kenny Johnson
#14
Bryson Jones
#6
Jalen Jones
Quinten Joyner
#5
Matt Ludwig
#11
Malcolm Simmons
#20
J'Koby Williams
Defensive Line & Linebackers
#97
Charles Anderson Jr.
#92
Bryce Butler
#51
Jayden Cofield
#6
John Curry
#10
A.J. Holmes Jr.
#98
Mateen Ibirogba
#1
Julien Laventure
#8
Jamond Mathis
#33
Ansel Nedore
#9
Corey Platt Jr.
#13
Ben Roberts
#15
Austin Romaine
#20
Adam Trick
Defensive Backs
#27
Amier Boyd
#24
Malik Esquerra
Mikal Harrison-Pilot
#4
Davin Martin
#3
Peyton Morgan
#14
Brice Pollock
#23
Maddox Quiller
#22
Marcus Ramon-Edwards
Other
#48
Stone Harrington
Abilene Christian
2nd in UAC
VS
Texas Tech
2nd in Big 12
Passing
67.4
Completion Percentage
64.8
190
Completions
171
2.80
Interception Percentage
2.70
8
Interceptions
7
76
Longest Pass
64
2,037
Net Passing Yards
2,112
203.7
Net Passing Yards Per Game
234.7
282
Passing Attempts
264
5.30
Passing Touchdown %
5.70
15
Passing Touchdowns
15
139.8
Passer Rating
145.4
24
Total Sacks
15
164
Sack Yards Lost
111
7.2
Yards Per Pass Attempt
8.0
2,037
Passing Yards
2,112
0
Passing Fumbles Lost
0
10
Team Games Played
9
357.7
Yards Per Game
449.3
26.1
Total Points Per Game
37.6
261
Total Points
338
32
Total Touchdowns
41
203.7
Passing Yards Per Game
234.7
190-282
Comp-Att
171-264
24-164
Sacks-Yards Lost
15-111
Rushing
361
Rushing Attempts
366
1,540
Rushing Yards
1,932
4.3
Yards Per Rush Attempt
5.3
57
Long Rushing
75
0
20+ Yard Rushing Plays
0
15
Rushing Touchdowns
21
154.0
Rushing Yards Per Game
214.7
0
Rushing Fumbles
0
0
Rushing Fumbles Lost
0
97
Rushing 1st downs
94
10
Team Games Played
9
3,577
Total Yards
4,044
667
Total Offensive Plays
645
26.1
Total Points Per Game
37.6
261
Total Points
338
32
Total Touchdowns
41
Receiving
190
Receptions
171
0
Receiving Targets
0
2,037
Receiving Yards
2,112
2,037
Receiving Yards
2,112
15
Receiving Touchdowns
15
76
Long Reception
64
0
20+ Yard Receiving Plays
0
203.7
Receiving Yards Per Game
234.7
0
Receiving Fumbles
0
0
Receiving Fumbles Lost
0
48
Receiving Yards After Catch
742
89
Receiving First Downs
91
10
Team Games Played
9
10.7
Yards Per Reception
12.4
26.1
Total Points Per Game
37.6
261
Total Points
338
32
Total Touchdowns
41
Miscellaneous
206
Total 1st downs
202
97
Rushing 1st downs
94
89
Passing 1st downs
91
20
1st downs by penalty
17
60
Third Down Conversions
47
132
Third Down Attempts
118
45.45
3rd down %
39.83
11
Fourth Down Conversions
10
14
First Downs Attempts
16
78.57
4th down %
62.50
54
Total Penalties
59
500
Total Penalty Yards
500
18912
Possession Time Seconds
15295
0.00
Red Zone Field Goal Percentage
0.00
0.00
Red Zone Scoring Percentage
0.00
0.00
Red Zone Efficiency Percentage
0.00
0.00
Red Zone Touchdown Percentage
0.00
19
Total Takeaways
11
14
Total Giveaways
13
5
Turnover Ratio
-2
0
Fumbles Lost
0
60-132
3rd down efficiency
47-118
11-14
4th down efficiency
10-16
54-500
Total-Yards
59-500
Defense
258
Solo Tackles
341
386
Assist Tackles
250
644
Total Tackles
591
11
Sacks
29
106
Sack Yards
187
58
Stuffs
81
29
Passes Defended
33
12.3
Average Interception Yards
13.6
29
Long Interception
53
0
Miscellaneous Touchdowns
0
1
Kicks Blocked
1
30
Tackles For Loss
46
10
Team Games Played
9
Defensive Interceptions
4
Interceptions
13
49
Interception Yards
177
0
Interception Touchdowns
5
4-49
INT: Total
13-177
General
13
Fumbles
14
9
Forced Fumbles
6
11
Fumbles Recovered
4
1
Fumbles Touchdowns
0
10
Games Played
9
13-0
Fumbles-Lost
14-0
Returning
15
Kick Returns
16
291
Kick Return Yards
394
19.4
Yards Per Kick Return
24.6
98
Long Kick Return
53
1
Kick Return Touchdowns
0
12
Punt Returns
20
69
Punt Return Yards
178
5.8
Yards Per Punt Return
8.9
46
Long Punt Return
34
0
Punt Return Touchdowns
0
0
Punt Return Fair Catches
0
0
Kick Return Fumbles Lost
0
0
Punt Return Fumbles Lost
0
10
Team Games Played
9
12-69
Punt: Total
20-178
Kicking
12
Field Goal Made
18
16
Field Goal Attempts
22
75.0
Field Goal Percentage
81.8
51
Long Field Goal Made
52
0
Field Goal Attempts 1-19
0
3
Field Goal Attempts 20-29
4
6
Field Goal Attempts 30-39
8
5
Field Goal Attempts 40-49
7
2
Field Goal Attempts 50+
3
31
Extra Points Made
36
31
Extra Point Attempts
37
100.0
Extra Point Percentage
97.3
0
Field Goals Made 1-19
0
3
Field Goals Made 20-29
4
5
Field Goals Made 30-39
6
3
Field Goals Made 40-49
7
1
Field Goals Made 50+
1
67
Total Kicking Points
90
10
Team Games Played
9
62
Touchback Percentage
81
0.0
Average Kickoff Return Yards
0.0
0
Kickoff Return Yards
0
0
Kickoff Returns
0
0-0
Kickoffs: Total
0-0
12-16
FG: Good-Attempts
18-22
Punting
39
Punts
32
1,560
Punt Yards
1,482
58
Long Punt
67
40.0
Gross Average Punt Yards
46.3
40.0
Net Average Punt Yards
46.3
0
Punts Blocked
0
17
Punts Inside 20
17
1
Touchbacks
1
19
Fair Catches
10
8
Punt Returns
4
0
Punt Return Yards
0
0.0
Average Punt Return Yards
0.0
10
Team Games Played
9
39-1,560
Punt: Total Yards
32-1,482
Scoring
15
Rushing Touchdowns
21
15
Receiving Touchdowns
15
1
Return Touchdowns
0
32
Total Touchdowns
36
12
Field Goals
18
31
Kick Extra Points
36
1
Total Two Point Conversions
0
261
Total Points
338
26.1
Total Points Per Game
37.6