

Air Force vs Nevada Live Score (27 Sep, 2026)
Score by Quarter
| Team | Q1 | Q2 | Q3 | Q4 | OT | OT2 | Final |
|---|---|---|---|---|---|---|---|
 Air Force | 3 | 7 | 3 | 14 | 3 | 6 | 36 |
 Nevada | 10 | 0 | 7 | 10 | 3 | 3 | 33 |
Scoring Plays
Q1
9:37
9:37
Joe McFadden 36 Yd Field Goal
Field Goal Good
0 – 3
Q1
5:07
5:07
Carter Cremascoli 43 Yd Field Goal
Field Goal Good
3 – 3
Q1
1:32
1:32
Herschel Turner 8 Yd Run (Joe McFadden Kick)
Rushing Touchdown
3 – 10
Q2
2:45
2:45
Liam Szarka 1 Yd Run (Carter Cremascoli Kick)
Rushing Touchdown
10 – 10
Q3
7:50
7:50
Carter Cremascoli 33 Yd Field Goal
Field Goal Good
13 – 10
Q3
4:43
4:43
AJ Bianco 9 Yd Run (Joe McFadden Kick)
Rushing Touchdown
13 – 17
Q4
10:24
10:24
Matt Long 7 Yd pass from Liam Szarka (Carter Cremascoli Kick)
Passing Touchdown
20 – 17
Q4
5:56
5:56
Liam Szarka 8 Yd Run (Carter Cremascoli Kick)
Rushing Touchdown
27 – 17
Q4
3:45
3:45
Joe McFadden 31 Yd Field Goal
Field Goal Good
27 – 20
Q4
1:49
1:49
Herschel Turner 57 Yd Run (Joe McFadden Kick)
Rushing Touchdown
27 – 27
OT
0:00
0:00
Carter Cremascoli 28 Yd Field Goal
Field Goal Good
30 – 27
OT
0:00
0:00
Joe McFadden 35 Yd Field Goal
Field Goal Good
30 – 30
2OT
0:00
0:00
Joe McFadden 38 Yd Field Goal
Field Goal Good
30 – 33
2OT
0:00
0:00
Rocco Conti 7 Yd Run
Rushing Touchdown
36 – 33
Game Leaders
Air ForceNevada
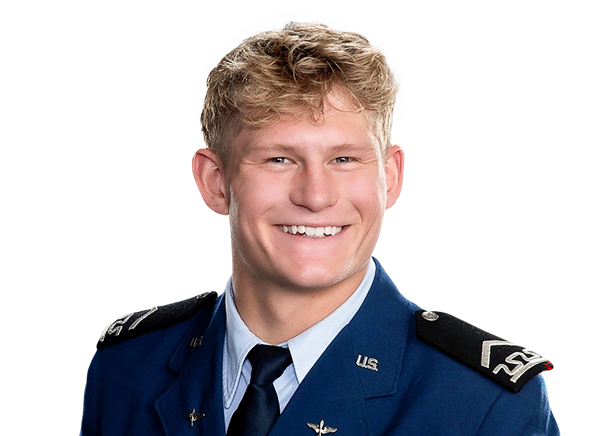 L. Szarka QB
Passing Yards
 C. Jones QBL. Szarka QB
Rushing Yards
 H. Turner RB
 S. Kibbee TE
Receiving Yards
 D. Cheers WR
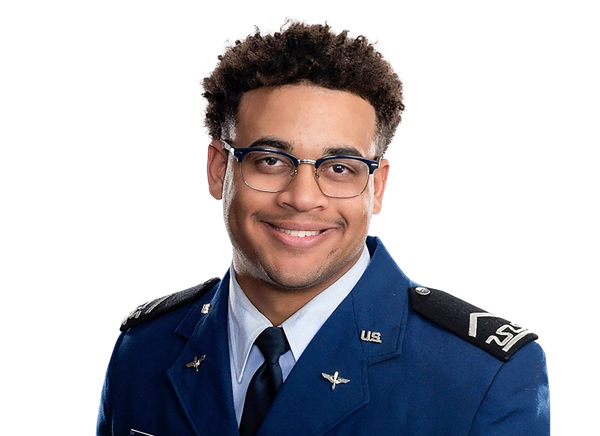 J. Reese LB
Sacks
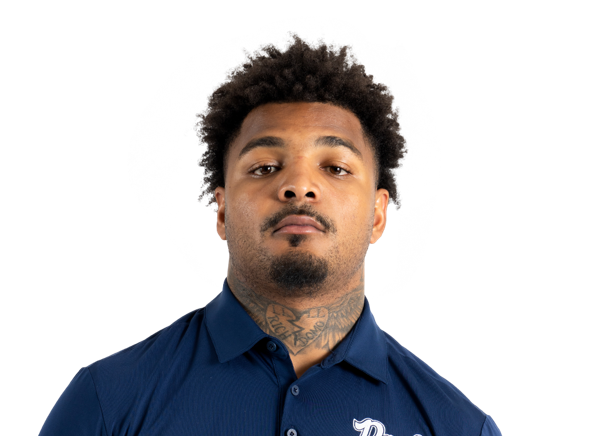 J. Naborne-Owens LB
 B. Fletcher LB
Tackles
 E. Smith LB
Player Box Score
Air Force| Player | C/ATT | YDS | AVG | TD | INT | QBR |
|---|---|---|---|---|---|---|
| Liam Szarka#9 | 5/12 | 92 | 7.7 | 1 | 1 | 73.2 |
 Team | 0/1 | 0 | 0.0 | 0 | 0 | -- |
Nevada| Player | C/ATT | YDS | AVG | TD | INT | QBR |
|---|---|---|---|---|---|---|
| Carter Jones#6 | 18/30 | 224 | 7.5 | 0 | 0 | 26.4 |
 AJ Bianco#10 | 0/1 | 0 | 0.0 | 0 | 0 | -- |
Air Force| Player | CAR | YDS | AVG | TD | LONG |
|---|---|---|---|---|---|
| Liam Szarka#9 | 33 | 171 | 5.2 | 2 | 32 |
 Rocco Conti#44 | 11 | 77 | 7.0 | 1 | 23 |
 Kemper Hodges#4 | 10 | 48 | 4.8 | 0 | 34 |
 Gage LaDue#28 | 3 | 32 | 10.7 | 0 | 13 |
 Owen Allen#2 | 11 | 29 | 2.6 | 0 | 8 |
 Matt Long#3 | 2 | 6 | 3.0 | 0 | 5 |
Nevada| Player | CAR | YDS | AVG | TD | LONG |
|---|---|---|---|---|---|
| Herschel Turner#1 | 11 | 111 | 10.1 | 2 | 57 |
 Dominic Kelley | 13 | 60 | 4.6 | 0 | 14 |
| AJ Bianco#10 | 1 | 9 | 9.0 | 1 | 9 |
 Ky Woods#25 | 1 | 8 | 8.0 | 0 | 8 |
| Donnie Cheers#5 | 1 | 4 | 4.0 | 0 | 4 |
| Carter Jones#6 | 8 | -5 | -0.6 | 0 | 8 |
Air Force| Player | REC | YDS | AVG | TD | LONG |
|---|---|---|---|---|---|
| Simon Kibbee#80 | 2 | 53 | 26.5 | 0 | 34 |
 Adam Hrynciw#10 | 1 | 21 | 21.0 | 0 | 21 |
 Grant Wayne#19 | 1 | 11 | 11.0 | 0 | 11 |
| Matt Long#3 | 1 | 7 | 7.0 | 1 | 7 |
Nevada| Player | REC | YDS | AVG | TD | LONG |
|---|---|---|---|---|---|
| Donnie Cheers#5 | 1 | 50 | 50.0 | 0 | 50 |
 Gary Givens III#7 | 3 | 43 | 14.3 | 0 | 22 |
 Don Henry#18 | 1 | 28 | 28.0 | 0 | 28 |
| Dominic Kelley | 3 | 27 | 9.0 | 0 | 13 |
| Herschel Turner#1 | 1 | 25 | 25.0 | 0 | 25 |
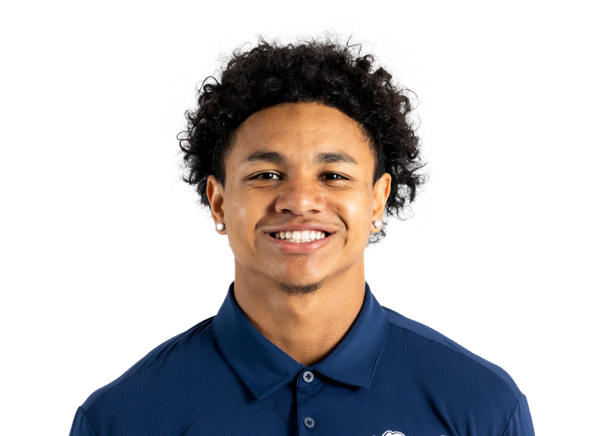 Damien Morgan#11 | 6 | 21 | 3.5 | 0 | 8 |
 Marshaun Brown#9 | 1 | 13 | 13.0 | 0 | 13 |
 Jaceon Doss#3 | 1 | 10 | 10.0 | 0 | 10 |
 DJ Asiasi#16 | 1 | 7 | 7.0 | 0 | 7 |
Air Force| Player | TOT | SOLO | SACKS | TFL | PD | QB HUR | TD |
|---|---|---|---|---|---|---|---|
| Blake Fletcher#6 | 13 | 6 | 0 | 1 | 0 | 0 | 0 |
 Dallas Daley#8 | 10 | 7 | 0 | 1 | 0 | 0 | 0 |
 Cade Paterson#23 | 6 | 5 | 0 | 0 | 0 | 0 | 0 |
 Max Mustell#36 | 5 | 5 | 1 | 1 | 0 | 0 | 0 |
| Jaylin Reese#45 | 5 | 4 | 1.5 | 2.5 | 0 | 0 | 0 |
 Korey Johnson#2 | 4 | 3 | 0 | 0 | 1 | 0 | 0 |
 Muhammad Alcine#90 | 2 | 2 | 1 | 1 | 0 | 0 | 0 |
 Andrew Tillett#93 | 2 | 0 | 0.5 | 0.5 | 0 | 0 | 0 |
 Antonio Menard#48 | 2 | 0 | 0 | 0 | 0 | 0 | 0 |
 Luke Fisher | 1 | 1 | 0 | 0 | 0 | 0 | 0 |
 Jonah Bowman#44 | 1 | 1 | 0 | 0 | 0 | 0 | 0 |
 Jake Kepler#47 | 1 | 1 | 0 | 0 | 1 | 0 | 0 |
 Jordan Elie-Stuart#24 | 1 | 1 | 0 | 0 | 0 | 0 | 0 |
 Harris Vinson#25 | 1 | 1 | 0 | 0 | 0 | 0 | 0 |
 Connor Vasek#92 | 1 | 1 | 0 | 0 | 0 | 0 | 0 |
 Bennett Williams#97 | 1 | 0 | 0 | 0 | 0 | 0 | 0 |
 Ehimen Oyamendan#22 | 1 | 0 | 0 | 0 | 1 | 0 | 0 |
| Jaxon Paulsrud#40 | 1 | 0 | 0 | 0 | 0 | 0 | 0 |
Nevada| Player | TOT | SOLO | SACKS | TFL | PD | QB HUR | TD |
|---|---|---|---|---|---|---|---|
| EJ Smith#2 | 21 | 10 | 0 | 0 | 0 | 0 | 0 |
 Dylan LaBarbera#32 | 18 | 10 | 0 | 0 | 0 | 0 | 0 |
| Jeremy Naborne-Owens#1 | 12 | 5 | 1 | 1 | 1 | 1 | 0 |
 Myles Williams#92 | 9 | 7 | 0 | 0 | 0 | 0 | 0 |
 David Paine Jr.#98 | 7 | 3 | 0 | 1 | 0 | 0 | 0 |
 Larry Turner-Gooden#8 | 5 | 3 | 0 | 0 | 0 | 0 | 0 |
 Isaiah Jordan#26 | 5 | 2 | 0 | 1 | 1 | 0 | 0 |
 Logologo Va'a#10 | 4 | 1 | 0 | 0 | 0 | 0 | 0 |
 Bishop Turner#15 | 4 | 1 | 0 | 0 | 0 | 0 | 0 |
 Aiden Walker#18 | 3 | 2 | 0 | 0 | 0 | 0 | 0 |
 Joshua Scott | 2 | 0 | 0 | 0 | 0 | 0 | 0 |
 Jason Hemphill II#90 | 2 | 0 | 0 | 0 | 0 | 0 | 0 |
 James Gillespie#91 | 1 | 1 | 0 | 0 | 0 | 0 | 0 |
 Zion Jones#5 | 0 | 0 | 0 | 0 | 1 | 0 | 0 |
Nevada| Player | FUM | LOST | REC |
|---|---|---|---|
| Dominic Kelley | 1 | 0 | 0 |
Air Force| Player | FG | PCT | LONG | XP | PTS |
|---|---|---|---|---|---|
 Carter Cremascoli#90 | 3/3 | 100.0 | 43 | 3/3 | 12 |
Nevada| Player | FG | PCT | LONG | XP | PTS |
|---|---|---|---|---|---|
 Joe McFadden#84 | 4/4 | 100.0 | 38 | 3/3 | 15 |
Air Force| Player | NO | YDS | AVG | TB | In 20 | LONG |
|---|---|---|---|---|---|---|
 Will Duncan#94 | 3 | 136 | 45.3 | 0 | 2 | 58 |
Nevada| Player | NO | YDS | AVG | TB | In 20 | LONG |
|---|---|---|---|---|---|---|
 Ewan Baulch#95 | 3 | 129 | 43.0 | 0 | 1 | 47 |
Nevada| Player | NO | YDS | AVG | LONG | TD |
|---|---|---|---|---|---|
 Gerick Robinson#14 | 1 | 15 | 15.0 | 15 | 0 |
Nevada| Player | INT | YDS | TD |
|---|---|---|---|
 Bryson Snelling#12 | 1 | 0 | 0 |
Drive Summary
NEV
Field Goal
56
AFA
Field Goal
50
NEV
Touchdown
75
AFA
Punt
13
NEV
Punt
35
AFA
Touchdown
92
NEV
Punt
18
AFA
End of Half
21
AFA
Field Goal
59
NEV
Touchdown
75
AFA
Punt
31
NEV
Punt
7
AFA
Touchdown
62
NEV
Downs
30
AFA
Touchdown
55
NEV
Field Goal
61
AFA
Punt
-2
NEV
Touchdown
68
AFA
Interception
15
NEV
End of Half
7
AFA
Field Goal
14
NEV
Field Goal
7
NEV
Field Goal
4
AFA
Touchdown
25
Injury Report
No current injury report is available for this matchup.
Head-to-Head
Historical meetings are not available for this matchup.
Game Information
StageWeek 4
Season2026
KickoffSat, Sep 26, 10:30 pm
VenueMackay Stadium
LocationReno, NV
SurfaceArtificial Turf
BroadcastFS1
Attendance20,673
Division Standings
FBS — Mountain West Conference
| Team | W | L | T | Pct | PF | PA | Home | Away | Strk |
|---|---|---|---|---|---|---|---|---|---|
 North Dakota State | 7 | 2 | 0 | 0.778 | 253 | 107 | 5-0 | 2-2 | W1 |
 UNLV | 5 | 3 | 0 | 0.625 | 200 | 190 | 3-1 | 2-2 | W1 |
 Wyoming | 5 | 3 | 0 | 0.625 | 156 | 160 | 4-0 | 1-3 | W3 |
| Air Force | 6 | 2 | 0 | 0.750 | 234 | 172 | 4-1 | 2-1 | W1 |
 New Mexico | 7 | 1 | 0 | 0.875 | 280 | 95 | 4-0 | 3-1 | W5 |
 San José State | 4 | 5 | 0 | 0.444 | 179 | 201 | 1-3 | 3-2 | L2 |
 UTEP | 1 | 7 | 0 | 0.125 | 113 | 292 | 1-3 | 0-4 | L6 |
 Northern Illinois | 0 | 8 | 0 | 0.000 | 130 | 301 | 0-3 | 0-5 | L8 |
| Nevada | 3 | 5 | 0 | 0.375 | 184 | 181 | 2-2 | 1-3 | L1 |
 Hawai'i | 2 | 6 | 0 | 0.250 | 166 | 196 | 1-3 | 1-3 | W1 |
Air Force
5th in Mountain West
VS
Nevada
6th in Mountain West
Quarterbacks & Specialists
#94
Will Duncan
#4
Kemper Hodges
#9
Liam Szarka
Receivers & Backs
#2
Owen Allen
#44
Rocco Conti
#10
Adam Hrynciw
#80
Simon Kibbee
#28
Gage LaDue
#3
Matt Long
#25
Harris Vinson
#19
Grant Wayne
Defensive Line & Linebackers
#90
Muhammad Alcine
#44
Jonah Bowman
#8
Dallas Daley
Luke Fisher
#6
Blake Fletcher
#47
Jake Kepler
#48
Antonio Menard
#45
Jaylin Reese
#93
Andrew Tillett
#92
Connor Vasek
#97
Bennett Williams
Defensive Backs
#24
Jordan Elie-Stuart
#2
Korey Johnson
#36
Max Mustell
#22
Ehimen Oyamendan
#23
Cade Paterson
#40
Jaxon Paulsrud
Other
#90
Carter Cremascoli
Quarterbacks & Specialists
#95
Ewan Baulch
#10
AJ Bianco
#6
Carter Jones
Receivers & Backs
#16
DJ Asiasi
#9
Marshaun Brown
#5
Donnie Cheers
#3
Jaceon Doss
#7
Gary Givens III
#18
Don Henry
Dominic Kelley
#11
Damien Morgan
#14
Gerick Robinson
#1
Herschel Turner
#25
Ky Woods
Defensive Line & Linebackers
#91
James Gillespie
#90
Jason Hemphill II
#1
Jeremy Naborne-Owens
#98
David Paine Jr.
#2
EJ Smith
#10
Logologo Va'a
Defensive Backs
#5
Zion Jones
#26
Isaiah Jordan
Joshua Scott
#12
Bryson Snelling
#15
Bishop Turner
#8
Larry Turner-Gooden
#18
Aiden Walker
Other
#32
Dylan LaBarbera
#84
Joe McFadden
#92
Myles Williams
Air Force
5th in Mountain West
VS
Nevada
6th in Mountain West
Passing
47.8
Completion Percentage
53.4
33
Completions
118
5.80
Interception Percentage
5.40
4
Interceptions
12
35
Longest Pass
73
473
Net Passing Yards
1,352
59.1
Net Passing Yards Per Game
169.0
69
Passing Attempts
221
5.80
Passing Touchdown %
3.60
4
Passing Touchdowns
8
113.3
Passer Rating
105.8
6
Total Sacks
12
36
Sack Yards Lost
78
6.9
Yards Per Pass Attempt
6.1
473
Passing Yards
1,352
0
Passing Fumbles Lost
0
8
Team Games Played
8
400.1
Yards Per Game
336.0
29.3
Total Points Per Game
23.0
234
Total Points
184
30
Total Touchdowns
22
59.1
Passing Yards Per Game
169.0
33-69
Comp-Att
118-221
6-36
Sacks-Yards Lost
12-78
Rushing
517
Rushing Attempts
295
2,728
Rushing Yards
1,336
5.3
Yards Per Rush Attempt
4.5
62
Long Rushing
72
0
20+ Yard Rushing Plays
0
25
Rushing Touchdowns
14
341.0
Rushing Yards Per Game
167.0
0
Rushing Fumbles
0
0
Rushing Fumbles Lost
0
154
Rushing 1st downs
69
8
Team Games Played
8
3,201
Total Yards
2,688
592
Total Offensive Plays
528
29.3
Total Points Per Game
23.0
234
Total Points
184
30
Total Touchdowns
22
Receiving
33
Receptions
118
0
Receiving Targets
0
473
Receiving Yards
1,352
473
Receiving Yards
1,352
4
Receiving Touchdowns
8
35
Long Reception
73
0
20+ Yard Receiving Plays
0
59.1
Receiving Yards Per Game
169.0
0
Receiving Fumbles
0
0
Receiving Fumbles Lost
0
139
Receiving Yards After Catch
635
24
Receiving First Downs
58
8
Team Games Played
8
14.3
Yards Per Reception
11.5
29.3
Total Points Per Game
23.0
234
Total Points
184
30
Total Touchdowns
22
Miscellaneous
188
Total 1st downs
142
154
Rushing 1st downs
69
24
Passing 1st downs
58
10
1st downs by penalty
15
61
Third Down Conversions
43
118
Third Down Attempts
112
51.69
3rd down %
38.39
20
Fourth Down Conversions
8
24
First Downs Attempts
16
83.33
4th down %
50.00
41
Total Penalties
49
369
Total Penalty Yards
429
17629
Possession Time Seconds
13691
0.00
Red Zone Field Goal Percentage
0.00
0.00
Red Zone Scoring Percentage
0.00
0.00
Red Zone Efficiency Percentage
0.00
0.00
Red Zone Touchdown Percentage
0.00
6
Total Takeaways
14
7
Total Giveaways
16
-1
Turnover Ratio
-2
0
Fumbles Lost
0
61-118
3rd down efficiency
43-112
20-24
4th down efficiency
8-16
41-369
Total-Yards
49-429
Defense
196
Solo Tackles
316
192
Assist Tackles
202
388
Total Tackles
518
12
Sacks
18
78
Sack Yards
96
45
Stuffs
54
25
Passes Defended
32
23.2
Average Interception Yards
0.0
85
Long Interception
0
0
Miscellaneous Touchdowns
0
0
Kicks Blocked
1
20
Tackles For Loss
37
8
Team Games Played
8
Defensive Interceptions
5
Interceptions
1
116
Interception Yards
0
1
Interception Touchdowns
0
5-116
INT: Total
1-0
General
3
Fumbles
6
3
Forced Fumbles
4
2
Fumbles Recovered
2
0
Fumbles Touchdowns
0
8
Games Played
8
3-0
Fumbles-Lost
6-0
Returning
2
Kick Returns
9
39
Kick Return Yards
291
19.5
Yards Per Kick Return
32.3
21
Long Kick Return
90
0
Kick Return Touchdowns
0
1
Punt Returns
17
0
Punt Return Yards
218
0.0
Yards Per Punt Return
12.8
0
Long Punt Return
43
0
Punt Return Touchdowns
0
0
Punt Return Fair Catches
0
0
Kick Return Fumbles Lost
0
0
Punt Return Fumbles Lost
0
8
Team Games Played
8
1-0
Punt: Total
17-218
Kicking
9
Field Goal Made
10
10
Field Goal Attempts
13
90.0
Field Goal Percentage
76.9
52
Long Field Goal Made
45
0
Field Goal Attempts 1-19
0
3
Field Goal Attempts 20-29
2
4
Field Goal Attempts 30-39
7
2
Field Goal Attempts 40-49
2
1
Field Goal Attempts 50+
2
25
Extra Points Made
20
26
Extra Point Attempts
20
96.2
Extra Point Percentage
100.0
0
Field Goals Made 1-19
0
2
Field Goals Made 20-29
2
4
Field Goals Made 30-39
7
2
Field Goals Made 40-49
1
1
Field Goals Made 50+
0
52
Total Kicking Points
50
8
Team Games Played
8
98
Touchback Percentage
55
0.0
Average Kickoff Return Yards
0.0
0
Kickoff Return Yards
0
0
Kickoff Returns
0
0-0
Kickoffs: Total
0-0
9-10
FG: Good-Attempts
10-13
Punting
18
Punts
33
861
Punt Yards
1,422
68
Long Punt
61
47.8
Gross Average Punt Yards
43.1
47.8
Net Average Punt Yards
43.1
0
Punts Blocked
0
8
Punts Inside 20
9
2
Touchbacks
1
3
Fair Catches
17
5
Punt Returns
11
0
Punt Return Yards
0
0.0
Average Punt Return Yards
0.0
8
Team Games Played
8
18-861
Punt: Total Yards
33-1,422
Scoring
25
Rushing Touchdowns
14
4
Receiving Touchdowns
8
0
Return Touchdowns
0
29
Total Touchdowns
22
9
Field Goals
10
25
Kick Extra Points
20
1
Total Two Point Conversions
1
234
Total Points
184
29.3
Total Points Per Game
23.0