

Alabama vs Kentucky Live Score (12 Sep, 2026)
Score by Quarter
| Team | Q1 | Q2 | Q3 | Q4 | Final |
|---|---|---|---|---|---|
 Alabama |
7 | 6 | 18 | 14 | 45 |
 Kentucky |
7 | 10 | 0 | 0 | 17 |
Scoring Plays
Q1
10:11
10:11
Mi'Quise Humphrey-Grace 2 Yd Interception Return (Adam Zouagui Kick)
Interception Return Touchdown
0 – 7
Q1
6:35
6:35
Luke Metz 34 Yd Interception Return (Conor Talty Kick)
Interception Return Touchdown
7 – 7
Q2
14:56
14:56
Henry Boyer 20 Yd pass from Kenny Minchey (Adam Zouagui Kick)
Passing Touchdown
7 – 14
Q2
9:27
9:27
Conor Talty 25 Yd Field Goal
Field Goal Good
10 – 14
Q2
2:09
2:09
Conor Talty 41 Yd Field Goal
Field Goal Good
13 – 14
Q2
0:00
0:00
Adam Zouagui 39 Yd Field Goal
Field Goal Good
13 – 17
Q3
7:10
7:10
Conor Talty 34 Yd Field Goal
Field Goal Good
16 – 17
Q3
3:00
3:00
EJ Crowell 3 Yd Run (Conor Talty Kick)
Rushing Touchdown
23 – 17
Q3
0:24
0:24
Daniel Hill 3 Yd Run (Keelon Russell Pass to Lotzeir Brooks for Two-Point Conversion)
Rushing Touchdown
31 – 17
Q4
9:08
9:08
Rico Scott 5 Yd pass from Keelon Russell (Conor Talty Kick)
Passing Touchdown
38 – 17
Q4
4:11
4:11
Trae'shawn Brown 4 Yd Run (Conor Talty Kick)
Rushing Touchdown
45 – 17
Game Leaders
AlabamaKentucky
 K. Russell QB
Passing Yards
 K. Minchey QB
 D. Hill RB
Rushing Yards
 J. Patterson RB
 L. Brooks WR
Receiving Yards
 W. Rodriguez TE
 D. Thompkins DL
Sacks
 T. Gadson DL
 C. Woodson LB
Tackles
 T. Bryant DB
Player Box Score
Alabama| Player | C/ATT | YDS | AVG | TD | INT | QBR |
|---|---|---|---|---|---|---|
| Keelon Russell#12 | 16/23 | 188 | 8.2 | 1 | 2 | 38.9 |
Kentucky| Player | C/ATT | YDS | AVG | TD | INT | QBR |
|---|---|---|---|---|---|---|
| Kenny Minchey#3 | 18/31 | 146 | 4.7 | 1 | 1 | 44.5 |
 Team | 0/1 | 0 | 0.0 | 0 | 0 | -- |
Alabama| Player | CAR | YDS | AVG | TD | LONG |
|---|---|---|---|---|---|
| Daniel Hill#4 | 18 | 104 | 5.8 | 1 | 31 |
 Trae'shawn Brown#17 | 5 | 22 | 4.4 | 1 | 11 |
 Red Morgan#6 | 4 | 18 | 4.5 | 0 | 8 |
 EJ Crowell#13 | 3 | 17 | 5.7 | 1 | 19 |
| Lotzeir Brooks#3 | 1 | 3 | 3.0 | 0 | 3 |
 Marshall Pritchett#9 | 1 | 0 | 0.0 | 0 | 0 |
| Keelon Russell#12 | 8 | -9 | -1.1 | 0 | 16 |
Kentucky| Player | CAR | YDS | AVG | TD | LONG |
|---|---|---|---|---|---|
| Jason Patterson#26 | 11 | 53 | 4.8 | 0 | 10 |
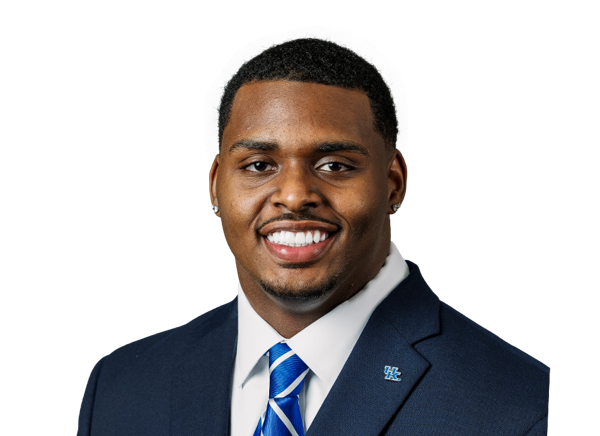 CJ Baxter#1 | 11 | 29 | 2.6 | 0 | 12 |
 Henry Boyer#87 | 1 | 2 | 2.0 | 0 | 2 |
 Jovantae Barnes#2 | 3 | -2 | -0.7 | 0 | 0 |
| Kenny Minchey#3 | 6 | -19 | -3.2 | 0 | 4 |
Alabama| Player | REC | YDS | AVG | TD | LONG |
|---|---|---|---|---|---|
| Lotzeir Brooks#3 | 5 | 54 | 10.8 | 0 | 23 |
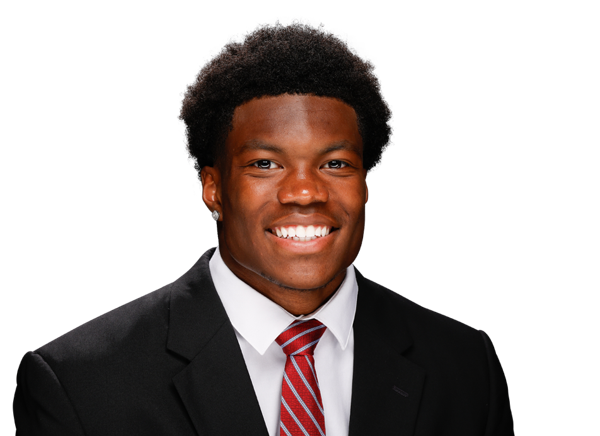 Rico Scott#7 | 3 | 44 | 14.7 | 1 | 32 |
 Ryan Coleman-Williams#1 | 4 | 43 | 10.8 | 0 | 23 |
| Marshall Pritchett#9 | 1 | 27 | 27.0 | 0 | 27 |
| Daniel Hill#4 | 2 | 12 | 6.0 | 0 | 9 |
| Trae'shawn Brown#17 | 1 | 8 | 8.0 | 0 | 8 |
Kentucky| Player | REC | YDS | AVG | TD | LONG |
|---|---|---|---|---|---|
| Willie Rodriguez#81 | 8 | 49 | 6.1 | 0 | 18 |
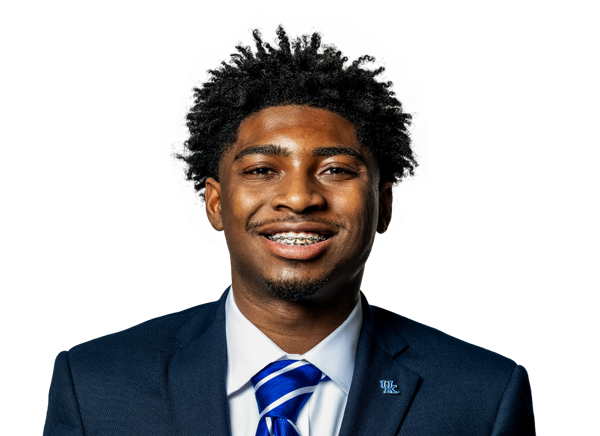 Kenny Darby#19 | 5 | 45 | 9.0 | 0 | 24 |
| Henry Boyer#87 | 1 | 20 | 20.0 | 1 | 20 |
| CJ Baxter#1 | 2 | 15 | 7.5 | 0 | 9 |
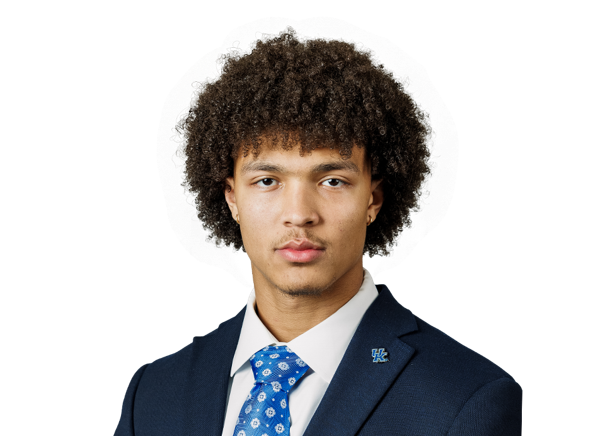 Nic Anderson#4 | 1 | 13 | 13.0 | 0 | 13 |
| Jovantae Barnes#2 | 1 | 4 | 4.0 | 0 | 4 |
Alabama| Player | TOT | SOLO | SACKS | TFL | PD | QB HUR | TD |
|---|---|---|---|---|---|---|---|
| Caleb Woodson#7 | 12 | 4 | 2 | 2 | 0 | 0 | 0 |
 Luke Metz#4 | 8 | 3 | 0 | 0 | 0 | 1 | 1 |
| Devan Thompkins#1 | 6 | 4 | 2 | 2 | 0 | 0 | 0 |
| Red Morgan#6 | 5 | 3 | 0 | 0.5 | 0 | 0 | 0 |
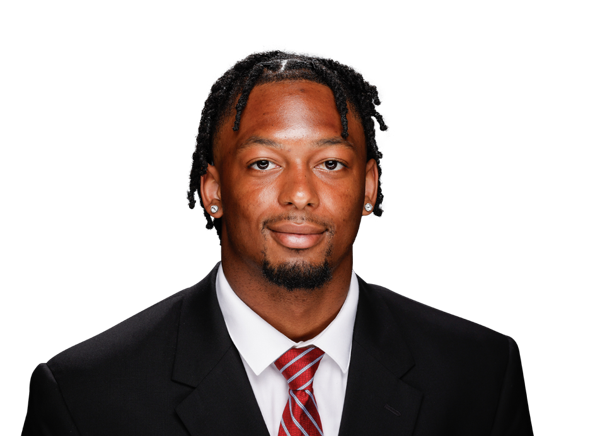 Keon Sabb#3 | 4 | 4 | 0 | 0 | 1 | 0 | 0 |
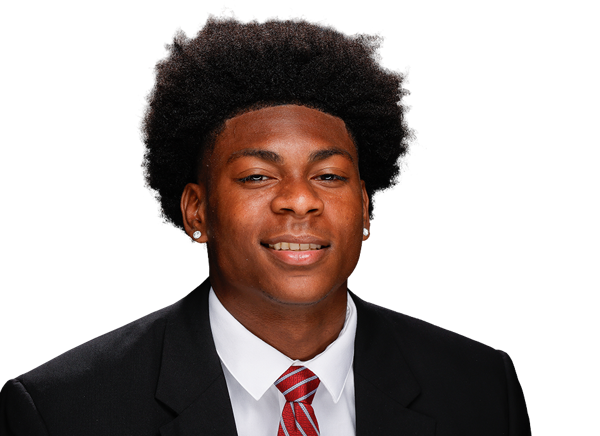 Chuck McDonald III#19 | 4 | 2 | 0 | 0 | 1 | 0 | 0 |
 QB Reese#36 | 4 | 2 | 0 | 0 | 0 | 0 | 0 |
 Bray Hubbard#18 | 3 | 1 | 0 | 0.5 | 0 | 1 | 0 |
 Kedrick Bingley-Jones#22 | 3 | 0 | 0 | 0 | 0 | 0 | 0 |
 Justin Hill#8 | 2 | 2 | 0 | 0 | 0 | 0 | 0 |
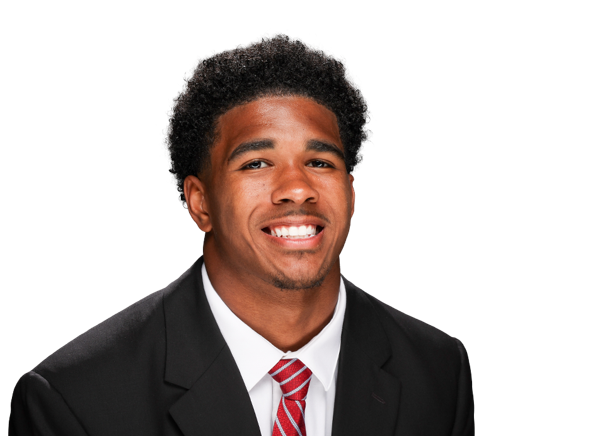 Dijon Lee Jr.#5 | 2 | 1 | 0 | 0 | 0 | 0 | 0 |
 Ivan Taylor#13 | 2 | 0 | 0 | 0 | 0 | 0 | 0 |
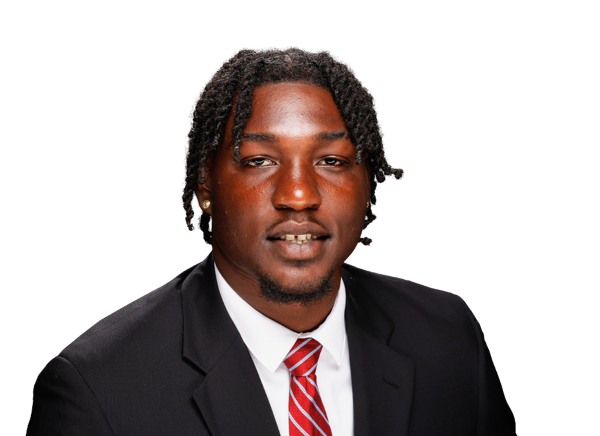 Yhonzae Pierre | 1 | 1 | 0 | 0 | 1 | 1 | 0 |
 Dre Kirkpatrick Jr.#21 | 1 | 1 | 0 | 0 | 0 | 0 | 0 |
 Abduall Sanders Jr.#35 | 1 | 1 | 0 | 0 | 0 | 0 | 0 |
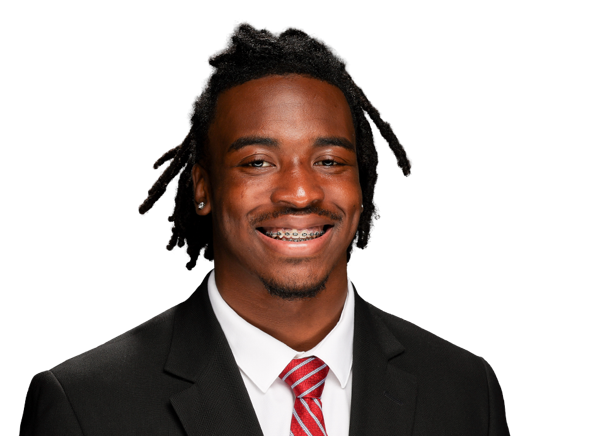 Jireh Edwards#10 | 1 | 1 | 0 | 1 | 0 | 0 | 0 |
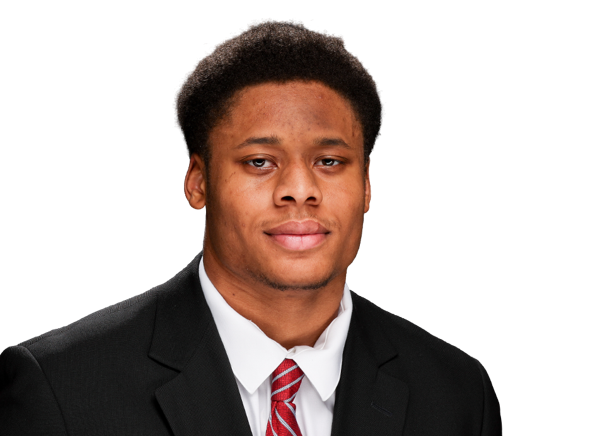 Xavier Griffin#11 | 1 | 1 | 0 | 0 | 0 | 0 | 0 |
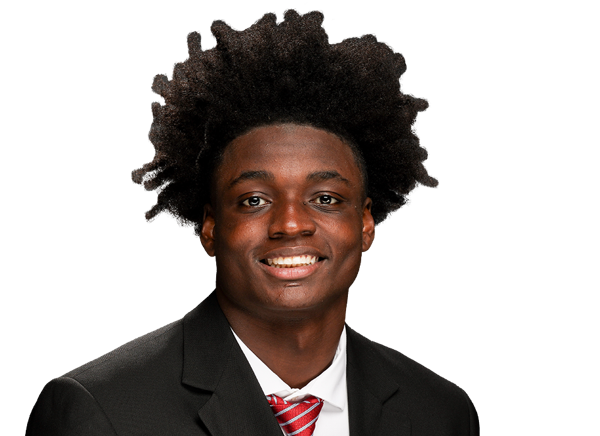 Carmelo O'Neal#28 | 1 | 1 | 0 | 0 | 0 | 0 | 0 |
 Desmond Umeozulu#9 | 1 | 0 | 0 | 0 | 0 | 0 | 0 |
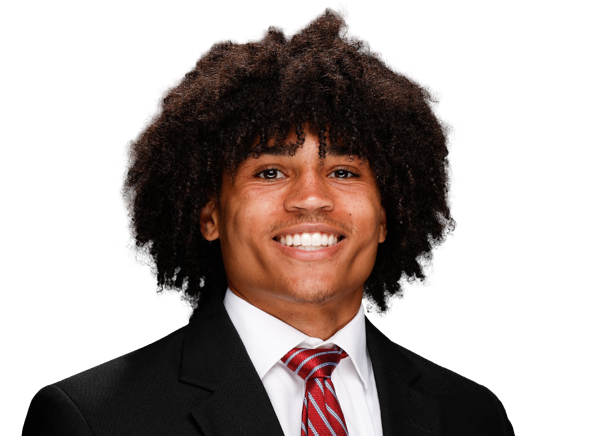 Zabien Brown#2 | 1 | 0 | 0 | 0 | 0 | 0 | 0 |
 Terrance Green#99 | 1 | 0 | 0 | 0 | 0 | 0 | 0 |
 Isaia Faga#88 | 0 | 0 | 0 | 0 | 0 | 1 | 0 |
Kentucky| Player | TOT | SOLO | SACKS | TFL | PD | QB HUR | TD |
|---|---|---|---|---|---|---|---|
| Ty Bryant#14 | 10 | 3 | 0.5 | 0.5 | 0 | 0 | 0 |
 Jordan Castell#5 | 9 | 5 | 0 | 0 | 0 | 0 | 0 |
 Grant Godfrey#22 | 7 | 3 | 1 | 1 | 0 | 0 | 0 |
 Hasaan Sykes#12 | 6 | 2 | 0 | 1 | 0 | 0 | 0 |
| Tavion Gadson#94 | 5 | 2 | 1.5 | 2 | 1 | 0 | 0 |
 Aaron Gates#3 | 5 | 2 | 0 | 0 | 0 | 0 | 0 |
 Mi'Quise Humphrey-Grace#90 | 4 | 2 | 1 | 1.5 | 0 | 0 | 1 |
 Elijah Barnes | 3 | 0 | 0 | 0 | 0 | 0 | 0 |
 Isaiah McMillian#27 | 3 | 0 | 0 | 0 | 0 | 0 | 0 |
 Lorenzo Cowan#8 | 2 | 2 | 0 | 0 | 0 | 0 | 0 |
 Demarcus Gardner#28 | 2 | 2 | 0 | 0 | 0 | 0 | 0 |
 Jaden Williams#91 | 2 | 1 | 0 | 1 | 0 | 0 | 0 |
 Sam Greene#2 | 2 | 1 | 0 | 0 | 1 | 0 | 0 |
 Dyllon Williams#10 | 2 | 1 | 0 | 0 | 0 | 0 | 0 |
 Tavion Wallace#25 | 1 | 1 | 0 | 0 | 0 | 0 | 0 |
 Antwan Smith#4 | 1 | 1 | 0 | 0 | 0 | 0 | 0 |
 Grant Grayton#30 | 1 | 1 | 0 | 0 | 0 | 0 | 0 |
 Kevis Thomas#19 | 1 | 0 | 0 | 0 | 0 | 0 | 0 |
 Cedric Works#15 | 1 | 0 | 0 | 0 | 3 | 0 | 0 |
Alabama| Player | FUM | LOST | REC |
|---|---|---|---|
| Keelon Russell#12 | 1 | 1 | 0 |
| Team | 1 | 0 | 0 |
| Ivan Taylor#13 | 0 | 0 | 1 |
| Isaia Faga#88 | 0 | 0 | 1 |
Kentucky| Player | FUM | LOST | REC |
|---|---|---|---|
| Kenny Minchey#3 | 1 | 1 | 0 |
| Jason Patterson#26 | 1 | 1 | 0 |
| CJ Baxter#1 | 1 | 0 | 0 |
| Willie Rodriguez#81 | 1 | 0 | 0 |
| Cedric Works#15 | 0 | 0 | 1 |
Alabama| Player | FG | PCT | LONG | XP | PTS |
|---|---|---|---|---|---|
 Conor Talty#31 | 3/3 | 100.0 | 41 | 4/4 | 13 |
Kentucky| Player | FG | PCT | LONG | XP | PTS |
|---|---|---|---|---|---|
 Adam Zouagui#88 | 1/1 | 100.0 | 39 | 2/2 | 5 |
Alabama| Player | NO | YDS | AVG | TB | In 20 | LONG |
|---|---|---|---|---|---|---|
 Alex Asparuhov#32 | 1 | 54 | 54.0 | 0 | 0 | 54 |
Kentucky| Player | NO | YDS | AVG | TB | In 20 | LONG |
|---|---|---|---|---|---|---|
 Thomas O'Hara#48 | 5 | 204 | 40.8 | 1 | 0 | 46 |
Kentucky| Player | NO | YDS | AVG | LONG | TD |
|---|---|---|---|---|---|
 Ja'Kayden Ferguson#5 | 2 | 33 | 16.5 | 17 | 0 |
Alabama| Player | NO | YDS | AVG | LONG | TD |
|---|---|---|---|---|---|
| Ryan Coleman-Williams#1 | 1 | 12 | 12.0 | 12 | 0 |
Kentucky| Player | NO | YDS | AVG | LONG | TD |
|---|---|---|---|---|---|
 Brock Coffman#12 | 1 | 0 | 0.0 | 0 | 0 |
Alabama| Player | INT | YDS | TD |
|---|---|---|---|
| Luke Metz#4 | 1 | 34 | 1 |
Kentucky| Player | INT | YDS | TD |
|---|---|---|---|
| Mi'Quise Humphrey-Grace#90 | 1 | 2 | 1 |
| Jordan Castell#5 | 1 | 0 | 0 |
Drive Summary
UK
Punt
31
ALA
Interception Touchdown
-12
ALA
Fumble
48
UK
Interception Touchdown
4
UK
Touchdown
83
ALA
Field Goal
68
UK
Punt
9
ALA
Field Goal
44
UK
Punt
2
ALA
Interception
-9
UK
Field Goal
33
ALA
Punt
1
UK
Punt
13
ALA
Field Goal
43
UK
Fumble
-4
ALA
Touchdown
21
UK
Downs
9
ALA
Touchdown
34
UK
Punt
3
ALA
Touchdown
74
UK
Downs
18
ALA
Touchdown
43
UK
Fumble
18
ALA
End of Half
18
Injury Report
No current injury report is available for this matchup.
Head-to-Head
Historical meetings are not available for this matchup.
Game Information
StageWeek 2
Season2026
KickoffSat, Sep 12, 3:30 pm
VenueKroger Field
LocationLexington, KY
SurfaceArtificial Turf
BroadcastABC, Disney+
Attendance61,820
Division Standings
FBS — Southeastern Conference
| Team | W | L | T | Pct | PF | PA | Home | Away | Strk |
|---|---|---|---|---|---|---|---|---|---|
| Alabama | 8 | 2 | 0 | 0.800 | 358 | 189 | 4-1 | 4-1 | W3 |
 Auburn | 6 | 4 | 0 | 0.600 | 260 | 246 | 4-2 | 2-2 | W2 |
 Florida | 6 | 4 | 0 | 0.600 | 313 | 262 | 3-2 | 3-2 | W1 |
 Georgia | 9 | 1 | 0 | 0.900 | 418 | 147 | 6-1 | 3-0 | W3 |
 LSU | 6 | 4 | 0 | 0.600 | 355 | 181 | 5-2 | 1-2 | L2 |
 Mississippi State | 4 | 6 | 0 | 0.400 | 245 | 291 | 2-4 | 2-2 | L6 |
 Missouri | 6 | 4 | 0 | 0.600 | 293 | 229 | 4-1 | 2-3 | L2 |
 Ole Miss | 6 | 3 | 0 | 0.667 | 304 | 234 | 5-1 | 1-2 | L1 |
 South Carolina | 6 | 4 | 0 | 0.600 | 318 | 245 | 4-2 | 2-2 | L1 |
 Tennessee | 8 | 2 | 0 | 0.800 | 314 | 143 | 5-1 | 3-1 | W2 |
 Texas | 8 | 2 | 0 | 0.800 | 302 | 178 | 5-1 | 3-1 | W4 |
 Texas A&M | 4 | 6 | 0 | 0.400 | 242 | 190 | 4-2 | 0-4 | L3 |
 Vanderbilt | 4 | 6 | 0 | 0.400 | 213 | 286 | 3-3 | 1-3 | L1 |
 Arkansas | 4 | 6 | 0 | 0.400 | 214 | 253 | 3-3 | 1-3 | W1 |
 Oklahoma | 5 | 4 | 0 | 0.556 | 199 | 173 | 3-2 | 2-2 | W1 |
| Kentucky | 7 | 3 | 0 | 0.700 | 283 | 253 | 4-2 | 3-1 | L2 |
Alabama
2nd in SEC
VS
Kentucky
5th in SEC
Quarterbacks & Specialists
#32
Alex Asparuhov
#12
Keelon Russell
Receivers & Backs
#3
Lotzeir Brooks
#17
Trae'shawn Brown
#1
Ryan Coleman-Williams
#13
EJ Crowell
#4
Daniel Hill
#9
Marshall Pritchett
#7
Rico Scott
Defensive Line & Linebackers
#22
Kedrick Bingley-Jones
#88
Isaia Faga
#99
Terrance Green
#11
Xavier Griffin
#8
Justin Hill
#4
Luke Metz
Yhonzae Pierre
#36
QB Reese
#35
Abduall Sanders Jr.
#1
Devan Thompkins
#9
Desmond Umeozulu
#7
Caleb Woodson
Defensive Backs
#2
Zabien Brown
#10
Jireh Edwards
#18
Bray Hubbard
#21
Dre Kirkpatrick Jr.
#5
Dijon Lee Jr.
#19
Chuck McDonald III
#6
Red Morgan
#28
Carmelo O'Neal
#3
Keon Sabb
#13
Ivan Taylor
Other
#31
Conor Talty
Quarterbacks & Specialists
#3
Kenny Minchey
#48
Thomas O'Hara
Receivers & Backs
#4
Nic Anderson
#2
Jovantae Barnes
#1
CJ Baxter
#87
Henry Boyer
#12
Brock Coffman
#19
Kenny Darby
#5
Ja'Kayden Ferguson
#26
Jason Patterson
#81
Willie Rodriguez
Defensive Line & Linebackers
Elijah Barnes
#8
Lorenzo Cowan
#94
Tavion Gadson
#22
Grant Godfrey
#2
Sam Greene
#90
Mi'Quise Humphrey-Grace
#4
Antwan Smith
#25
Tavion Wallace
#91
Jaden Williams
#15
Cedric Works
Defensive Backs
#14
Ty Bryant
#5
Jordan Castell
#28
Demarcus Gardner
#3
Aaron Gates
#30
Grant Grayton
#27
Isaiah McMillian
#12
Hasaan Sykes
#19
Kevis Thomas
#10
Dyllon Williams
Other
#88
Adam Zouagui
Alabama
2nd in SEC
VS
Kentucky
5th in SEC
Passing
67.1
Completion Percentage
68.4
190
Completions
201
2.10
Interception Percentage
0.70
6
Interceptions
2
75
Longest Pass
53
2,503
Net Passing Yards
2,160
250.3
Net Passing Yards Per Game
216.0
283
Passing Attempts
294
7.40
Passing Touchdown %
5.10
21
Passing Touchdowns
15
161.3
Passer Rating
145.2
28
Total Sacks
22
177
Sack Yards Lost
148
8.8
Yards Per Pass Attempt
7.3
2,503
Passing Yards
2,160
0
Passing Fumbles Lost
0
10
Team Games Played
10
388.9
Yards Per Game
369.4
35.8
Total Points Per Game
28.3
358
Total Points
283
46
Total Touchdowns
35
250.3
Passing Yards Per Game
216.0
190-283
Comp-Att
201-294
28-177
Sacks-Yards Lost
22-148
Rushing
339
Rushing Attempts
342
1,386
Rushing Yards
1,534
4.1
Yards Per Rush Attempt
4.5
58
Long Rushing
77
0
20+ Yard Rushing Plays
0
20
Rushing Touchdowns
17
138.6
Rushing Yards Per Game
153.4
0
Rushing Fumbles
0
0
Rushing Fumbles Lost
0
79
Rushing 1st downs
80
10
Team Games Played
10
3,889
Total Yards
3,694
650
Total Offensive Plays
658
35.8
Total Points Per Game
28.3
358
Total Points
283
46
Total Touchdowns
35
Receiving
190
Receptions
201
0
Receiving Targets
0
2,503
Receiving Yards
2,160
2,503
Receiving Yards
2,160
21
Receiving Touchdowns
15
75
Long Reception
53
0
20+ Yard Receiving Plays
0
250.3
Receiving Yards Per Game
216.0
0
Receiving Fumbles
0
0
Receiving Fumbles Lost
0
1026
Receiving Yards After Catch
1273
100
Receiving First Downs
103
10
Team Games Played
10
13.2
Yards Per Reception
10.7
35.8
Total Points Per Game
28.3
358
Total Points
283
46
Total Touchdowns
35
Miscellaneous
198
Total 1st downs
198
79
Rushing 1st downs
80
100
Passing 1st downs
103
19
1st downs by penalty
14
50
Third Down Conversions
42
121
Third Down Attempts
116
41.32
3rd down %
36.21
6
Fourth Down Conversions
10
9
First Downs Attempts
20
66.67
4th down %
50.00
68
Total Penalties
48
481
Total Penalty Yards
408
18133
Possession Time Seconds
18679
0.00
Red Zone Field Goal Percentage
0.00
0.00
Red Zone Scoring Percentage
0.00
0.00
Red Zone Efficiency Percentage
0.00
0.00
Red Zone Touchdown Percentage
0.00
14
Total Takeaways
9
14
Total Giveaways
9
0
Turnover Ratio
0
0
Fumbles Lost
0
50-121
3rd down efficiency
42-116
6-9
4th down efficiency
10-20
68-481
Total-Yards
48-408
Defense
313
Solo Tackles
337
354
Assist Tackles
322
667
Total Tackles
659
29
Sacks
23
170
Sack Yards
131
90
Stuffs
70
35
Passes Defended
43
17.2
Average Interception Yards
13.4
39
Long Interception
43
0
Miscellaneous Touchdowns
0
0
Kicks Blocked
0
47
Tackles For Loss
41
10
Team Games Played
10
Defensive Interceptions
13
Interceptions
12
224
Interception Yards
161
5
Interception Touchdowns
2
13-224
INT: Total
12-161
General
12
Fumbles
12
9
Forced Fumbles
5
8
Fumbles Recovered
7
0
Fumbles Touchdowns
0
10
Games Played
10
12-0
Fumbles-Lost
12-0
Returning
11
Kick Returns
11
321
Kick Return Yards
189
29.2
Yards Per Kick Return
17.2
83
Long Kick Return
27
0
Kick Return Touchdowns
0
12
Punt Returns
12
119
Punt Return Yards
101
9.9
Yards Per Punt Return
8.4
32
Long Punt Return
55
0
Punt Return Touchdowns
1
0
Punt Return Fair Catches
0
0
Kick Return Fumbles Lost
0
0
Punt Return Fumbles Lost
0
10
Team Games Played
10
12-119
Punt: Total
12-101
Kicking
12
Field Goal Made
12
14
Field Goal Attempts
16
85.7
Field Goal Percentage
75.0
47
Long Field Goal Made
52
0
Field Goal Attempts 1-19
0
2
Field Goal Attempts 20-29
5
4
Field Goal Attempts 30-39
5
8
Field Goal Attempts 40-49
5
0
Field Goal Attempts 50+
1
44
Extra Points Made
33
44
Extra Point Attempts
33
100.0
Extra Point Percentage
100.0
0
Field Goals Made 1-19
0
2
Field Goals Made 20-29
4
3
Field Goals Made 30-39
4
7
Field Goals Made 40-49
3
0
Field Goals Made 50+
1
80
Total Kicking Points
69
10
Team Games Played
10
84
Touchback Percentage
76
0.0
Average Kickoff Return Yards
0.0
0
Kickoff Return Yards
0
0
Kickoff Returns
0
0-0
Kickoffs: Total
0-0
12-14
FG: Good-Attempts
12-16
Punting
37
Punts
33
1,629
Punt Yards
1,385
54
Long Punt
58
44.0
Gross Average Punt Yards
42.0
44.0
Net Average Punt Yards
42.0
0
Punts Blocked
0
20
Punts Inside 20
10
1
Touchbacks
3
15
Fair Catches
9
12
Punt Returns
10
0
Punt Return Yards
0
0.0
Average Punt Return Yards
0.0
10
Team Games Played
10
37-1,629
Punt: Total Yards
33-1,385
Scoring
20
Rushing Touchdowns
17
21
Receiving Touchdowns
15
0
Return Touchdowns
1
41
Total Touchdowns
33
12
Field Goals
12
44
Kick Extra Points
33
1
Total Two Point Conversions
2
358
Total Points
283
35.8
Total Points Per Game
28.3