

Arizona State vs Texas A&M Live Score (12 Sep, 2026)
Score by Quarter
| Team | Q1 | Q2 | Q3 | Q4 | Final |
|---|---|---|---|---|---|
 Arizona State |
7 | 3 | 10 | 0 | 20 |
 Texas A&M |
7 | 10 | 7 | 24 | 48 |
Scoring Plays
Q1
4:55
4:55
Rueben Owens II 2 Yd Run (David Olano Kick)
Rushing Touchdown
0 – 7
Q1
0:21
0:21
Reed Harris 21 Yd pass from Cutter Boley (Carson Smith Kick)
Pass Reception
7 – 7
Q2
9:15
9:15
Isaiah Horton 4 Yd pass from Marcel Reed (David Olano Kick)
Passing Touchdown
7 – 14
Q2
6:15
6:15
Carson Smith 30 Yd Field Goal
Field Goal Good
10 – 14
Q2
0:03
0:03
David Olano 22 Yd Field Goal
Field Goal Good
10 – 17
Q3
10:19
10:19
Carson Smith 35 Yd Field Goal
Field Goal Good
13 – 17
Q3
5:53
5:53
Isaiah Horton 13 Yd pass from Marcel Reed (David Olano Kick)
Passing Touchdown
13 – 24
Q3
3:39
3:39
Reed Harris 58 Yd pass from Cutter Boley (Carson Smith Kick)
Passing Touchdown
20 – 24
Q4
14:20
14:20
Mario Craver 33 Yd pass from Marcel Reed (David Olano Kick)
Passing Touchdown
20 – 31
Q4
8:38
8:38
Marco Jones 55 Yd Interception Return (David Olano Kick)
Interception Return Touchdown
20 – 38
Q4
5:58
5:58
David Olano 39 Yd Field Goal
Field Goal Good
20 – 41
Q4
4:25
4:25
Julio Humphrey 45 Yd Interception Return (David Olano Kick)
Interception Return Touchdown
20 – 48
Game Leaders
Arizona StateTexas A&M
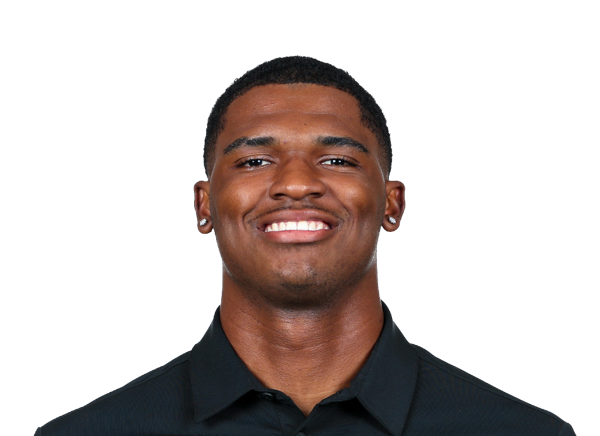
 C. Boley QB
Passing Yards
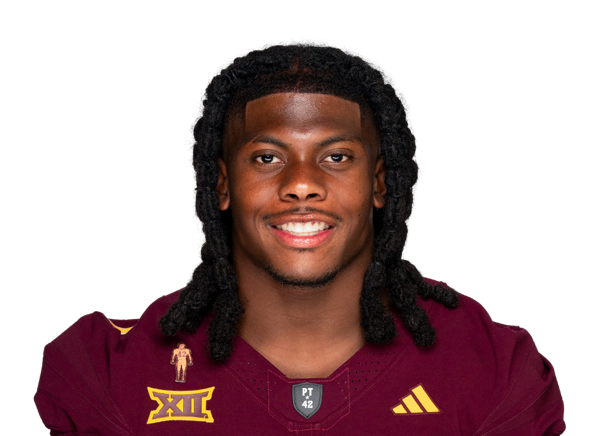
 M. Reed QB
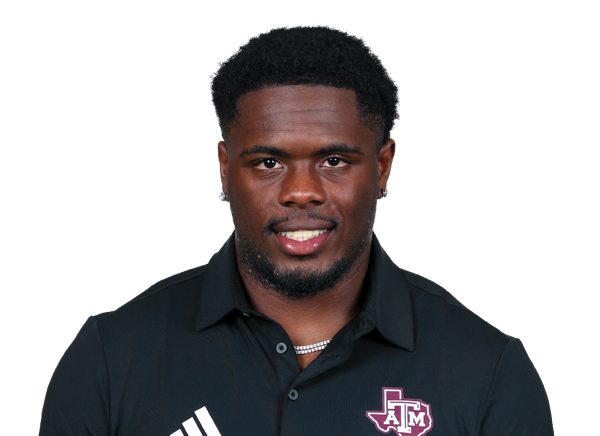
 K. Brown RB
Rushing Yards
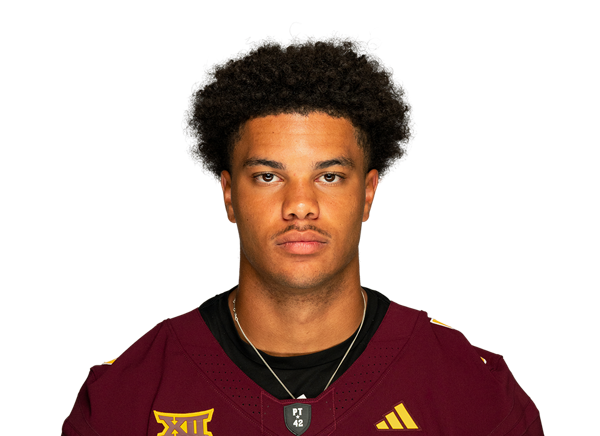
 R. Owens II RB
 R. Harris WR
Receiving Yards
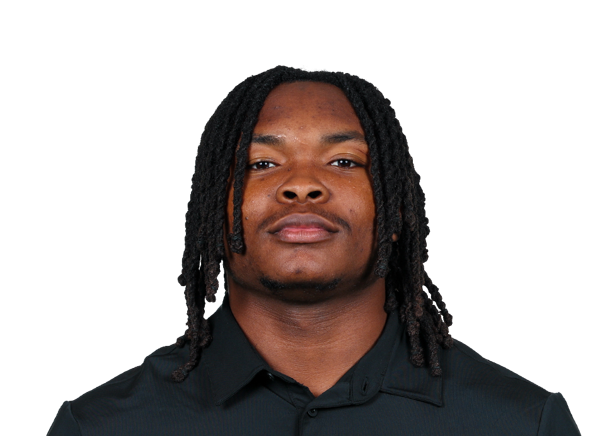 T. Bussey WR
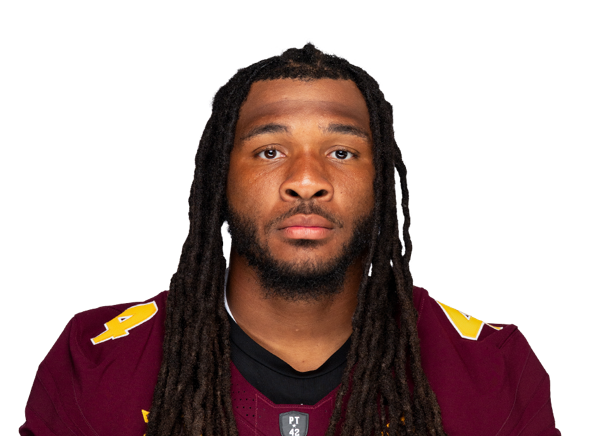 E. Winston DL
Sacks
 M. Jones DE
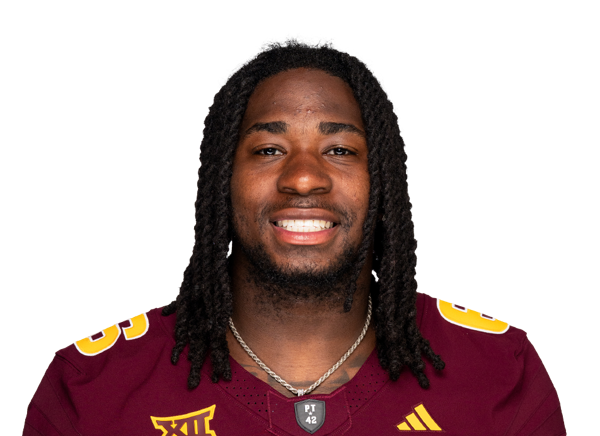 A. Wilson S
Tackles
 M. Ratcliffe S
Player Box Score
Arizona State| Player | C/ATT | YDS | AVG | TD | INT | QBR |
|---|---|---|---|---|---|---|
| Cutter Boley#8 | 21/34 | 254 | 7.5 | 2 | 2 | 62.4 |
Texas A&M| Player | C/ATT | YDS | AVG | TD | INT | QBR |
|---|---|---|---|---|---|---|
| Marcel Reed#10 | 15/25 | 163 | 6.5 | 3 | 1 | 43.9 |
Arizona State| Player | CAR | YDS | AVG | TD | LONG |
|---|---|---|---|---|---|
| Kyson Brown#1 | 13 | 66 | 5.1 | 0 | 19 |
| Cutter Boley#8 | 6 | 31 | 5.2 | 0 | 13 |
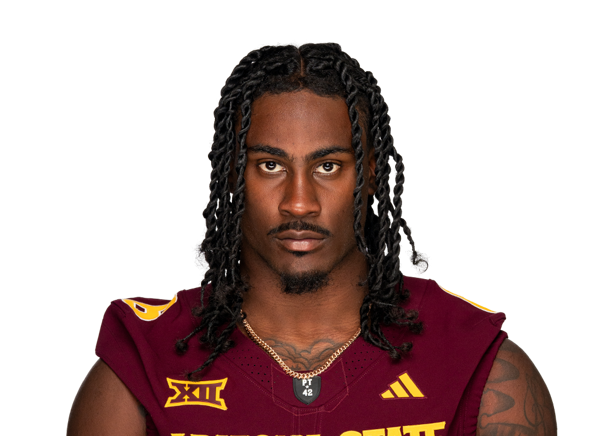 Marquis Gillis#6 | 4 | 14 | 3.5 | 0 | 8 |
 Grayson Rigdon#21 | 3 | 4 | 1.3 | 0 | 4 |
 Cardae Mack#25 | 1 | 2 | 2.0 | 0 | 2 |
 James Giggey#87 | 1 | 0 | 0.0 | 0 | 0 |
 Team | 1 | -2 | -2.0 | 0 | 0 |
Texas A&M| Player | CAR | YDS | AVG | TD | LONG |
|---|---|---|---|---|---|
| Rueben Owens II#4 | 10 | 35 | 3.5 | 1 | 7 |
 Jamarion Morrow#2 | 8 | 27 | 3.4 | 0 | 8 |
 KJ Edwards | 3 | 22 | 7.3 | 0 | 13 |
| Marcel Reed#10 | 7 | 17 | 2.4 | 0 | 19 |
 Carsyn Baker#5 | 2 | 6 | 3.0 | 0 | 3 |
| Terry Bussey#6 | 2 | 0 | 0.0 | 0 | 4 |
| Team | 2 | -5 | -2.5 | 0 | 0 |
 Tyler White#37 | 1 | -10 | -10.0 | 0 | 0 |
Arizona State| Player | REC | YDS | AVG | TD | LONG |
|---|---|---|---|---|---|
| Reed Harris#3 | 9 | 189 | 21.0 | 2 | 58 |
 Omarion Miller#4 | 9 | 29 | 3.2 | 0 | 7 |
 Khamari Anderson#15 | 1 | 21 | 21.0 | 0 | 21 |
 Raiden Vines-Bright#7 | 1 | 13 | 13.0 | 0 | 13 |
| Kyson Brown#1 | 1 | 2 | 2.0 | 0 | 2 |
Texas A&M| Player | REC | YDS | AVG | TD | LONG |
|---|---|---|---|---|---|
| Terry Bussey#6 | 4 | 58 | 14.5 | 0 | 21 |
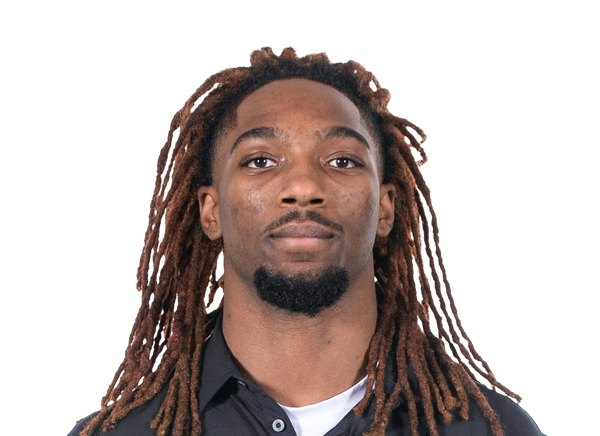 Mario Craver#1 | 3 | 34 | 11.3 | 1 | 33 |
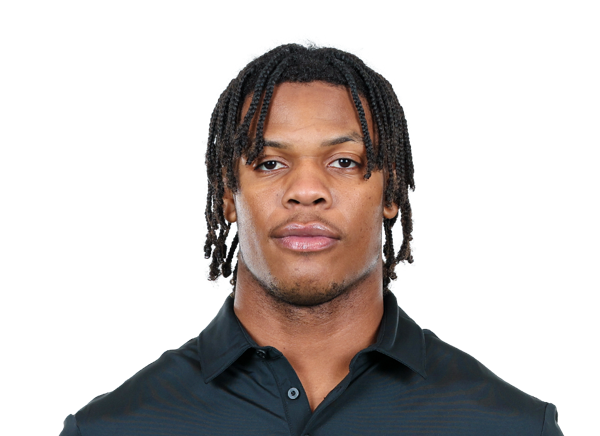 Isaiah Horton#7 | 3 | 33 | 11.0 | 2 | 16 |
| Jamarion Morrow#2 | 2 | 18 | 9.0 | 0 | 13 |
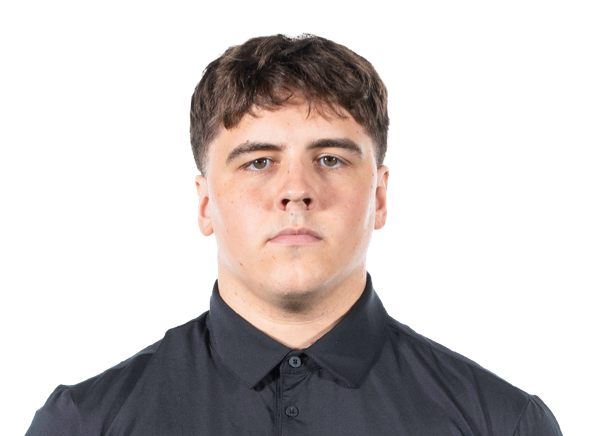 Richie Anderson III#84 | 1 | 13 | 13.0 | 0 | 13 |
| Rueben Owens II#4 | 1 | 7 | 7.0 | 0 | 7 |
 Ashton Bethel-Roman#8 | 1 | 0 | 0.0 | 0 | 0 |
Arizona State| Player | TOT | SOLO | SACKS | TFL | PD | QB HUR | TD |
|---|---|---|---|---|---|---|---|
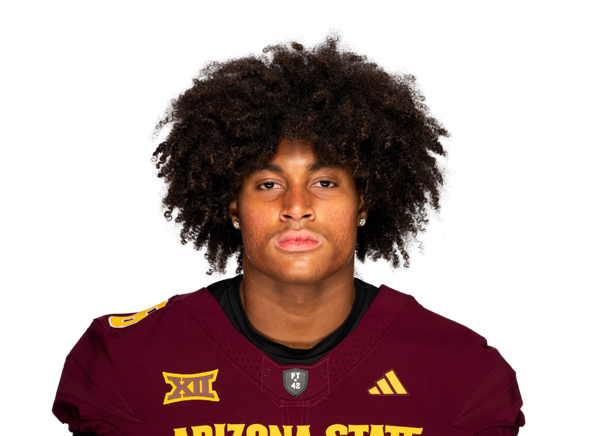 Martell Hughes#8 | 8 | 5 | 0 | 0 | 1 | 0 | 0 |
| Adrian Wilson#6 | 8 | 3 | 0 | 0 | 0 | 0 | 0 |
 Montana Warren#7 | 7 | 3 | 1 | 1 | 0 | 0 | 0 |
 Owen Long#22 | 7 | 1 | 0 | 0 | 0 | 0 | 0 |
 Jessiah McGrew#23 | 4 | 3 | 0 | 0 | 0 | 0 | 0 |
 Roman Pitre#5 | 4 | 0 | 0 | 0 | 0 | 0 | 0 |
 Lyrik Rawls#2 | 3 | 1 | 0 | 0.5 | 1 | 0 | 0 |
| Emar'rion Winston#4 | 2 | 2 | 1 | 1 | 0 | 0 | 0 |
 Blazen Lono-Wong#97 | 2 | 2 | 0 | 1 | 0 | 0 | 0 |
 Zac Swanson#92 | 2 | 1 | 0 | 0.5 | 0 | 0 | 0 |
 Jalen Thompson#9 | 2 | 1 | 0 | 0 | 0 | 1 | 0 |
 Ashton Stamps#1 | 1 | 1 | 0 | 1 | 0 | 0 | 0 |
 Kyan McDonald#21 | 1 | 1 | 0 | 0 | 0 | 0 | 0 |
| Julian Hugo#98 | 1 | 1 | 0 | 0 | 0 | 0 | 0 |
 Prayer Young-Blackgoat#13 | 1 | 1 | 0 | 0 | 0 | 0 | 0 |
| Grayson Rigdon#21 | 1 | 1 | 0 | 0 | 0 | 0 | 0 |
 Clayton Smith#10 | 1 | 0 | 0 | 0 | 0 | 0 | 0 |
 C.J. Fite#99 | 1 | 0 | 0 | 0 | 0 | 0 | 0 |
 Rodney Bimage Jr. | 1 | 0 | 0 | 0 | 1 | 0 | 0 |
Texas A&M| Player | TOT | SOLO | SACKS | TFL | PD | QB HUR | TD |
|---|---|---|---|---|---|---|---|
| Marcus Ratcliffe#3 | 7 | 3 | 0 | 0 | 0 | 0 | 0 |
 Ray Coney#21 | 6 | 4 | 0 | 1 | 0 | 0 | 0 |
 T.J. Searcy#18 | 6 | 3 | 0 | 1 | 0 | 2 | 0 |
 Noah Mikhail | 6 | 3 | 0 | 0 | 0 | 1 | 0 |
| Marco Jones#10 | 4 | 3 | 1 | 1 | 0 | 1 | 1 |
 Dalton Brooks#7 | 4 | 3 | 0 | 0 | 0 | 0 | 0 |
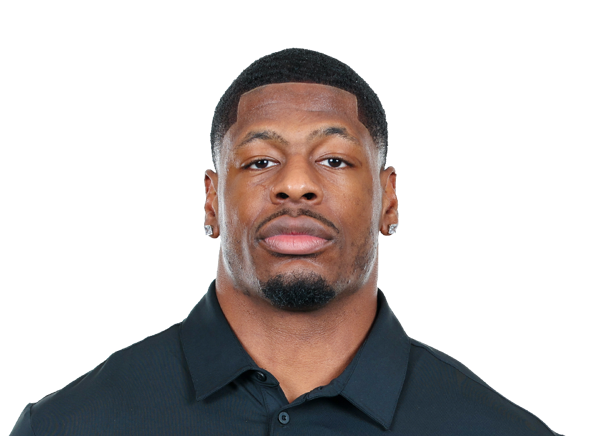 Anto Saka#14 | 4 | 2 | 0 | 1 | 0 | 1 | 0 |
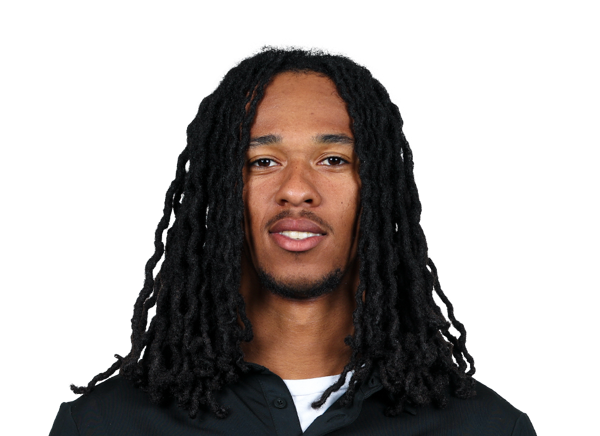 Jordan Shaw#8 | 4 | 2 | 0 | 0 | 1 | 0 | 0 |
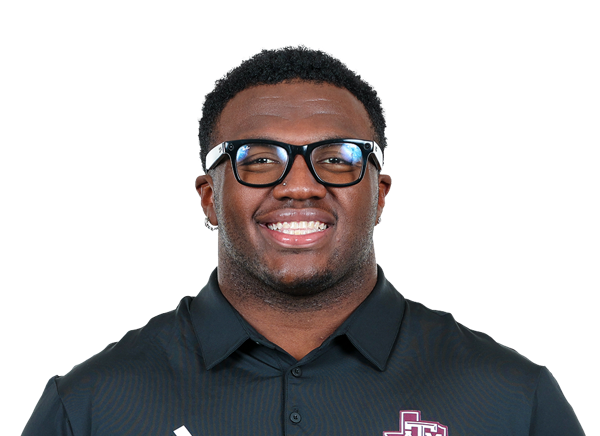 CJ Mims#92 | 3 | 1 | 0 | 0.5 | 0 | 0 | 0 |
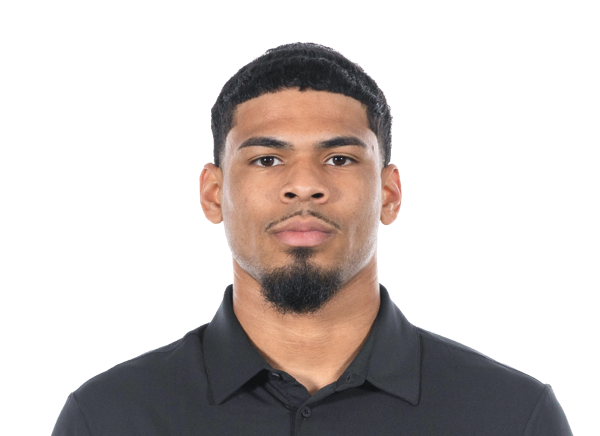 Bravion Rogers#19 | 3 | 1 | 0 | 0 | 2 | 0 | 0 |
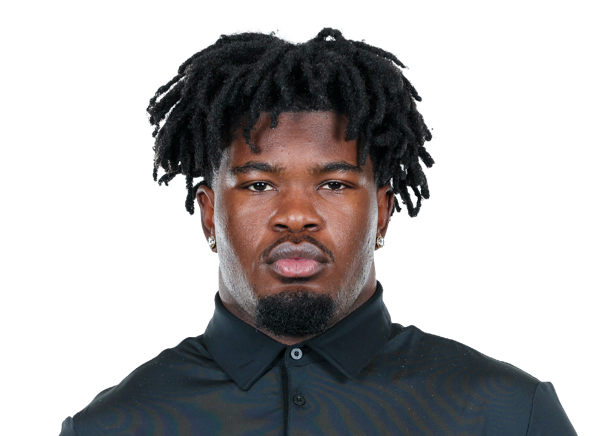 Ryan Henderson#17 | 2 | 1 | 0 | 0 | 0 | 0 | 0 |
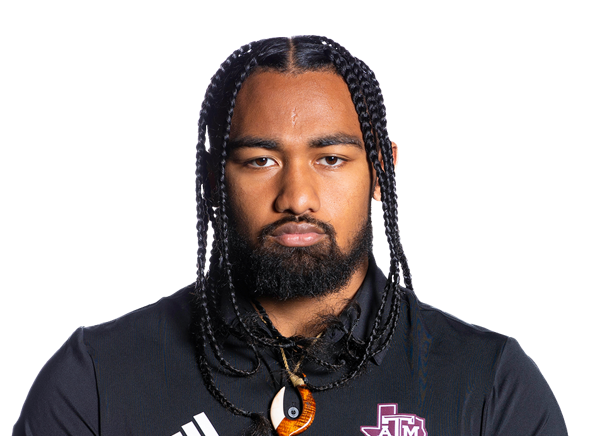 Jordan Lockhart#54 | 2 | 1 | 0 | 0 | 0 | 0 | 0 |
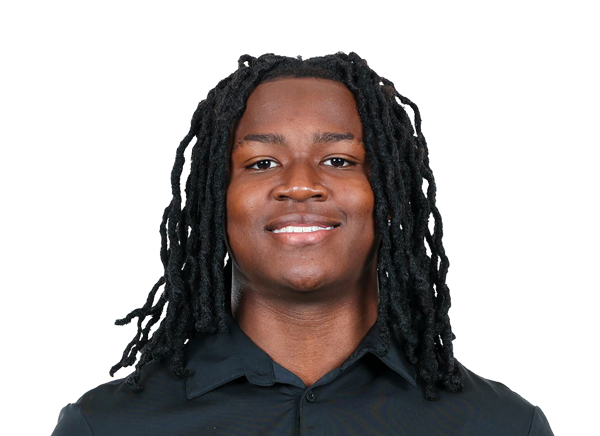 Chance Collins#28 | 2 | 0 | 0 | 0 | 0 | 0 | 0 |
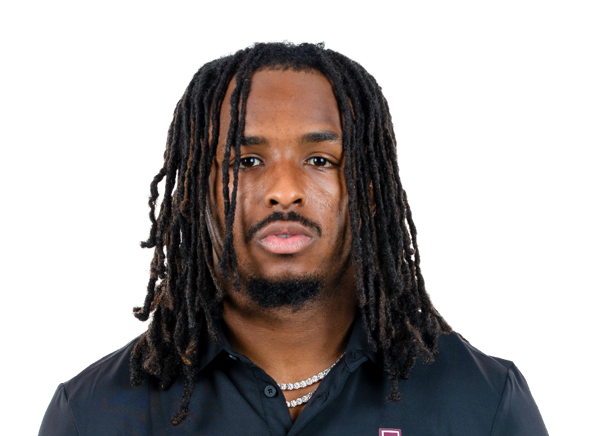 Julio Humphrey#6 | 1 | 1 | 0 | 0 | 0 | 0 | 1 |
 Sam M'Pemba#15 | 1 | 1 | 0 | 0 | 0 | 0 | 0 |
 Rickey Gibson III#9 | 1 | 1 | 0 | 0 | 0 | 0 | 0 |
 Tamarion Watkins#25 | 1 | 1 | 0 | 0 | 0 | 0 | 0 |
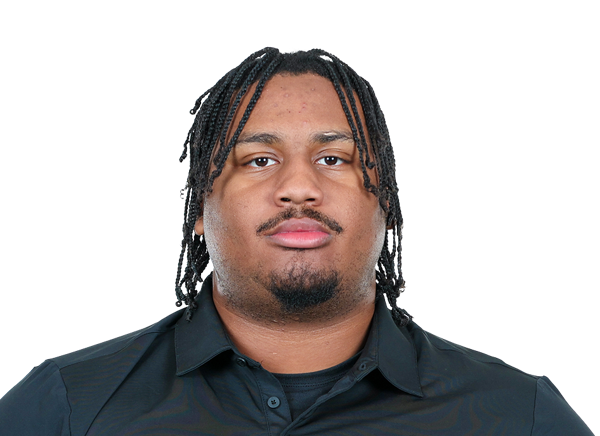 Brandon Davis-Swain#11 | 1 | 0 | 0 | 0 | 0 | 0 | 0 |
 Dezz Ricks#2 | 1 | 0 | 0 | 0 | 0 | 0 | 0 |
 DJ Sanders#88 | 1 | 0 | 0 | 0 | 0 | 1 | 0 |
 DJ Hicks#5 | 1 | 0 | 0 | 0.5 | 0 | 1 | 0 |
 TK Norman#18 | 1 | 0 | 0 | 0 | 0 | 0 | 0 |
 Tristian Givens#22 | 1 | 0 | 0 | 0 | 0 | 0 | 0 |
Arizona State| Player | FUM | LOST | REC |
|---|---|---|---|
| Kyson Brown#1 | 1 | 1 | 0 |
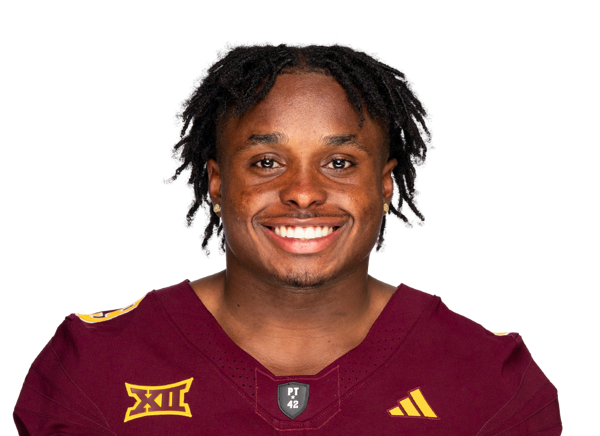 Cory Butler Jr.#9 | 1 | 1 | 0 |
| Omarion Miller#4 | 1 | 0 | 0 |
| James Giggey#87 | 1 | 0 | 0 |
Texas A&M| Player | FUM | LOST | REC |
|---|---|---|---|
| Tyler White#37 | 1 | 0 | 0 |
| Dalton Brooks#7 | 0 | 0 | 1 |
| TK Norman#18 | 0 | 0 | 1 |
Arizona State| Player | FG | PCT | LONG | XP | PTS |
|---|---|---|---|---|---|
 Carson Smith#32 | 2/2 | 100.0 | 35 | 2/2 | 8 |
Texas A&M| Player | FG | PCT | LONG | XP | PTS |
|---|---|---|---|---|---|
 David Olano#24 | 2/2 | 100.0 | 39 | 6/6 | 12 |
Arizona State| Player | NO | YDS | AVG | TB | In 20 | LONG |
|---|---|---|---|---|---|---|
 Nick McLarty#35 | 4 | 166 | 41.5 | 1 | 0 | 52 |
Texas A&M| Player | NO | YDS | AVG | TB | In 20 | LONG |
|---|---|---|---|---|---|---|
| Tyler White#37 | 4 | 212 | 53.0 | 0 | 2 | 56 |
Arizona State| Player | NO | YDS | AVG | LONG | TD |
|---|---|---|---|---|---|
 Jaren Hamilton#16 | 1 | 20 | 20.0 | 20 | 0 |
Texas A&M| Player | NO | YDS | AVG | LONG | TD |
|---|---|---|---|---|---|
| Terry Bussey#6 | 1 | 16 | 16.0 | 16 | 0 |
Arizona State| Player | NO | YDS | AVG | LONG | TD |
|---|---|---|---|---|---|
 Jalen Moss#18 | 1 | 15 | 15.0 | 15 | 0 |
| Cory Butler Jr.#9 | 2 | -9 | -4.5 | 0 | 0 |
Texas A&M| Player | NO | YDS | AVG | LONG | TD |
|---|---|---|---|---|---|
| Terry Bussey#6 | 1 | 21 | 21.0 | 21 | 0 |
Arizona State| Player | INT | YDS | TD |
|---|---|---|---|
| Lyrik Rawls#2 | 1 | 0 | 0 |
Texas A&M| Player | INT | YDS | TD |
|---|---|---|---|
| Marco Jones#10 | 1 | 55 | 1 |
| Julio Humphrey#6 | 1 | 45 | 1 |
Drive Summary
ASU
Punt
23
TA&M
Punt
7
ASU
Punt
18
TA&M
Punt
1
TA&M
Touchdown
8
ASU
Touchdown
75
TA&M
Touchdown
75
ASU
Field Goal
62
TA&M
Punt
1
ASU
Downs
9
TA&M
Field Goal
38
ASU
End Of Half
-2
TA&M
Interception
0
ASU
Field Goal
38
TA&M
Touchdown
75
ASU
Touchdown
75
TA&M
Punt
1
ASU
Punt
-3
TA&M
Touchdown
44
ASU
Punt
20
TA&M
Downs
14
ASU
Interception Touchdown
0
ASU
Fumble
6
TA&M
Field Goal
4
ASU
Interception Touchdown
23
ASU
Downs
5
TA&M
End of Game
14
Injury Report
No current injury report is available for this matchup.
Head-to-Head
Historical meetings are not available for this matchup.
Game Information
StageWeek 2
Season2026
KickoffSat, Sep 12, 12:00 pm
VenueKyle Field
LocationCollege Station, TX
SurfaceGrass
BroadcastABC, ERADM
Attendance107,523
Division Standings
FBS — Big 12 Conference
| Team | W | L | T | Pct | PF | PA | Home | Away | Strk |
|---|---|---|---|---|---|---|---|---|---|
 BYU | 8 | 2 | 0 | 0.800 | 307 | 185 | 6-0 | 2-2 | W1 |
 Cincinnati | 5 | 5 | 0 | 0.500 | 310 | 306 | 5-1 | 0-4 | L3 |
 Colorado | 4 | 6 | 0 | 0.400 | 220 | 287 | 3-2 | 1-4 | W1 |
 Houston | 7 | 3 | 0 | 0.700 | 351 | 234 | 5-0 | 2-3 | L1 |
 Kansas State | 4 | 6 | 0 | 0.400 | 292 | 261 | 4-2 | 0-4 | L4 |
 Texas Tech | 8 | 1 | 0 | 0.889 | 338 | 217 | 6-0 | 2-1 | W2 |
 Utah | 9 | 0 | 0 | 1.000 | 339 | 147 | 6-0 | 3-0 | W9 |
 West Virginia | 5 | 5 | 0 | 0.500 | 349 | 348 | 3-3 | 2-2 | L2 |
| Arizona State | 6 | 4 | 0 | 0.600 | 282 | 259 | 4-1 | 2-3 | W2 |
 Baylor | 6 | 4 | 0 | 0.600 | 294 | 181 | 4-1 | 2-3 | L1 |
 Iowa State | 5 | 6 | 0 | 0.455 | 321 | 321 | 5-1 | 0-5 | L1 |
 Kansas | 4 | 6 | 0 | 0.400 | 302 | 237 | 3-3 | 1-3 | W1 |
 Oklahoma State | 6 | 3 | 0 | 0.667 | 395 | 245 | 4-0 | 2-3 | W1 |
 TCU | 5 | 5 | 0 | 0.500 | 234 | 152 | 4-3 | 1-2 | W1 |
 UCF | 6 | 5 | 0 | 0.545 | 332 | 277 | 5-2 | 1-3 | W1 |
 Arizona | 7 | 2 | 0 | 0.778 | 308 | 179 | 5-0 | 2-2 | W1 |
FBS — Southeastern Conference
| Team | W | L | T | Pct | PF | PA | Home | Away | Strk |
|---|---|---|---|---|---|---|---|---|---|
 Alabama | 8 | 2 | 0 | 0.800 | 358 | 189 | 4-1 | 4-1 | W3 |
 Auburn | 6 | 4 | 0 | 0.600 | 260 | 246 | 4-2 | 2-2 | W2 |
 Florida | 6 | 4 | 0 | 0.600 | 313 | 262 | 3-2 | 3-2 | W1 |
 Georgia | 9 | 1 | 0 | 0.900 | 418 | 147 | 6-1 | 3-0 | W3 |
 LSU | 6 | 4 | 0 | 0.600 | 355 | 181 | 5-2 | 1-2 | L2 |
 Mississippi State | 4 | 6 | 0 | 0.400 | 245 | 291 | 2-4 | 2-2 | L6 |
 Missouri | 6 | 4 | 0 | 0.600 | 293 | 229 | 4-1 | 2-3 | L2 |
 Ole Miss | 6 | 3 | 0 | 0.667 | 304 | 234 | 5-1 | 1-2 | L1 |
 South Carolina | 6 | 4 | 0 | 0.600 | 318 | 245 | 4-2 | 2-2 | L1 |
 Tennessee | 8 | 2 | 0 | 0.800 | 314 | 143 | 5-1 | 3-1 | W2 |
 Texas | 8 | 2 | 0 | 0.800 | 302 | 178 | 5-1 | 3-1 | W4 |
| Texas A&M | 4 | 6 | 0 | 0.400 | 242 | 190 | 4-2 | 0-4 | L3 |
 Vanderbilt | 4 | 6 | 0 | 0.400 | 213 | 286 | 3-3 | 1-3 | L1 |
 Arkansas | 4 | 6 | 0 | 0.400 | 214 | 253 | 3-3 | 1-3 | W1 |
 Oklahoma | 5 | 4 | 0 | 0.556 | 199 | 173 | 3-2 | 2-2 | W1 |
 Kentucky | 7 | 3 | 0 | 0.700 | 283 | 253 | 4-2 | 3-1 | L2 |
Arizona State
7th in Big 12
VS
Texas A&M
13th in SEC
Quarterbacks & Specialists
#8
Cutter Boley
#35
Nick McLarty
Receivers & Backs
#15
Khamari Anderson
#1
Kyson Brown
#9
Cory Butler Jr.
#87
James Giggey
#6
Marquis Gillis
#16
Jaren Hamilton
#3
Reed Harris
#25
Cardae Mack
#4
Omarion Miller
#18
Jalen Moss
#21
Grayson Rigdon
#7
Raiden Vines-Bright
Defensive Line & Linebackers
#99
C.J. Fite
#8
Martell Hughes
#98
Julian Hugo
#22
Owen Long
#97
Blazen Lono-Wong
#5
Roman Pitre
#10
Clayton Smith
#92
Zac Swanson
#9
Jalen Thompson
#4
Emar'rion Winston
#13
Prayer Young-Blackgoat
Defensive Backs
Rodney Bimage Jr.
#21
Kyan McDonald
#23
Jessiah McGrew
#2
Lyrik Rawls
#1
Ashton Stamps
#7
Montana Warren
#6
Adrian Wilson
Other
#32
Carson Smith
Quarterbacks & Specialists
#10
Marcel Reed
#37
Tyler White
Receivers & Backs
#84
Richie Anderson III
#5
Carsyn Baker
#8
Ashton Bethel-Roman
#6
Terry Bussey
#1
Mario Craver
KJ Edwards
#7
Isaiah Horton
#2
Jamarion Morrow
#18
TK Norman
#4
Rueben Owens II
Defensive Line & Linebackers
#21
Ray Coney
#11
Brandon Davis-Swain
#22
Tristian Givens
#17
Ryan Henderson
#5
DJ Hicks
#10
Marco Jones
#54
Jordan Lockhart
#15
Sam M'Pemba
Noah Mikhail
#92
CJ Mims
#14
Anto Saka
#88
DJ Sanders
#18
T.J. Searcy
#25
Tamarion Watkins
Defensive Backs
#7
Dalton Brooks
#28
Chance Collins
#9
Rickey Gibson III
#6
Julio Humphrey
#3
Marcus Ratcliffe
#2
Dezz Ricks
#19
Bravion Rogers
#8
Jordan Shaw
Other
#24
David Olano
Arizona State
4th in Big 12
VS
Texas A&M
15th in SEC
Passing
60.6
Completion Percentage
55.9
209
Completions
174
1.40
Interception Percentage
3.50
5
Interceptions
11
74
Longest Pass
54
2,474
Net Passing Yards
1,877
247.4
Net Passing Yards Per Game
187.7
345
Passing Attempts
311
5.50
Passing Touchdown %
3.20
19
Passing Touchdowns
10
136.5
Passer Rating
109.9
27
Total Sacks
18
201
Sack Yards Lost
139
7.2
Yards Per Pass Attempt
6.0
2,474
Passing Yards
1,877
0
Passing Fumbles Lost
0
10
Team Games Played
10
385.3
Yards Per Game
341.2
28.2
Total Points Per Game
24.2
282
Total Points
242
33
Total Touchdowns
27
247.4
Passing Yards Per Game
187.7
209-345
Comp-Att
174-311
27-201
Sacks-Yards Lost
18-139
Rushing
352
Rushing Attempts
364
1,379
Rushing Yards
1,535
3.9
Yards Per Rush Attempt
4.2
67
Long Rushing
44
0
20+ Yard Rushing Plays
0
13
Rushing Touchdowns
15
137.9
Rushing Yards Per Game
153.5
0
Rushing Fumbles
0
0
Rushing Fumbles Lost
0
82
Rushing 1st downs
86
10
Team Games Played
10
3,853
Total Yards
3,412
724
Total Offensive Plays
693
28.2
Total Points Per Game
24.2
282
Total Points
242
33
Total Touchdowns
27
Receiving
209
Receptions
174
0
Receiving Targets
0
2,474
Receiving Yards
1,877
2,474
Receiving Yards
1,877
19
Receiving Touchdowns
10
74
Long Reception
54
0
20+ Yard Receiving Plays
0
247.4
Receiving Yards Per Game
187.7
0
Receiving Fumbles
0
0
Receiving Fumbles Lost
0
1342
Receiving Yards After Catch
900
109
Receiving First Downs
91
10
Team Games Played
10
11.8
Yards Per Reception
10.8
28.2
Total Points Per Game
24.2
282
Total Points
242
33
Total Touchdowns
27
Miscellaneous
203
Total 1st downs
194
82
Rushing 1st downs
86
109
Passing 1st downs
91
12
1st downs by penalty
17
48
Third Down Conversions
58
144
Third Down Attempts
143
33.33
3rd down %
40.56
14
Fourth Down Conversions
9
24
First Downs Attempts
21
58.33
4th down %
42.86
47
Total Penalties
57
419
Total Penalty Yards
480
18544
Possession Time Seconds
18568
0.00
Red Zone Field Goal Percentage
0.00
0.00
Red Zone Scoring Percentage
0.00
0.00
Red Zone Efficiency Percentage
0.00
0.00
Red Zone Touchdown Percentage
0.00
12
Total Takeaways
18
11
Total Giveaways
13
1
Turnover Ratio
5
0
Fumbles Lost
0
48-144
3rd down efficiency
58-143
14-24
4th down efficiency
9-21
47-419
Total-Yards
57-480
Defense
351
Solo Tackles
265
278
Assist Tackles
386
629
Total Tackles
651
24
Sacks
11
163
Sack Yards
68
71
Stuffs
66
43
Passes Defended
20
9.6
Average Interception Yards
25.3
23
Long Interception
55
0
Miscellaneous Touchdowns
0
1
Kicks Blocked
1
42
Tackles For Loss
32
10
Team Games Played
10
Defensive Interceptions
5
Interceptions
6
48
Interception Yards
152
0
Interception Touchdowns
2
5-48
INT: Total
6-152
General
12
Fumbles
12
7
Forced Fumbles
6
7
Fumbles Recovered
7
0
Fumbles Touchdowns
0
10
Games Played
10
12-0
Fumbles-Lost
12-0
Returning
13
Kick Returns
11
324
Kick Return Yards
157
24.9
Yards Per Kick Return
14.3
100
Long Kick Return
22
1
Kick Return Touchdowns
0
13
Punt Returns
15
81
Punt Return Yards
143
6.2
Yards Per Punt Return
9.5
21
Long Punt Return
42
0
Punt Return Touchdowns
0
0
Punt Return Fair Catches
0
0
Kick Return Fumbles Lost
0
0
Punt Return Fumbles Lost
0
10
Team Games Played
10
13-81
Punt: Total
15-143
Kicking
17
Field Goal Made
17
18
Field Goal Attempts
19
94.4
Field Goal Percentage
89.5
51
Long Field Goal Made
57
0
Field Goal Attempts 1-19
0
3
Field Goal Attempts 20-29
7
9
Field Goal Attempts 30-39
3
5
Field Goal Attempts 40-49
4
1
Field Goal Attempts 50+
5
31
Extra Points Made
27
31
Extra Point Attempts
27
100.0
Extra Point Percentage
100.0
0
Field Goals Made 1-19
0
3
Field Goals Made 20-29
7
8
Field Goals Made 30-39
2
5
Field Goals Made 40-49
4
1
Field Goals Made 50+
4
82
Total Kicking Points
78
10
Team Games Played
10
54
Touchback Percentage
82
0.0
Average Kickoff Return Yards
0.0
0
Kickoff Return Yards
0
0
Kickoff Returns
0
0-0
Kickoffs: Total
0-0
17-18
FG: Good-Attempts
17-19
Punting
47
Punts
40
1,930
Punt Yards
1,993
53
Long Punt
72
41.1
Gross Average Punt Yards
49.8
41.1
Net Average Punt Yards
49.8
0
Punts Blocked
0
14
Punts Inside 20
18
3
Touchbacks
3
22
Fair Catches
13
11
Punt Returns
12
0
Punt Return Yards
0
0.0
Average Punt Return Yards
0.0
10
Team Games Played
10
47-1,930
Punt: Total Yards
40-1,993
Scoring
13
Rushing Touchdowns
15
19
Receiving Touchdowns
10
1
Return Touchdowns
0
33
Total Touchdowns
25
17
Field Goals
17
31
Kick Extra Points
27
1
Total Two Point Conversions
0
282
Total Points
242
28.2
Total Points Per Game
24.2