

Arizona vs BYU Live Score (12 Sep, 2026)
Score by Quarter
| Team | Q1 | Q2 | Q3 | Q4 | Final |
|---|---|---|---|---|---|
 Arizona | 10 | 7 | 0 | 0 | 17 |
 BYU | 7 | 7 | 7 | 7 | 28 |
Scoring Plays
Q1
9:10
9:10
Noah Fifita 11 Yd Run (Michael Salgado-Medina Kick)
Rushing Touchdown
7 – 0
Q1
5:16
5:16
Bear Bachmeier 6 Yd Run (Matthias Dunn Kick)
Rushing Touchdown
7 – 7
Q1
0:24
0:24
Michael Salgado-Medina 37 Yd Field Goal
Field Goal Good
10 – 7
Q2
12:46
12:46
Reggie Frischknecht 25 Yd pass from Bear Bachmeier (Matthias Dunn Kick)
Passing Touchdown
10 – 14
Q2
2:03
2:03
Shane King 16 Yd pass from Noah Fifita (Michael Salgado-Medina Kick)
Passing Touchdown
17 – 14
Q3
9:37
9:37
Kyler Kasper 6 Yd pass from Bear Bachmeier (Matthias Dunn Kick)
Passing Touchdown
17 – 21
Q4
6:10
6:10
Kyler Kasper 12 Yd pass from Bear Bachmeier (Matthias Dunn Kick)
Passing Touchdown
17 – 28
Game Leaders
ArizonaBYU
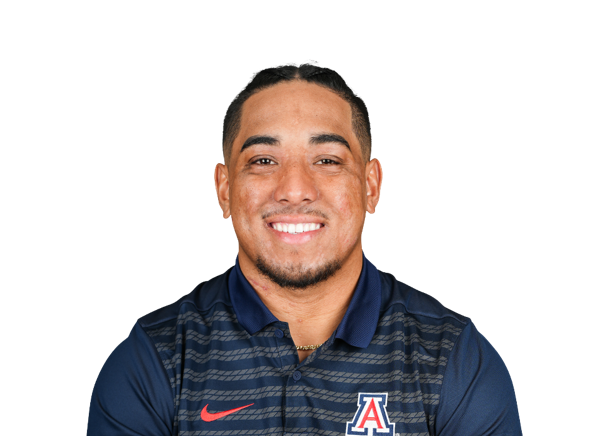 N. Fifita QB
Passing Yards
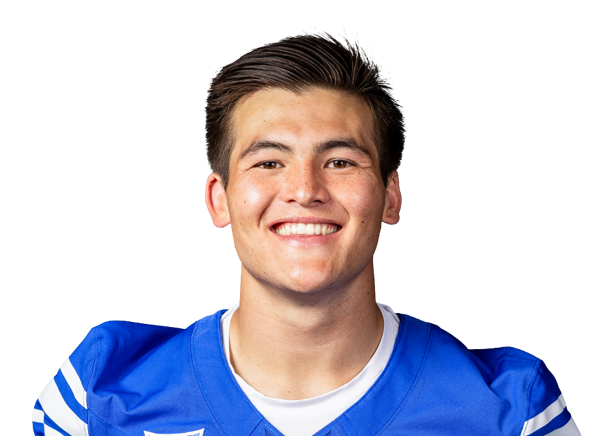 B. Bachmeier QB
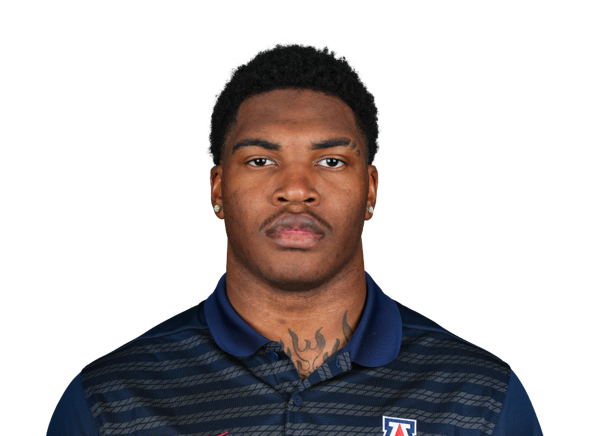 K. Reescano RB
Rushing Yards
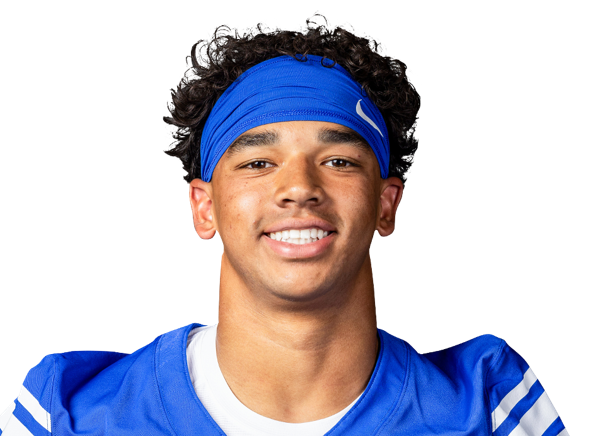 L. Martin RB
 C. Rusk TE
Receiving Yards
 L. Glasker WR
 L. Palu DL
Sacks
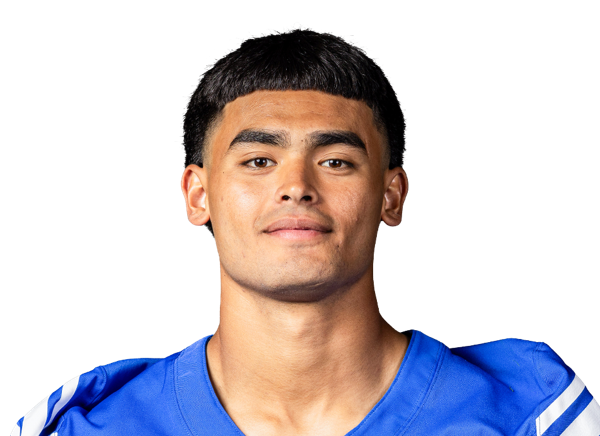 T. Akana DE
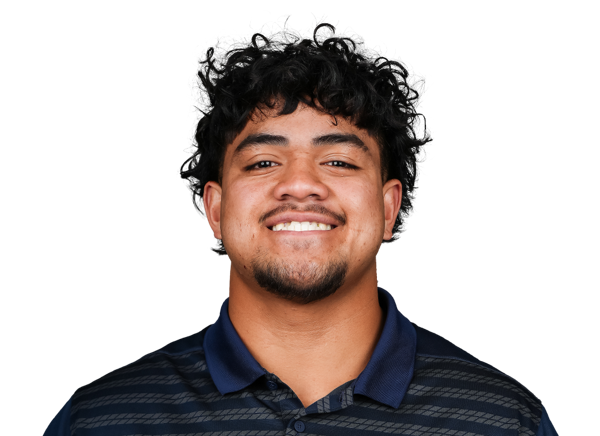 M. Pese DL
Tackles
 C. DeVries CB
Player Box Score
Arizona| Player | C/ATT | YDS | AVG | TD | INT | QBR |
|---|---|---|---|---|---|---|
| Noah Fifita#1 | 23/31 | 230 | 7.4 | 1 | 1 | 84.9 |
BYU| Player | C/ATT | YDS | AVG | TD | INT | QBR |
|---|---|---|---|---|---|---|
| Bear Bachmeier#47 | 16/26 | 217 | 8.3 | 3 | 0 | 90.7 |
Arizona| Player | CAR | YDS | AVG | TD | LONG |
|---|---|---|---|---|---|
| Kedrick Reescano#3 | 15 | 49 | 3.3 | 0 | 8 |
| Noah Fifita#1 | 11 | 38 | 3.5 | 1 | 20 |
 Quincy Craig#24 | 3 | 6 | 2.0 | 0 | 4 |
 Chris Hunter III#11 | 1 | 3 | 3.0 | 0 | 3 |
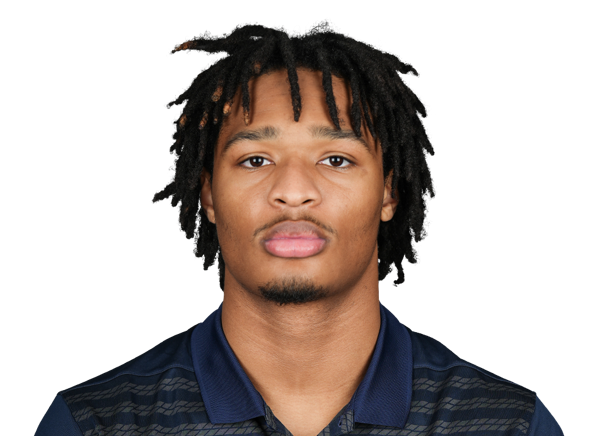 Tre Spivey#12 | 1 | 1 | 1.0 | 0 | 1 |
BYU| Player | CAR | YDS | AVG | TD | LONG |
|---|---|---|---|---|---|
| LJ Martin#4 | 20 | 98 | 4.9 | 0 | 20 |
| Bear Bachmeier#47 | 6 | 37 | 6.2 | 1 | 15 |
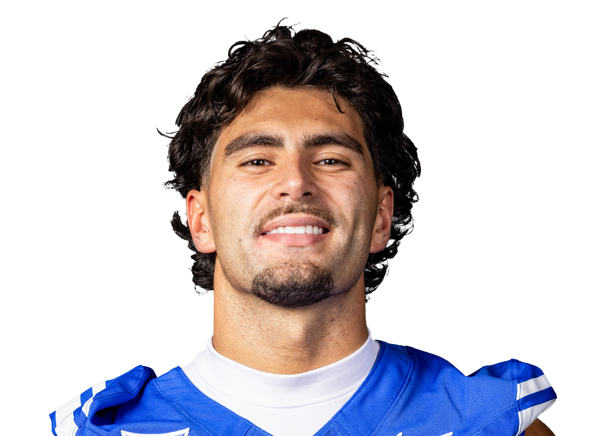 Preston Rex#12 | 1 | 11 | 11.0 | 0 | 11 |
| Legend Glasker#1 | 1 | 5 | 5.0 | 0 | 5 |
| Team | 2 | -3 | -1.5 | 0 | 0 |
Arizona| Player | REC | YDS | AVG | TD | LONG |
|---|---|---|---|---|---|
| Cole Rusk#14 | 2 | 48 | 24.0 | 0 | 34 |
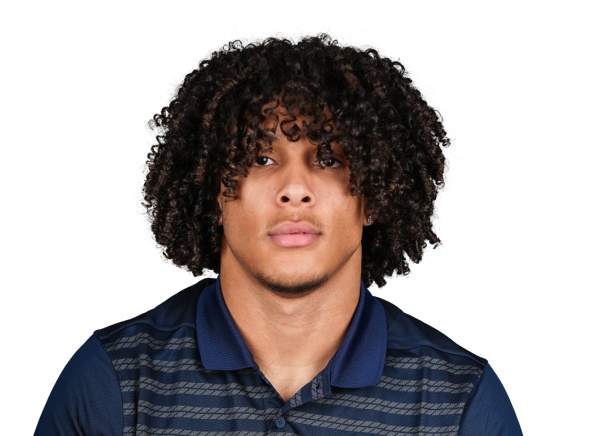 Giovanni Richardson#5 | 5 | 48 | 9.6 | 0 | 15 |
 Brandon Phelps#18 | 1 | 30 | 30.0 | 0 | 30 |
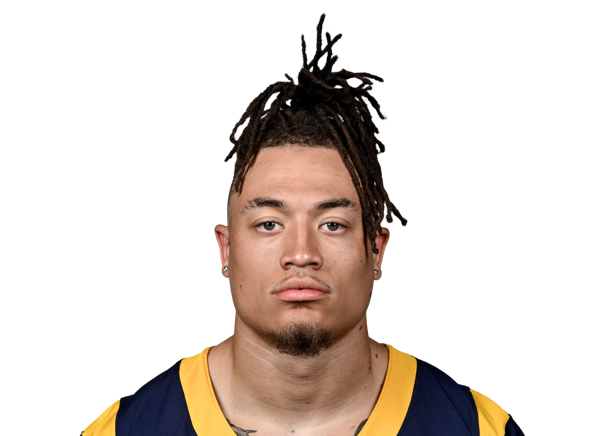 Rodney Gallagher III#84 | 5 | 26 | 5.2 | 0 | 12 |
| Quincy Craig#24 | 3 | 22 | 7.3 | 0 | 11 |
| Shane King#8 | 2 | 21 | 10.5 | 1 | 16 |
| Tre Spivey#12 | 2 | 14 | 7.0 | 0 | 7 |
| Chris Hunter III#11 | 1 | 12 | 12.0 | 0 | 12 |
| Caleb Smith#20 | 1 | 5 | 5.0 | 0 | 5 |
| Kedrick Reescano#3 | 1 | 4 | 4.0 | 0 | 4 |
BYU| Player | REC | YDS | AVG | TD | LONG |
|---|---|---|---|---|---|
| Legend Glasker#1 | 3 | 74 | 24.7 | 0 | 61 |
 Kyler Kasper#3 | 4 | 51 | 12.8 | 2 | 29 |
| LJ Martin#4 | 2 | 27 | 13.5 | 0 | 23 |
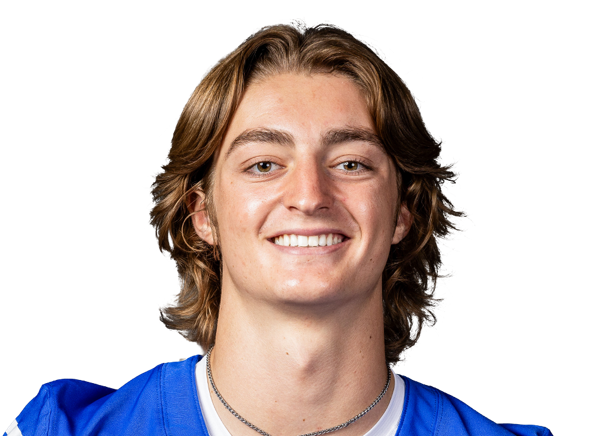 Reggie Frischknecht#18 | 1 | 25 | 25.0 | 1 | 25 |
 Walker Lyons#7 | 3 | 22 | 7.3 | 0 | 11 |
| Preston Rex#12 | 1 | 8 | 8.0 | 0 | 8 |
 Roger Saleapaga II#2 | 1 | 5 | 5.0 | 0 | 5 |
 Jojo Phillips#13 | 1 | 5 | 5.0 | 0 | 5 |
Arizona| Player | TOT | SOLO | SACKS | TFL | PD | QB HUR | TD |
|---|---|---|---|---|---|---|---|
 Quinn Olson#35 | 6 | 6 | 0 | 0 | 0 | 0 | 0 |
| Mays Pese#99 | 6 | 1 | 0 | 0 | 0 | 1 | 0 |
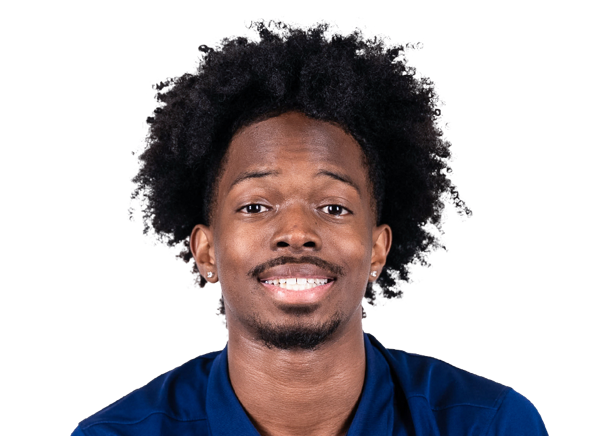 Lee Molette III#17 | 4 | 3 | 0 | 0 | 0 | 0 | 0 |
 Taye Brown#6 | 4 | 3 | 0 | 0 | 0 | 0 | 0 |
 Chase Kennedy#7 | 4 | 2 | 0 | 0 | 0 | 0 | 0 |
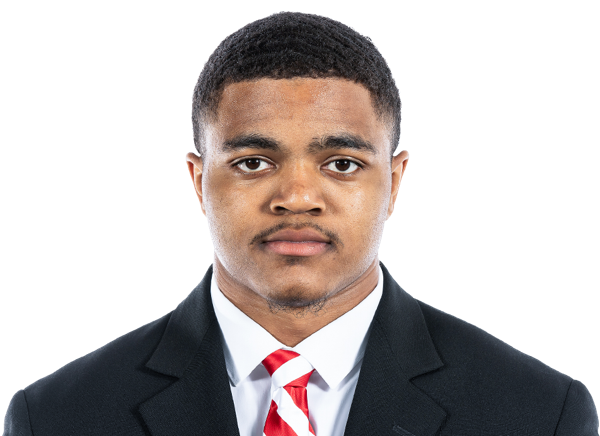 Malcolm Hartzog Jr.#15 | 4 | 2 | 0 | 0 | 0 | 0 | 0 |
 Tre Smith#3 | 4 | 1 | 0 | 0 | 0 | 0 | 0 |
| Cooper Blomstrom#48 | 4 | 1 | 0 | 0 | 0 | 0 | 0 |
 Gavin Hunter#23 | 3 | 1 | 0 | 0 | 0 | 0 | 0 |
 Jay'Vion Cole#8 | 2 | 1 | 0 | 0 | 1 | 0 | 0 |
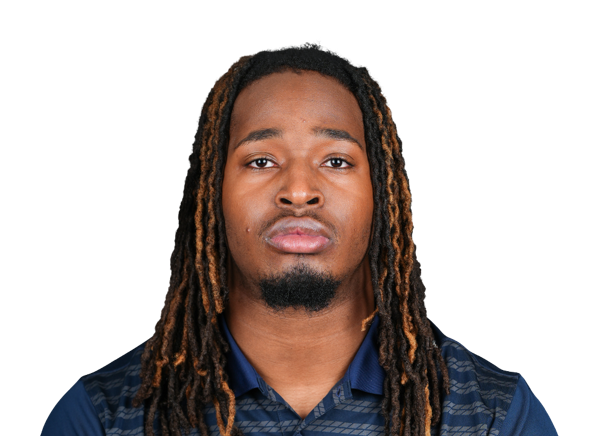 Max Harris#19 | 2 | 1 | 0 | 0 | 0 | 0 | 0 |
| Zac Siulepa#96 | 2 | 1 | 0 | 0 | 0 | 0 | 0 |
| Leroy Palu#95 | 1 | 1 | 1 | 1 | 0 | 0 | 0 |
| Quincy Craig#24 | 1 | 1 | 0 | 0 | 0 | 0 | 0 |
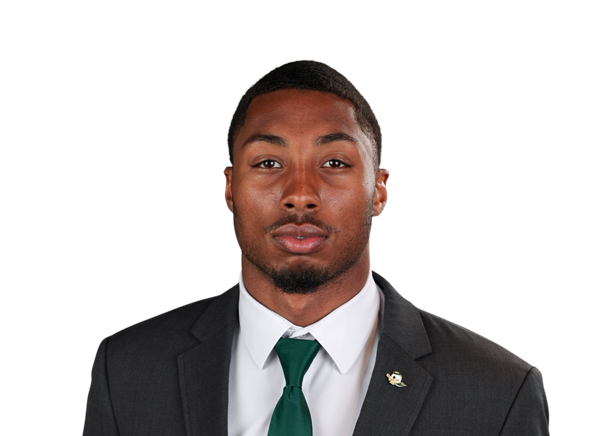 Daylen Austin#2 | 1 | 1 | 0 | 0 | 0 | 0 | 0 |
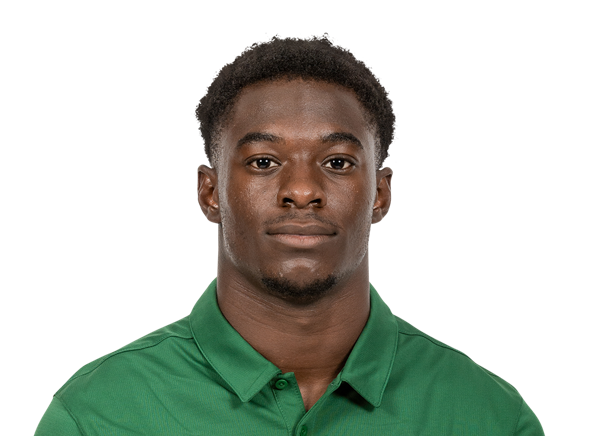 Dwight Bootle II#12 | 1 | 1 | 0 | 0 | 0 | 0 | 0 |
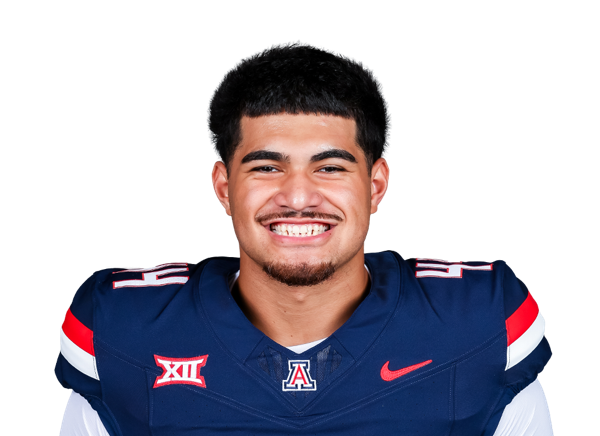 Prince Williams#44 | 1 | 0 | 0 | 0 | 0 | 0 | 0 |
 Myron Robinson#10 | 1 | 0 | 0 | 0 | 0 | 0 | 0 |
 Dominic Lolesio#42 | 0 | 0 | 0 | 0 | 0 | 1 | 0 |
BYU| Player | TOT | SOLO | SACKS | TFL | PD | QB HUR | TD |
|---|---|---|---|---|---|---|---|
| Cannon DeVries#32 | 9 | 5 | 0 | 0 | 1 | 0 | 0 |
 Isaiah Glasker#16 | 8 | 5 | 0 | 0 | 0 | 1 | 0 |
 Faletau Satuala#11 | 7 | 4 | 0 | 1 | 0 | 0 | 0 |
 Cade Uluave#4 | 6 | 4 | 0 | 0 | 0 | 0 | 0 |
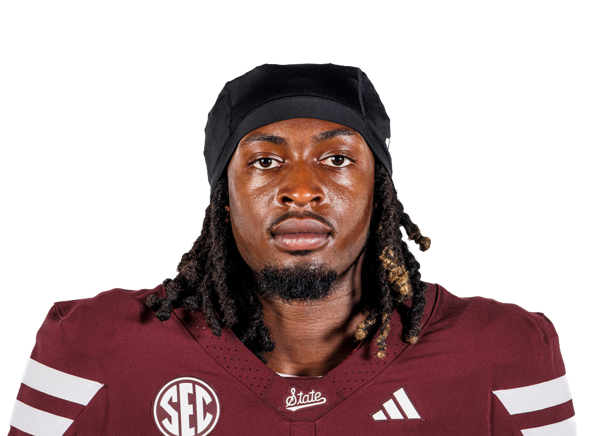 Jayven Williams#15 | 6 | 4 | 0 | 0 | 1 | 0 | 0 |
 Kendal Wall#46 | 5 | 3 | 0 | 0 | 0 | 0 | 0 |
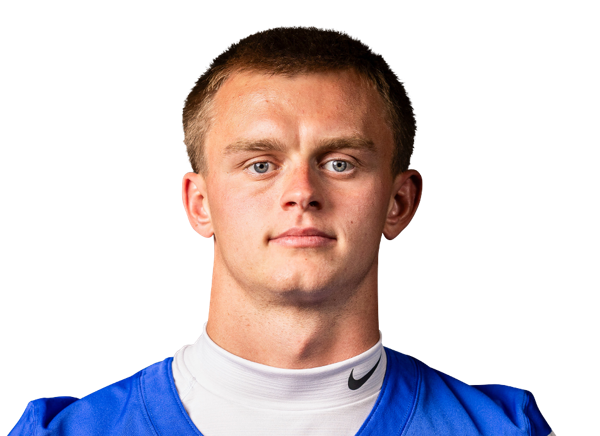 Tommy Prassas#22 | 4 | 3 | 0 | 0 | 0 | 0 | 0 |
| Tausili Akana#13 | 4 | 2 | 2.5 | 2.5 | 0 | 0 | 0 |
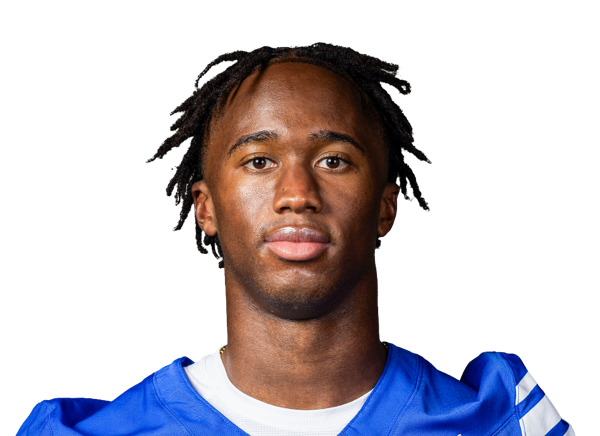 Evan Johnson | 4 | 2 | 0 | 0 | 0 | 0 | 0 |
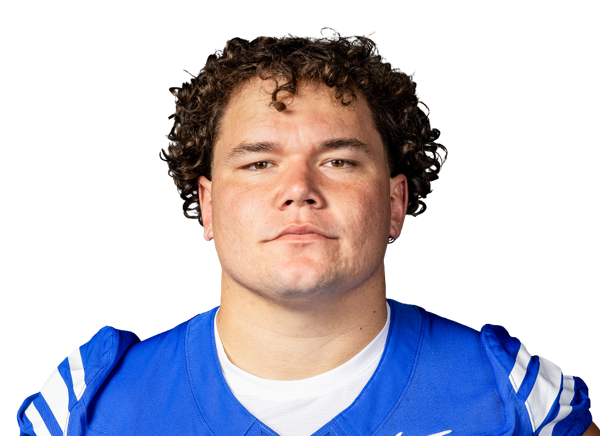 Keanu Tanuvasa#57 | 3 | 1 | 0.5 | 1.5 | 0 | 0 | 0 |
| Braxton Lindsey#30 | 2 | 1 | 0 | 0 | 0 | 0 | 0 |
 Nusi Taumoepeau#5 | 2 | 0 | 0 | 0 | 0 | 1 | 0 |
 Jake Clifton#31 | 1 | 1 | 0 | 0 | 0 | 0 | 0 |
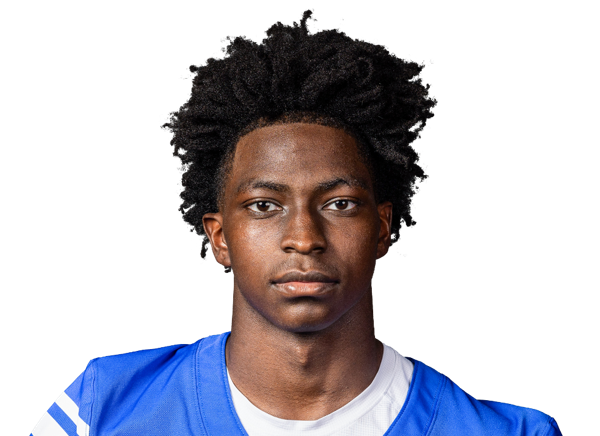 Therrian Alexander III#1 | 1 | 1 | 0 | 0 | 0 | 0 | 0 |
 Crew Clark#28 | 1 | 1 | 0 | 0 | 0 | 0 | 0 |
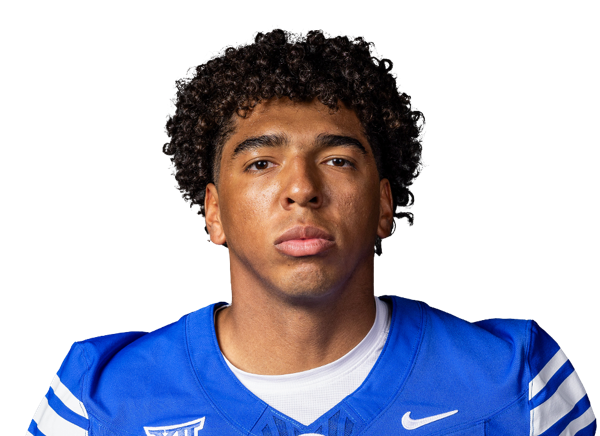 Miles Hall#21 | 1 | 0 | 0 | 0 | 0 | 0 | 0 |
 Hunter Clegg#90 | 1 | 0 | 0 | 0 | 0 | 1 | 0 |
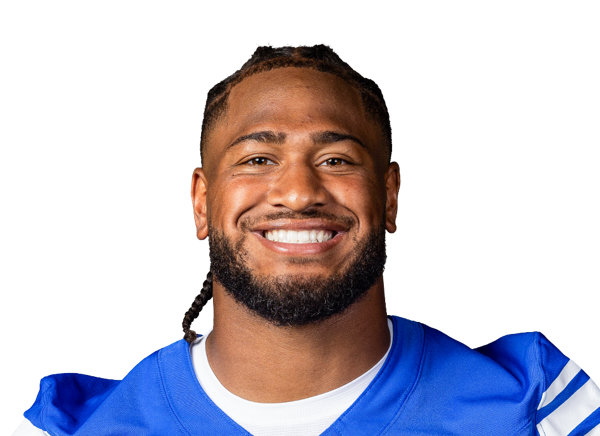 Bodie Schoonover#48 | 0 | 0 | 0 | 0 | 0 | 1 | 0 |
 Kinilau Fonohema#97 | 0 | 0 | 0 | 0 | 0 | 1 | 0 |
Arizona| Player | FG | PCT | LONG | XP | PTS |
|---|---|---|---|---|---|
 Michael Salgado-Medina#19 | 1/1 | 100.0 | 37 | 2/2 | 5 |
BYU| Player | FG | PCT | LONG | XP | PTS |
|---|---|---|---|---|---|
 Matthias Dunn#97 | 0/0 | 0.0 | 0 | 4/4 | 4 |
Arizona| Player | NO | YDS | AVG | TB | In 20 | LONG |
|---|---|---|---|---|---|---|
| Chase Ridley#37 | 4 | 176 | 44.0 | 2 | 1 | 57 |
BYU| Player | NO | YDS | AVG | TB | In 20 | LONG |
|---|---|---|---|---|---|---|
 Fuller Shurtz#19 | 5 | 230 | 46.0 | 0 | 1 | 53 |
Arizona| Player | NO | YDS | AVG | LONG | TD |
|---|---|---|---|---|---|
| Caleb Smith#20 | 1 | 34 | 34.0 | 34 | 0 |
Arizona| Player | NO | YDS | AVG | LONG | TD |
|---|---|---|---|---|---|
| Caleb Smith#20 | 1 | 5 | 5.0 | 5 | 0 |
BYU| Player | INT | YDS | TD |
|---|---|---|---|
| Cade Uluave#4 | 1 | 17 | 0 |
Drive Summary
ARIZ
Touchdown
75
BYU
Punt
8
ARIZ
Interception
2
BYU
Touchdown
9
ARIZ
Field Goal
55
BYU
Touchdown
75
ARIZ
Punt
18
BYU
Punt
0
ARIZ
Touchdown
72
BYU
Punt
30
ARIZ
End of Half
3
BYU
Touchdown
75
ARIZ
Punt
20
BYU
Punt
1
ARIZ
Punt
19
BYU
Punt
12
ARIZ
Downs
57
BYU
Touchdown
82
ARIZ
Punt
-14
BYU
End of Game
49
Injury Report
No current injury report is available for this matchup.
Head-to-Head
Historical meetings are not available for this matchup.
Game Information
StageWeek 2
Season2026
KickoffSat, Sep 12, 3:30 pm
VenueLaVell Edwards Stadium
LocationProvo, UT
SurfaceGrass
BroadcastFOX
Attendance64,409
Division Standings
FBS — Big 12 Conference
| Team | W | L | T | Pct | PF | PA | Home | Away | Strk |
|---|---|---|---|---|---|---|---|---|---|
| BYU | 7 | 2 | 0 | 0.778 | 279 | 178 | 5-0 | 2-2 | L1 |
 Cincinnati | 5 | 4 | 0 | 0.556 | 297 | 265 | 5-1 | 0-3 | L2 |
 Colorado | 3 | 6 | 0 | 0.333 | 178 | 255 | 2-2 | 1-4 | L1 |
 Houston | 7 | 2 | 0 | 0.778 | 319 | 192 | 5-0 | 2-2 | W1 |
 Kansas State | 4 | 5 | 0 | 0.444 | 282 | 241 | 4-2 | 0-3 | L3 |
 Texas Tech | 8 | 1 | 0 | 0.889 | 338 | 217 | 6-0 | 2-1 | W2 |
 Utah | 9 | 0 | 0 | 1.000 | 339 | 147 | 6-0 | 3-0 | W9 |
 West Virginia | 5 | 4 | 0 | 0.556 | 335 | 311 | 3-2 | 2-2 | L1 |
 Arizona State | 5 | 4 | 0 | 0.556 | 256 | 246 | 4-1 | 1-3 | W1 |
 Baylor | 6 | 3 | 0 | 0.667 | 287 | 153 | 4-1 | 2-2 | W2 |
 Iowa State | 4 | 5 | 0 | 0.444 | 263 | 260 | 4-1 | 0-4 | L1 |
 Kansas | 3 | 6 | 0 | 0.333 | 265 | 223 | 3-3 | 0-3 | L2 |
 Oklahoma State | 6 | 3 | 0 | 0.667 | 395 | 245 | 4-0 | 2-3 | W1 |
 TCU | 4 | 5 | 0 | 0.444 | 214 | 142 | 3-3 | 1-2 | L1 |
 UCF | 5 | 4 | 0 | 0.556 | 271 | 234 | 4-1 | 1-3 | W1 |
| Arizona | 7 | 2 | 0 | 0.778 | 308 | 179 | 5-0 | 2-2 | W1 |
Arizona
3rd in Big 12
VS
BYU
3rd in Big 12
Quarterbacks & Specialists
#1
Noah Fifita
#37
Chase Ridley
Receivers & Backs
#24
Quincy Craig
#84
Rodney Gallagher III
#11
Chris Hunter III
#8
Shane King
#18
Brandon Phelps
#3
Kedrick Reescano
#5
Giovanni Richardson
#14
Cole Rusk
#20
Caleb Smith
#12
Tre Spivey
Defensive Line & Linebackers
#48
Cooper Blomstrom
#6
Taye Brown
#19
Max Harris
#7
Chase Kennedy
#42
Dominic Lolesio
#95
Leroy Palu
#99
Mays Pese
#10
Myron Robinson
#96
Zac Siulepa
#3
Tre Smith
#44
Prince Williams
Defensive Backs
#2
Daylen Austin
#12
Dwight Bootle II
#8
Jay'Vion Cole
#15
Malcolm Hartzog Jr.
#23
Gavin Hunter
#17
Lee Molette III
#35
Quinn Olson
Other
#19
Michael Salgado-Medina
Quarterbacks & Specialists
#47
Bear Bachmeier
#19
Fuller Shurtz
Receivers & Backs
#18
Reggie Frischknecht
#1
Legend Glasker
#3
Kyler Kasper
#7
Walker Lyons
#4
LJ Martin
#13
Jojo Phillips
#12
Preston Rex
#2
Roger Saleapaga II
Defensive Line & Linebackers
#13
Tausili Akana
#90
Hunter Clegg
#31
Jake Clifton
#97
Kinilau Fonohema
#16
Isaiah Glasker
#21
Miles Hall
#30
Braxton Lindsey
#48
Bodie Schoonover
#57
Keanu Tanuvasa
#5
Nusi Taumoepeau
#4
Cade Uluave
#46
Kendal Wall
Defensive Backs
#1
Therrian Alexander III
#28
Crew Clark
#32
Cannon DeVries
Evan Johnson
#22
Tommy Prassas
#11
Faletau Satuala
#15
Jayven Williams
Other
#97
Matthias Dunn
Arizona
3rd in Big 12
VS
BYU
3rd in Big 12
Passing
72.7
Completion Percentage
62.2
234
Completions
158
2.20
Interception Percentage
3.50
7
Interceptions
9
94
Longest Pass
75
2,906
Net Passing Yards
2,052
322.9
Net Passing Yards Per Game
228.0
322
Passing Attempts
254
6.50
Passing Touchdown %
5.50
21
Passing Touchdowns
14
165.4
Passer Rating
141.4
23
Total Sacks
5
140
Sack Yards Lost
27
9.0
Yards Per Pass Attempt
8.1
2,906
Passing Yards
2,052
0
Passing Fumbles Lost
0
9
Team Games Played
9
454.0
Yards Per Game
397.1
34.2
Total Points Per Game
31.0
308
Total Points
279
39
Total Touchdowns
36
322.9
Passing Yards Per Game
228.0
234-322
Comp-Att
158-254
23-140
Sacks-Yards Lost
5-27
Rushing
297
Rushing Attempts
310
1,180
Rushing Yards
1,522
4.0
Yards Per Rush Attempt
4.9
58
Long Rushing
56
0
20+ Yard Rushing Plays
0
16
Rushing Touchdowns
21
131.1
Rushing Yards Per Game
169.1
0
Rushing Fumbles
0
0
Rushing Fumbles Lost
0
63
Rushing 1st downs
81
9
Team Games Played
9
4,086
Total Yards
3,574
642
Total Offensive Plays
569
34.2
Total Points Per Game
31.0
308
Total Points
279
39
Total Touchdowns
36
Receiving
234
Receptions
158
0
Receiving Targets
0
2,906
Receiving Yards
2,052
2,906
Receiving Yards
2,052
21
Receiving Touchdowns
14
94
Long Reception
75
0
20+ Yard Receiving Plays
0
322.9
Receiving Yards Per Game
228.0
0
Receiving Fumbles
0
0
Receiving Fumbles Lost
0
1357
Receiving Yards After Catch
1061
122
Receiving First Downs
85
9
Team Games Played
9
12.4
Yards Per Reception
13.0
34.2
Total Points Per Game
31.0
308
Total Points
279
39
Total Touchdowns
36
Miscellaneous
206
Total 1st downs
174
63
Rushing 1st downs
81
122
Passing 1st downs
85
21
1st downs by penalty
8
60
Third Down Conversions
58
120
Third Down Attempts
114
50.00
3rd down %
50.88
6
Fourth Down Conversions
5
10
First Downs Attempts
12
60.00
4th down %
41.67
59
Total Penalties
55
557
Total Penalty Yards
464
17158
Possession Time Seconds
16316
0.00
Red Zone Field Goal Percentage
0.00
0.00
Red Zone Scoring Percentage
0.00
0.00
Red Zone Efficiency Percentage
0.00
0.00
Red Zone Touchdown Percentage
0.00
14
Total Takeaways
14
9
Total Giveaways
12
5
Turnover Ratio
2
0
Fumbles Lost
0
60-120
3rd down efficiency
58-114
6-10
4th down efficiency
5-12
59-557
Total-Yards
55-464
Defense
295
Solo Tackles
308
284
Assist Tackles
228
579
Total Tackles
536
28
Sacks
20
160
Sack Yards
130
75
Stuffs
71
29
Passes Defended
54
9.0
Average Interception Yards
19.0
27
Long Interception
59
0
Miscellaneous Touchdowns
0
2
Kicks Blocked
1
51
Tackles For Loss
47
9
Team Games Played
9
Defensive Interceptions
3
Interceptions
6
27
Interception Yards
114
0
Interception Touchdowns
0
3-27
INT: Total
6-114
General
7
Fumbles
7
6
Forced Fumbles
5
7
Fumbles Recovered
5
1
Fumbles Touchdowns
0
9
Games Played
9
7-0
Fumbles-Lost
7-0
Returning
3
Kick Returns
7
57
Kick Return Yards
216
19.0
Yards Per Kick Return
30.9
34
Long Kick Return
100
0
Kick Return Touchdowns
1
6
Punt Returns
21
127
Punt Return Yards
233
21.2
Yards Per Punt Return
11.1
69
Long Punt Return
46
1
Punt Return Touchdowns
0
0
Punt Return Fair Catches
0
0
Kick Return Fumbles Lost
0
0
Punt Return Fumbles Lost
0
9
Team Games Played
9
6-127
Punt: Total
21-233
Kicking
12
Field Goal Made
9
16
Field Goal Attempts
10
75.0
Field Goal Percentage
90.0
53
Long Field Goal Made
49
0
Field Goal Attempts 1-19
0
4
Field Goal Attempts 20-29
2
5
Field Goal Attempts 30-39
3
5
Field Goal Attempts 40-49
5
2
Field Goal Attempts 50+
0
36
Extra Points Made
36
37
Extra Point Attempts
36
97.3
Extra Point Percentage
100.0
0
Field Goals Made 1-19
0
4
Field Goals Made 20-29
2
4
Field Goals Made 30-39
3
2
Field Goals Made 40-49
4
2
Field Goals Made 50+
0
72
Total Kicking Points
63
9
Team Games Played
9
75
Touchback Percentage
85
0.0
Average Kickoff Return Yards
0.0
0
Kickoff Return Yards
0
0
Kickoff Returns
0
0-0
Kickoffs: Total
0-0
12-16
FG: Good-Attempts
9-10
Punting
27
Punts
29
1,140
Punt Yards
1,273
57
Long Punt
61
42.2
Gross Average Punt Yards
43.9
42.2
Net Average Punt Yards
43.9
0
Punts Blocked
0
10
Punts Inside 20
7
3
Touchbacks
0
15
Fair Catches
12
4
Punt Returns
5
0
Punt Return Yards
0
0.0
Average Punt Return Yards
0.0
9
Team Games Played
9
27-1,140
Punt: Total Yards
29-1,273
Scoring
16
Rushing Touchdowns
21
21
Receiving Touchdowns
14
1
Return Touchdowns
1
39
Total Touchdowns
36
12
Field Goals
9
36
Kick Extra Points
36
1
Total Two Point Conversions
0
308
Total Points
279
34.2
Total Points Per Game
31.0