

Arkansas-Pine Bluff vs Missouri Live Score (4 Sep, 2026)
Score by Quarter
| Team | Q1 | Q2 | Q3 | Q4 | Final |
|---|---|---|---|---|---|
 Arkansas-Pine Bluff |
0 | 0 | 7 | 7 | 14 |
 Missouri |
14 | 26 | 0 | 14 | 54 |
Scoring Plays
Q1
9:38
9:38
Shaun Terry II 25 Yd pass from Austin Simmons (Blake Craig Kick)
Passing Touchdown
0 – 7
Q1
4:16
4:16
Donovan Olugbode 14 Yd pass from Austin Simmons (Blake Craig Kick)
Passing Touchdown
0 – 14
Q2
12:56
12:56
Jamal Roberts 1 Yd Run (Blake Craig Kick)
Rushing Touchdown
0 – 21
Q2
5:52
5:52
Team Safety
Safety
0 – 23
Q2
5:44
5:44
Donovan Olugbode 35 Yd pass from Austin Simmons (Blake Craig Kick)
Passing Touchdown
0 – 30
Q2
4:01
4:01
Cayden Lee 47 Yd pass from Austin Simmons (Blake Craig Kick)
Passing Touchdown
0 – 37
Q2
0:00
0:00
Blake Craig 32 Yd Field Goal
Field Goal Good
0 – 40
Q3
2:31
2:31
Za'Marion Webber 27 Yd Run (Trey Glymph Kick)
Rushing Touchdown
7 – 40
Q4
10:00
10:00
Matt Zollers 5 Yd Run (Blake Craig Kick)
Rushing Touchdown
7 – 47
Q4
6:13
6:13
David Brewer IV 16 Yd pass from Jack Schierholz (Trey Glymph Kick)
Passing Touchdown
14 – 47
Q4
3:49
3:49
Preston Hatfield 9 Yd Run (Blake Craig Kick)
Rushing Touchdown
14 – 54
Game Leaders
Arkansas-Pine BluffMissouri
 J. Schierholz QB
Passing Yards
 A. Simmons QB
 Z. Webber RB
Rushing Yards
 J. Roberts RB
 D. Brewer IV WR
Receiving Yards
 D. Olugbode WR
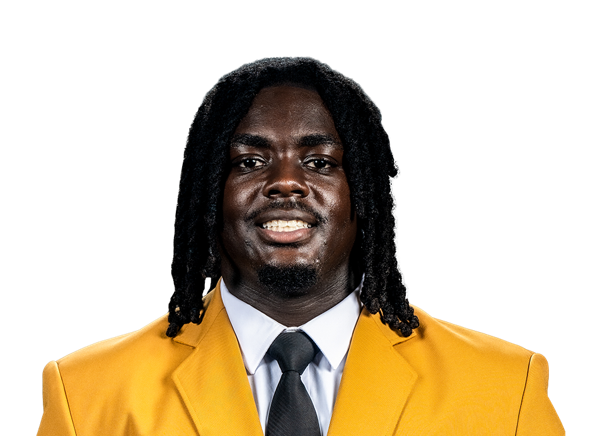 D. Simon Jr. DE
Sacks
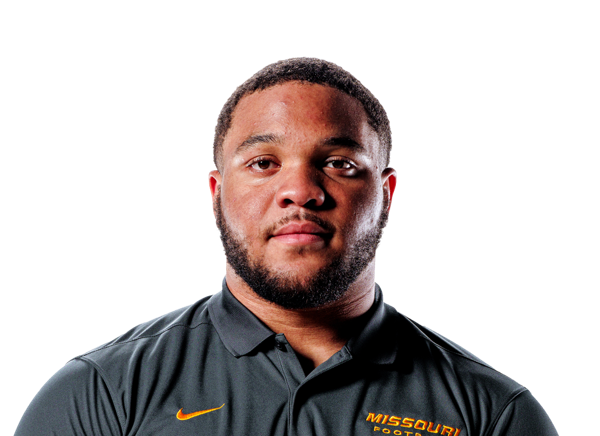 J. Dowell DTN. Walker LB
Tackles
 J. Beasley LB
Player Box Score
Arkansas-Pine Bluff| Player | C/ATT | YDS | AVG | TD | INT | QBR |
|---|---|---|---|---|---|---|
| Jack Schierholz#12 | 4/10 | 67 | 6.7 | 1 | 0 | -- |
 Garrison Davis#15 | 6/13 | 50 | 3.8 | 0 | 0 | -- |
 Landon Holcomb#9 | 1/1 | -8 | -8.0 | 0 | 0 | -- |
Missouri| Player | C/ATT | YDS | AVG | TD | INT | QBR |
|---|---|---|---|---|---|---|
| Austin Simmons#13 | 17/19 | 252 | 13.3 | 4 | 0 | 96.7 |
 Matt Zollers#5 | 8/12 | 87 | 7.3 | 0 | 0 | 25.5 |
 Nick Evers#10 | 1/2 | 18 | 9.0 | 0 | 0 | -- |
Arkansas-Pine Bluff| Player | CAR | YDS | AVG | TD | LONG |
|---|---|---|---|---|---|
| Za'Marion Webber#5 | 7 | 56 | 8.0 | 1 | 27 |
 Jalen Williams#3 | 5 | 30 | 6.0 | 0 | 27 |
| Troyce Grimsley#88 | 1 | 18 | 18.0 | 0 | 18 |
 Jaylen Jennings#1 | 6 | 17 | 2.8 | 0 | 13 |
| Jack Schierholz#12 | 3 | 7 | 2.3 | 0 | 4 |
 Chris Hicks Jr.#10 | 3 | 5 | 1.7 | 0 | 3 |
| Garrison Davis#15 | 2 | 1 | 0.5 | 0 | 6 |
 D'Avery Robinson#2 | 1 | 0 | 0.0 | 0 | 0 |
| Team | 1 | -45 | -45.0 | 0 | 0 |
Missouri| Player | CAR | YDS | AVG | TD | LONG |
|---|---|---|---|---|---|
| Jamal Roberts#20 | 13 | 47 | 3.6 | 1 | 12 |
 Xai'Shaun Edwards#24 | 7 | 45 | 6.4 | 0 | 11 |
 Preston Hatfield#28 | 4 | 34 | 8.5 | 1 | 17 |
 Anthony Favrow#31 | 8 | 30 | 3.8 | 0 | 11 |
| Matt Zollers#5 | 6 | 26 | 4.3 | 1 | 9 |
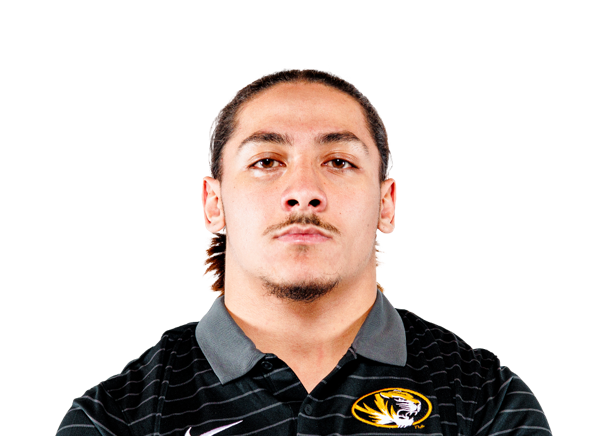 Malae Fonoti#21 | 3 | 18 | 6.0 | 0 | 10 |
 Max Warner#22 | 2 | 7 | 3.5 | 0 | 7 |
| Austin Simmons#13 | 2 | -2 | -1.0 | 0 | 2 |
Arkansas-Pine Bluff| Player | REC | YDS | AVG | TD | LONG |
|---|---|---|---|---|---|
| David Brewer IV#83 | 2 | 29 | 14.5 | 1 | 16 |
 Bryce Robinson#86 | 1 | 23 | 23.0 | 0 | 23 |
| Chris Hicks Jr.#10 | 1 | 15 | 15.0 | 0 | 15 |
| D'Avery Robinson#2 | 1 | 12 | 12.0 | 0 | 12 |
| Dwayne Simmons#87 | 1 | 12 | 12.0 | 0 | 12 |
| Jalen Williams#3 | 1 | 11 | 11.0 | 0 | 11 |
 Demetric Whitlock#17 | 1 | 6 | 6.0 | 0 | 6 |
| Paul Summers II#84 | 2 | 1 | 0.5 | 0 | 9 |
 Jordan Jackson#6 | 1 | 0 | 0.0 | 0 | 0 |
Missouri| Player | REC | YDS | AVG | TD | LONG |
|---|---|---|---|---|---|
| Donovan Olugbode#1 | 8 | 116 | 14.5 | 2 | 35 |
 Cayden Lee#19 | 4 | 80 | 20.0 | 1 | 47 |
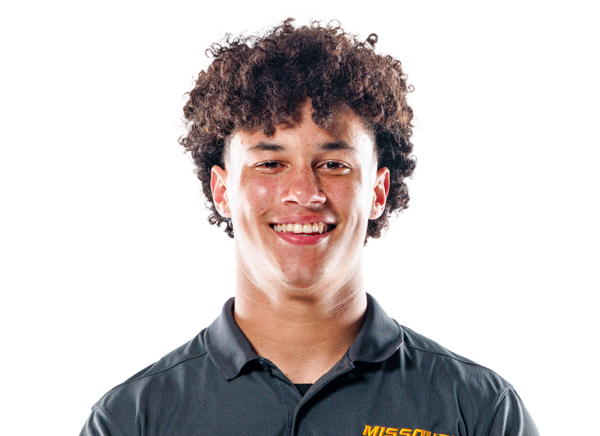 Shaun Terry II#4 | 4 | 55 | 13.8 | 1 | 25 |
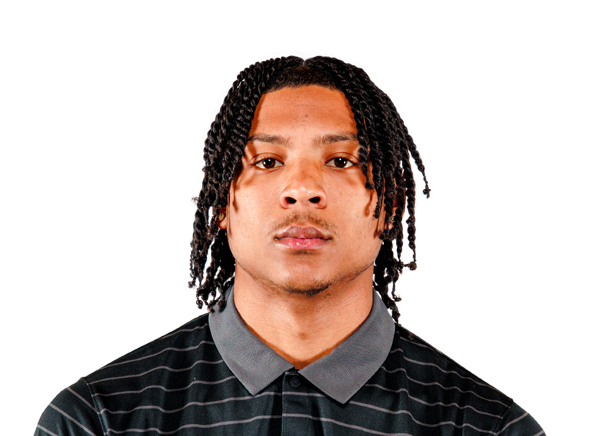 Naeshaun Montgomery | 3 | 47 | 15.7 | 0 | 29 |
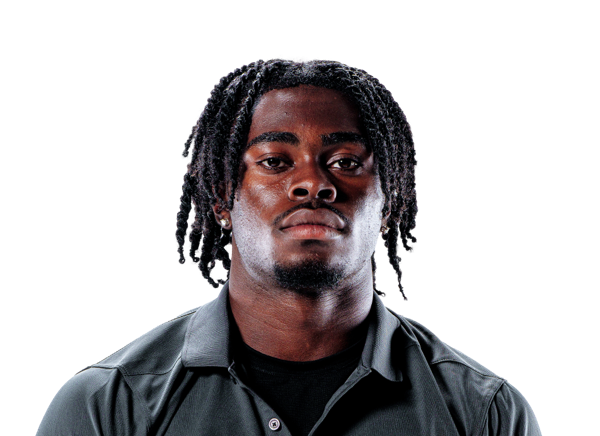 DaMarion Fowlkes#3 | 1 | 18 | 18.0 | 0 | 18 |
| Xai'Shaun Edwards#24 | 2 | 14 | 7.0 | 0 | 15 |
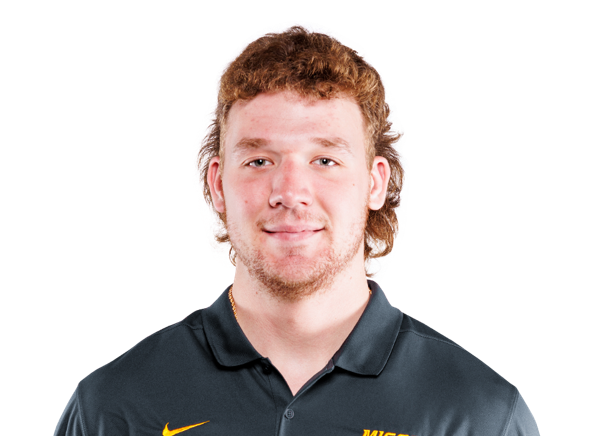 Brett Norfleet#87 | 2 | 13 | 6.5 | 0 | 9 |
| Anthony Favrow#31 | 1 | 9 | 9.0 | 0 | 9 |
 Caleb Goodie Sr.#2 | 1 | 5 | 5.0 | 0 | 5 |
Arkansas-Pine Bluff| Player | TOT | SOLO | SACKS | TFL | PD | QB HUR | TD |
|---|---|---|---|---|---|---|---|
| Nate Walker#50 | 10 | 4 | 0 | 1 | 0 | 0 | 0 |
| Derick Simon Jr.#90 | 8 | 5 | 0.5 | 1.5 | 0 | 0 | 0 |
 Michael Henderson#35 | 7 | 5 | 0 | 0 | 1 | 0 | 0 |
| Amajah Lewis#49 | 6 | 2 | 0 | 0 | 0 | 0 | 0 |
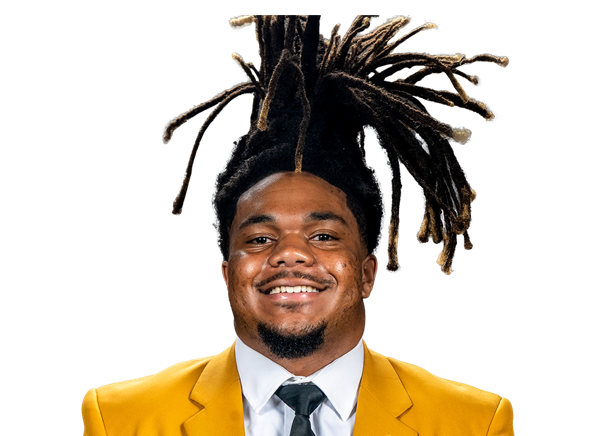 Bryson Williams#37 | 5 | 4 | 0 | 0 | 0 | 0 | 0 |
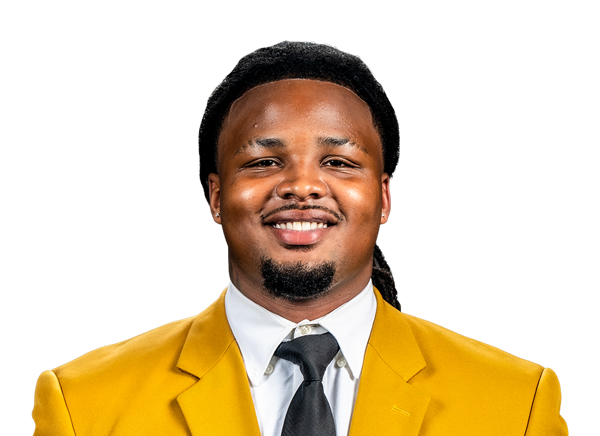 Danarius Hilliard | 5 | 3 | 0 | 1 | 0 | 0 | 0 |
 Mohammed Kelleh#51 | 5 | 0 | 0 | 0 | 0 | 0 | 0 |
| Du'Wayne Paulhill Jr.#27 | 4 | 3 | 0 | 0 | 0 | 0 | 0 |
 Derron Moore#14 | 4 | 2 | 0 | 0 | 0 | 0 | 0 |
| Keiyhaun Wilks#98 | 3 | 3 | 0 | 1 | 0 | 0 | 0 |
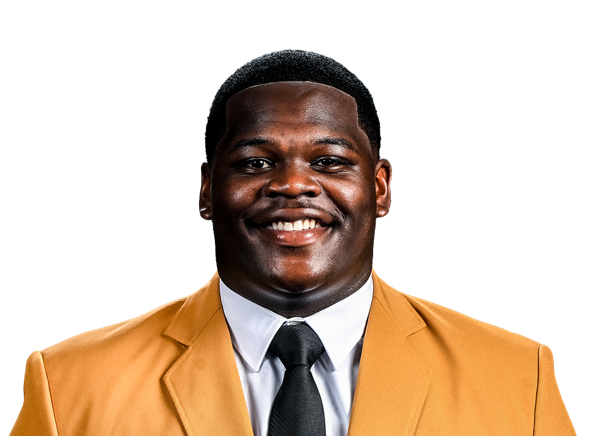 Javien Blanks#58 | 3 | 1 | 0 | 0 | 0 | 0 | 0 |
| Azayvonne Stribling#32 | 3 | 1 | 0 | 0 | 0 | 0 | 0 |
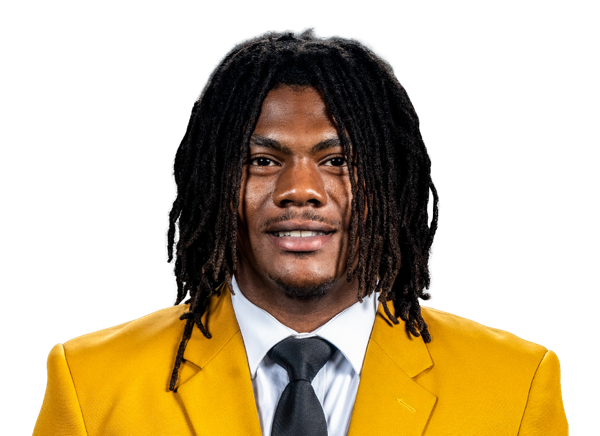 Derrick Murdock#44 | 2 | 2 | 0 | 1 | 0 | 0 | 0 |
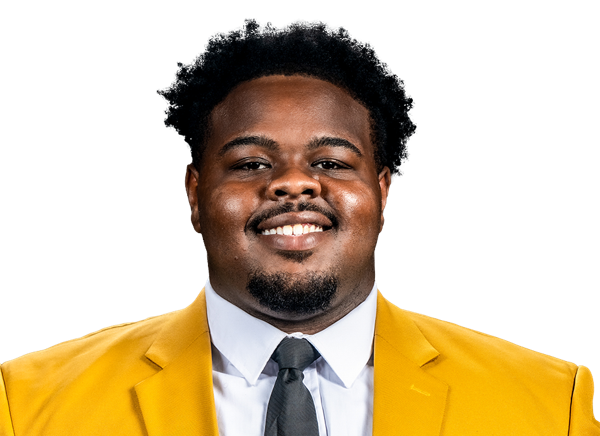 Randall Davis#60 | 2 | 1 | 0 | 0 | 0 | 0 | 0 |
 Na'il Johnson#38 | 2 | 1 | 0 | 0 | 0 | 0 | 0 |
| Malachi McDonald#99 | 2 | 1 | 0 | 0 | 0 | 0 | 0 |
 Tylan Cole#11 | 2 | 0 | 0 | 0 | 0 | 0 | 0 |
 Marquis Cagle#91 | 2 | 0 | 0 | 0 | 0 | 0 | 0 |
| Camare Jackson#28 | 2 | 0 | 0 | 0 | 0 | 0 | 0 |
 KJ Sims#43 | 1 | 1 | 0 | 0 | 0 | 0 | 0 |
| Machai Campbell#30 | 1 | 0 | 0.5 | 0.5 | 0 | 0 | 0 |
| JaiTeriyas Robinson#21 | 1 | 0 | 0 | 0 | 0 | 0 | 0 |
| Josh Narcisse#93 | 1 | 0 | 0 | 0 | 0 | 0 | 0 |
Missouri| Player | TOT | SOLO | SACKS | TFL | PD | QB HUR | TD |
|---|---|---|---|---|---|---|---|
| Jeremiah Beasley#6 | 7 | 2 | 0 | 0 | 0 | 0 | 0 |
 Brian Huff#17 | 4 | 2 | 0 | 0 | 0 | 0 | 0 |
 Elijah Dotson#22 | 3 | 3 | 0 | 1 | 0 | 0 | 0 |
 Bobby Washington Jr.#16 | 3 | 1 | 0 | 1.5 | 0 | 0 | 0 |
 Nicholas Rodriguez#5 | 3 | 0 | 0 | 0 | 0 | 0 | 0 |
 Dante McClellan#9 | 3 | 0 | 0 | 0 | 0 | 0 | 0 |
| Jason Dowell#92 | 2 | 2 | 1 | 1 | 0 | 0 | 0 |
 Robert Woodyard Jr. | 2 | 2 | 0 | 0 | 0 | 0 | 0 |
 CJ Bass III#14 | 2 | 2 | 0 | 0 | 1 | 0 | 0 |
 Nick DeLoach Jr.#24 | 2 | 1 | 0 | 0 | 0 | 0 | 0 |
 Santana Banner#15 | 2 | 1 | 0 | 0 | 0 | 0 | 0 |
 Jackson Hancock#34 | 2 | 0 | 0 | 0 | 0 | 0 | 0 |
 Jayden McGregory#28 | 2 | 0 | 0 | 0 | 0 | 0 | 0 |
| Cayden Lee#19 | 1 | 1 | 0 | 0 | 0 | 0 | 0 |
 Jahlil Florence#21 | 1 | 1 | 0 | 0 | 0 | 0 | 0 |
 Cameron Keys#20 | 1 | 1 | 0 | 0 | 0 | 0 | 0 |
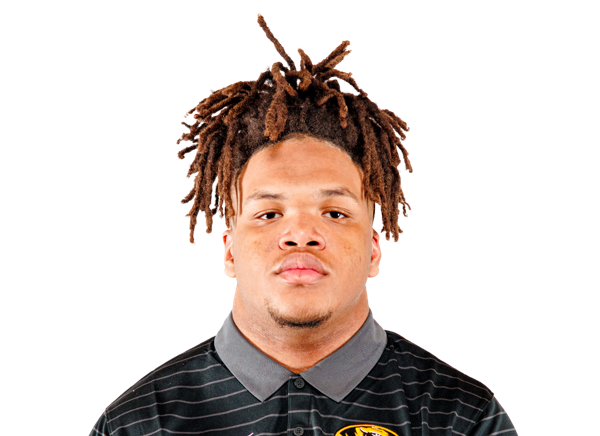 Donta Simpson#8 | 1 | 1 | 0 | 0 | 0 | 0 | 0 |
 Sione Laulea#2 | 1 | 1 | 0 | 0 | 0 | 0 | 0 |
 Langden Kitchen#11 | 1 | 1 | 0 | 1 | 0 | 0 | 0 |
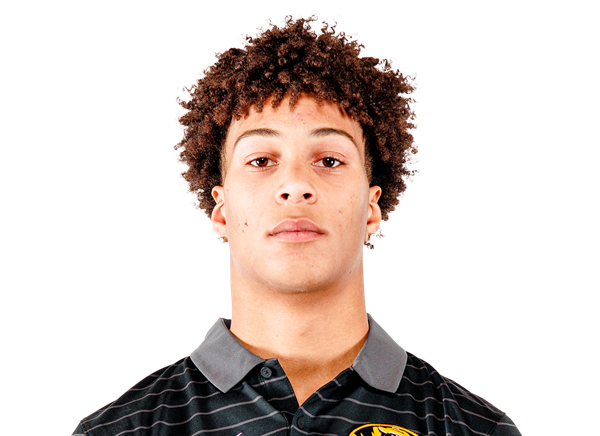 Brody Jones#32 | 1 | 1 | 0 | 1 | 0 | 0 | 0 |
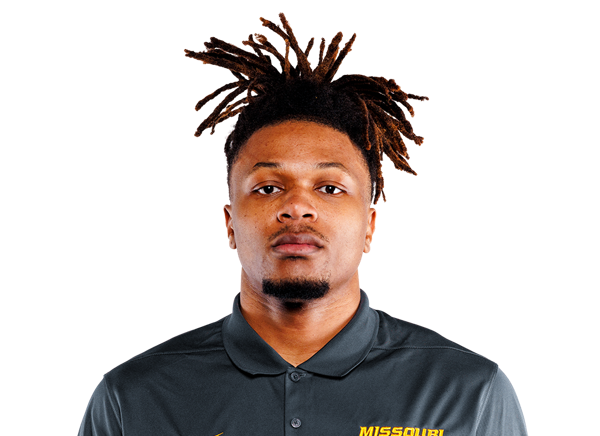 Darris Smith#19 | 1 | 0 | 0 | 0 | 0 | 1 | 0 |
 Malik Bryant#12 | 1 | 0 | 0 | 0.5 | 0 | 0 | 0 |
 Mark Hensley#57 | 1 | 0 | 0 | 0 | 0 | 0 | 0 |
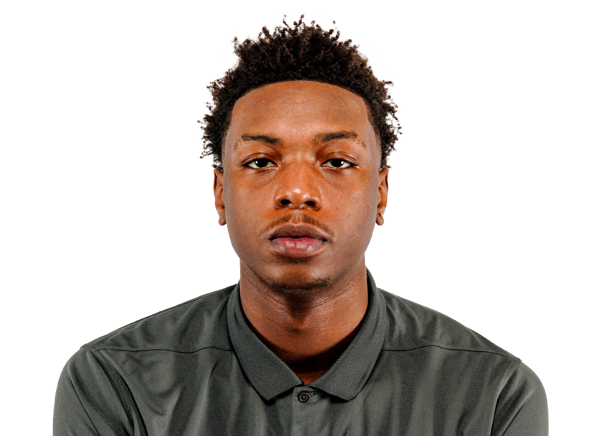 Kamauryn Morgan#29 | 1 | 0 | 0 | 0 | 0 | 0 | 0 |
 JaDon Blair#18 | 1 | 0 | 0 | 0 | 0 | 0 | 0 |
 Jaden Jones#13 | 1 | 0 | 0 | 0 | 0 | 0 | 0 |
 Jaxson Gates#26 | 1 | 0 | 0 | 0 | 0 | 0 | 0 |
 Sterling Webb#90 | 0 | 0 | 0 | 0 | 0 | 1 | 0 |
 Daeden Hopkins#10 | 0 | 0 | 0 | 0 | 0 | 1 | 0 |
Arkansas-Pine Bluff| Player | FUM | LOST | REC |
|---|---|---|---|
| Team | 1 | 0 | 0 |
| Chris Hicks Jr.#10 | 1 | 0 | 0 |
| Michael Henderson#35 | 0 | 0 | 1 |
Missouri| Player | FUM | LOST | REC |
|---|---|---|---|
| Donovan Olugbode#1 | 1 | 1 | 0 |
Arkansas-Pine Bluff| Player | FG | PCT | LONG | XP | PTS |
|---|---|---|---|---|---|
 Trey Glymph#48 | 0/0 | 0.0 | 0 | 2/2 | 2 |
Missouri| Player | FG | PCT | LONG | XP | PTS |
|---|---|---|---|---|---|
 Blake Craig#19 | 1/1 | 100.0 | 32 | 7/7 | 10 |
Arkansas-Pine Bluff| Player | NO | YDS | AVG | TB | In 20 | LONG |
|---|---|---|---|---|---|---|
| George Wiles-Koehler#97 | 8 | 313 | 39.1 | 1 | 1 | 56 |
Missouri| Player | NO | YDS | AVG | TB | In 20 | LONG |
|---|---|---|---|---|---|---|
 Brunno Reus#40 | 2 | 87 | 43.5 | 1 | 1 | 52 |
Missouri| Player | NO | YDS | AVG | LONG | TD |
|---|---|---|---|---|---|
| DaMarion Fowlkes#3 | 2 | 34 | 17.0 | 23 | 0 |
Drive Summary
MIZ
Touchdown
70
UAPB
Punt
-2
MIZ
Touchdown
49
UAPB
Punt
6
MIZ
Touchdown
57
UAPB
Punt
19
MIZ
Fumble
52
UAPB
Safety
-41
MIZ
Touchdown
35
UAPB
Punt
5
MIZ
Touchdown
57
UAPB
Punt
19
MIZ
Field Goal
66
UAPB
Punt
29
MIZ
Punt
37
UAPB
Touchdown
80
MIZ
Punt
23
UAPB
Punt
4
MIZ
Touchdown
44
UAPB
Touchdown
75
MIZ
Touchdown
50
UAPB
Punt
-11
MIZ
End of Game
13
Injury Report
No current injury report is available for this matchup.
Head-to-Head
Historical meetings are not available for this matchup.
Game Information
StageWeek 1
Season2026
KickoffThu, Sep 3, 8:00 pm
VenueMemorial Stadium
LocationColumbia, MO
SurfaceArtificial Turf
BroadcastSEC Network
Attendance63,609
Division Standings
FBS — Southeastern Conference
| Team | W | L | T | Pct | PF | PA | Home | Away | Strk |
|---|---|---|---|---|---|---|---|---|---|
 Alabama | 8 | 2 | 0 | 0.800 | 358 | 189 | 4-1 | 4-1 | W3 |
 Arkansas | 4 | 6 | 0 | 0.400 | 214 | 253 | 3-3 | 1-3 | W1 |
 Auburn | 6 | 4 | 0 | 0.600 | 260 | 246 | 4-2 | 2-2 | W2 |
 Florida | 6 | 4 | 0 | 0.600 | 313 | 262 | 3-2 | 3-2 | W1 |
 Georgia | 9 | 1 | 0 | 0.900 | 418 | 147 | 6-1 | 3-0 | W3 |
 Kentucky | 7 | 3 | 0 | 0.700 | 283 | 253 | 4-2 | 3-1 | L2 |
 LSU | 6 | 4 | 0 | 0.600 | 355 | 181 | 5-2 | 1-2 | L2 |
 Mississippi State | 4 | 6 | 0 | 0.400 | 245 | 291 | 2-4 | 2-2 | L6 |
| Missouri | 6 | 4 | 0 | 0.600 | 293 | 229 | 4-1 | 2-3 | L2 |
 Oklahoma | 5 | 4 | 0 | 0.556 | 199 | 173 | 3-2 | 2-2 | W1 |
 Ole Miss | 6 | 3 | 0 | 0.667 | 304 | 234 | 5-1 | 1-2 | L1 |
 South Carolina | 6 | 4 | 0 | 0.600 | 318 | 245 | 4-2 | 2-2 | L1 |
 Tennessee | 8 | 2 | 0 | 0.800 | 314 | 143 | 5-1 | 3-1 | W2 |
 Texas | 8 | 2 | 0 | 0.800 | 302 | 178 | 5-1 | 3-1 | W4 |
 Texas A&M | 4 | 6 | 0 | 0.400 | 242 | 190 | 4-2 | 0-4 | L3 |
 Vanderbilt | 4 | 6 | 0 | 0.400 | 213 | 286 | 3-3 | 1-3 | L1 |
Arkansas-Pine Bluff
5th in SWAC
VS
Missouri
6th in SEC
Quarterbacks & Specialists
#15
Garrison Davis
#9
Landon Holcomb
#12
Jack Schierholz
#97
George Wiles-Koehler
Receivers & Backs
#83
David Brewer IV
#88
Troyce Grimsley
#10
Chris Hicks Jr.
#6
Jordan Jackson
#1
Jaylen Jennings
#86
Bryce Robinson
#2
D'Avery Robinson
#87
Dwayne Simmons
#5
Za'Marion Webber
#17
Demetric Whitlock
#3
Jalen Williams
Defensive Line & Linebackers
#58
Javien Blanks
#91
Marquis Cagle
#11
Tylan Cole
#60
Randall Davis
Danarius Hilliard
#51
Mohammed Kelleh
#49
Amajah Lewis
#99
Malachi McDonald
#14
Derron Moore
#44
Derrick Murdock
#93
Josh Narcisse
#90
Derick Simon Jr.
#43
KJ Sims
#50
Nate Walker
#98
Keiyhaun Wilks
Defensive Backs
#30
Machai Campbell
#35
Michael Henderson
#28
Camare Jackson
#38
Na'il Johnson
#27
Du'Wayne Paulhill Jr.
#21
JaiTeriyas Robinson
#32
Azayvonne Stribling
#37
Bryson Williams
Other
#48
Trey Glymph
Quarterbacks & Specialists
#10
Nick Evers
#13
Austin Simmons
#5
Matt Zollers
Receivers & Backs
#24
Xai'Shaun Edwards
#31
Anthony Favrow
#21
Malae Fonoti
#3
DaMarion Fowlkes
#2
Caleb Goodie Sr.
#28
Preston Hatfield
#19
Cayden Lee
Naeshaun Montgomery
#87
Brett Norfleet
#1
Donovan Olugbode
#20
Jamal Roberts
#4
Shaun Terry II
#22
Max Warner
Defensive Line & Linebackers
#6
Jeremiah Beasley
#92
Jason Dowell
#57
Mark Hensley
#17
Brian Huff
#9
Dante McClellan
#5
Nicholas Rodriguez
#8
Donta Simpson
#16
Bobby Washington Jr.
#90
Sterling Webb
Robert Woodyard Jr.
Defensive Backs
#15
Santana Banner
#14
CJ Bass III
#18
JaDon Blair
#24
Nick DeLoach Jr.
#22
Elijah Dotson
#21
Jahlil Florence
#26
Jaxson Gates
#34
Jackson Hancock
#32
Brody Jones
#20
Cameron Keys
#2
Sione Laulea
#28
Jayden McGregory
Other
#12
Malik Bryant
#19
Blake Craig
#10
Daeden Hopkins
#13
Jaden Jones
#11
Langden Kitchen
#29
Kamauryn Morgan
#40
Brunno Reus
#19
Darris Smith
Arkansas-Pine Bluff
2nd in SWAC - West
VS
Missouri
11th in SEC
Passing
55.8
Completion Percentage
61.4
130
Completions
202
3.90
Interception Percentage
0.90
9
Interceptions
3
94
Longest Pass
72
1,727
Net Passing Yards
2,493
172.7
Net Passing Yards Per Game
249.3
233
Passing Attempts
329
8.60
Passing Touchdown %
6.40
20
Passing Touchdowns
21
138.5
Passer Rating
144.5
19
Total Sacks
9
81
Sack Yards Lost
46
7.4
Yards Per Pass Attempt
7.6
1,727
Passing Yards
2,493
0
Passing Fumbles Lost
0
10
Team Games Played
10
382.6
Yards Per Game
401.9
33.6
Total Points Per Game
29.3
336
Total Points
293
44
Total Touchdowns
35
172.7
Passing Yards Per Game
249.3
130-233
Comp-Att
202-329
19-81
Sacks-Yards Lost
9-46
Rushing
356
Rushing Attempts
347
2,099
Rushing Yards
1,526
5.9
Yards Per Rush Attempt
4.4
87
Long Rushing
80
0
20+ Yard Rushing Plays
0
20
Rushing Touchdowns
12
209.9
Rushing Yards Per Game
152.6
0
Rushing Fumbles
0
0
Rushing Fumbles Lost
0
91
Rushing 1st downs
71
10
Team Games Played
10
3,826
Total Yards
4,019
608
Total Offensive Plays
685
33.6
Total Points Per Game
29.3
336
Total Points
293
44
Total Touchdowns
35
Receiving
130
Receptions
202
0
Receiving Targets
0
1,727
Receiving Yards
2,493
1,727
Receiving Yards
2,493
20
Receiving Touchdowns
21
94
Long Reception
72
0
20+ Yard Receiving Plays
0
172.7
Receiving Yards Per Game
249.3
0
Receiving Fumbles
0
0
Receiving Fumbles Lost
0
32
Receiving Yards After Catch
1086
71
Receiving First Downs
115
10
Team Games Played
10
13.3
Yards Per Reception
12.3
33.6
Total Points Per Game
29.3
336
Total Points
293
44
Total Touchdowns
35
Miscellaneous
183
Total 1st downs
205
91
Rushing 1st downs
71
71
Passing 1st downs
115
21
1st downs by penalty
18
44
Third Down Conversions
52
117
Third Down Attempts
140
37.61
3rd down %
37.14
4
Fourth Down Conversions
7
12
First Downs Attempts
13
33.33
4th down %
53.85
61
Total Penalties
63
467
Total Penalty Yards
582
16514
Possession Time Seconds
17659
0.00
Red Zone Field Goal Percentage
0.00
0.00
Red Zone Scoring Percentage
0.00
0.00
Red Zone Efficiency Percentage
0.00
0.00
Red Zone Touchdown Percentage
0.00
12
Total Takeaways
15
12
Total Giveaways
7
0
Turnover Ratio
8
0
Fumbles Lost
0
44-117
3rd down efficiency
52-140
4-12
4th down efficiency
7-13
61-467
Total-Yards
63-582
Defense
383
Solo Tackles
291
348
Assist Tackles
394
731
Total Tackles
685
24
Sacks
22
169
Sack Yards
160
98
Stuffs
85
20
Passes Defended
45
27.0
Average Interception Yards
13.9
100
Long Interception
28
0
Miscellaneous Touchdowns
0
3
Kicks Blocked
0
65
Tackles For Loss
43
10
Team Games Played
10
Defensive Interceptions
10
Interceptions
7
270
Interception Yards
97
3
Interception Touchdowns
0
10-270
INT: Total
7-97
General
10
Fumbles
11
4
Forced Fumbles
14
3
Fumbles Recovered
12
0
Fumbles Touchdowns
1
10
Games Played
10
10-0
Fumbles-Lost
11-0
Returning
26
Kick Returns
16
667
Kick Return Yards
331
25.7
Yards Per Kick Return
20.7
74
Long Kick Return
54
0
Kick Return Touchdowns
0
10
Punt Returns
10
138
Punt Return Yards
150
13.8
Yards Per Punt Return
15.0
76
Long Punt Return
68
1
Punt Return Touchdowns
1
0
Punt Return Fair Catches
0
0
Kick Return Fumbles Lost
0
0
Punt Return Fumbles Lost
0
10
Team Games Played
10
10-138
Punt: Total
10-150
Kicking
10
Field Goal Made
15
12
Field Goal Attempts
24
83.3
Field Goal Percentage
62.5
39
Long Field Goal Made
53
1
Field Goal Attempts 1-19
0
4
Field Goal Attempts 20-29
5
6
Field Goal Attempts 30-39
10
1
Field Goal Attempts 40-49
2
0
Field Goal Attempts 50+
7
42
Extra Points Made
34
42
Extra Point Attempts
34
100.0
Extra Point Percentage
100.0
1
Field Goals Made 1-19
0
4
Field Goals Made 20-29
2
5
Field Goals Made 30-39
7
0
Field Goals Made 40-49
1
0
Field Goals Made 50+
5
72
Total Kicking Points
79
10
Team Games Played
10
29
Touchback Percentage
78
0.0
Average Kickoff Return Yards
0.0
0
Kickoff Return Yards
0
0
Kickoff Returns
0
0-0
Kickoffs: Total
0-0
10-12
FG: Good-Attempts
15-24
Punting
42
Punts
48
1,563
Punt Yards
2,099
56
Long Punt
66
37.2
Gross Average Punt Yards
43.7
37.2
Net Average Punt Yards
43.7
0
Punts Blocked
0
10
Punts Inside 20
16
4
Touchbacks
6
16
Fair Catches
16
11
Punt Returns
5
0
Punt Return Yards
0
0.0
Average Punt Return Yards
0.0
10
Team Games Played
10
42-1,563
Punt: Total Yards
48-2,099
Scoring
20
Rushing Touchdowns
12
20
Receiving Touchdowns
21
1
Return Touchdowns
1
41
Total Touchdowns
35
10
Field Goals
15
42
Kick Extra Points
34
0
Total Two Point Conversions
1
336
Total Points
293
33.6
Total Points Per Game
29.3