

Arkansas State vs TCU Live Score (20 Sep, 2026)
Score by Quarter
| Team | Q1 | Q2 | Q3 | Q4 | Final |
|---|---|---|---|---|---|
 Arkansas State | 0 | 7 | 0 | 0 | 7 |
 TCU | 7 | 7 | 7 | 10 | 31 |
Scoring Plays
Q1
8:36
8:36
J. Payne run for 3 yds, for a TD (N. McCashland KICK)
Rushing Touchdown
0 – 7
Q2
5:10
5:10
J. Craig pass to Ed Small for 17 yds, for a TD (N. McCashland KICK)
Passing Touchdown
0 – 14
Q2
1:05
1:05
E. Jolly run for 1 yd, for a TD (C. Van Andel KICK)
Rushing Touchdown
7 – 14
Q3
0:17
0:17
J. Craig pass to K. Pimpton for 9 yds, for a TD (N. McCashland KICK)
Passing Touchdown
7 – 21
Q4
5:26
5:26
N. McCashland 29 yd FG GOOD
Field Goal Good
7 – 24
Q4
1:52
1:52
J. Craig pass to K. Ashley for 29 yds, for a TD (N. McCashland KICK)
Passing Touchdown
7 – 31
Game Leaders
Arkansas StateTCU
 T. Owens QB
Passing Yards
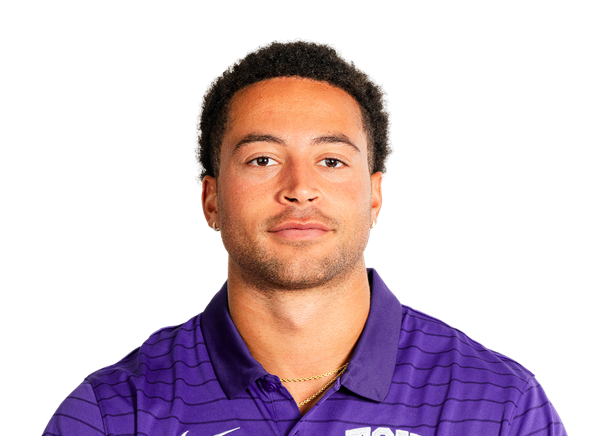 J. Craig QBT. Owens QB
Rushing Yards
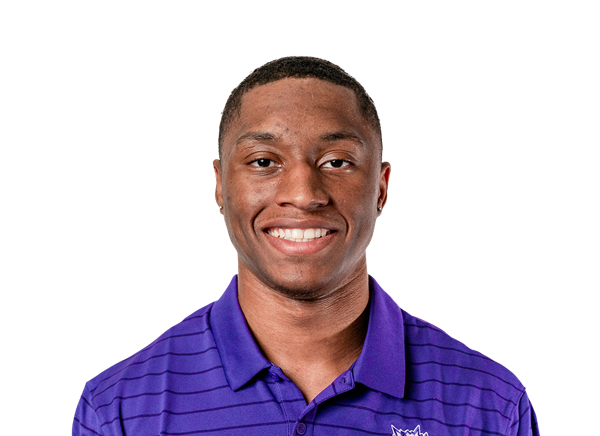 J. Payne RB
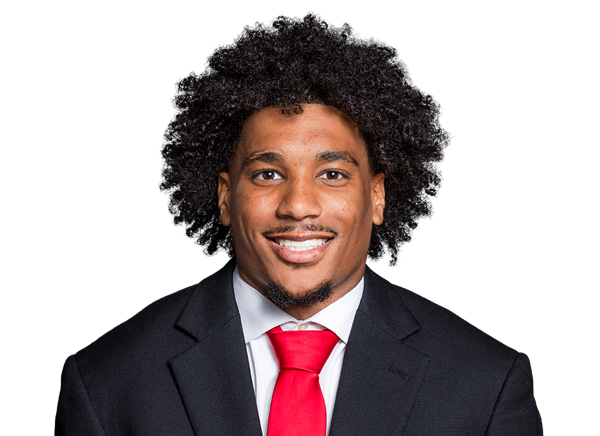 H. Summers WR
Receiving Yards
 E. Small WR
 R. Reese DT
Sacks
 P. Oyewale LB
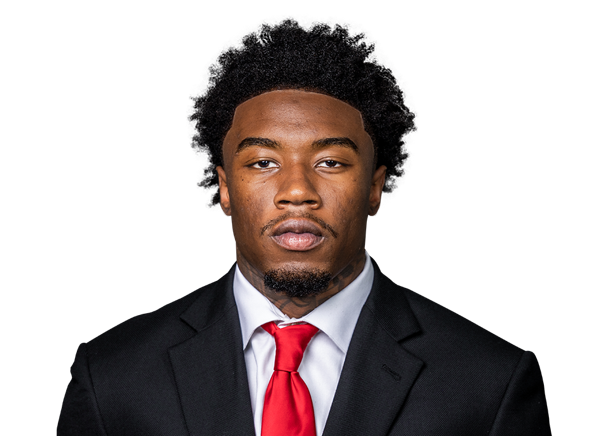 F. Hamilton S
Tackles
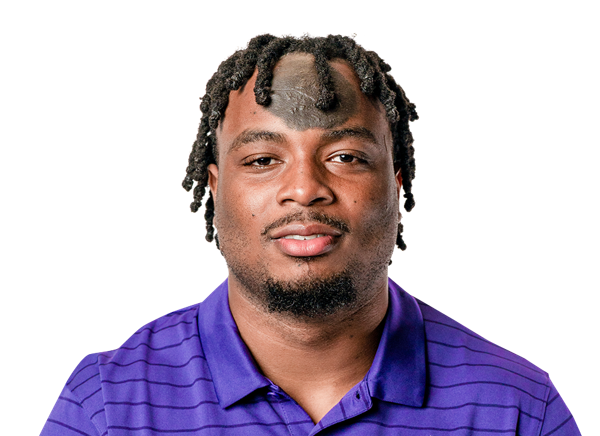 J. Johnson S
Player Box Score
Arkansas State| Player | C/ATT | YDS | AVG | TD | INT |
|---|---|---|---|---|---|
| Trey Owens#9 | 11/24 | 133 | 5.5 | 0 | 0 |
TCU| Player | C/ATT | YDS | AVG | TD | INT |
|---|---|---|---|---|---|
| Jaden Craig#1 | 21/29 | 337 | 11.6 | 3 | 1 |
Arkansas State| Player | CAR | YDS | AVG | TD | LONG |
|---|---|---|---|---|---|
| Trey Owens#9 | 7 | 58 | 8.3 | 0 | 34 |
 James Lee#27 | 6 | 28 | 4.7 | 0 | 9 |
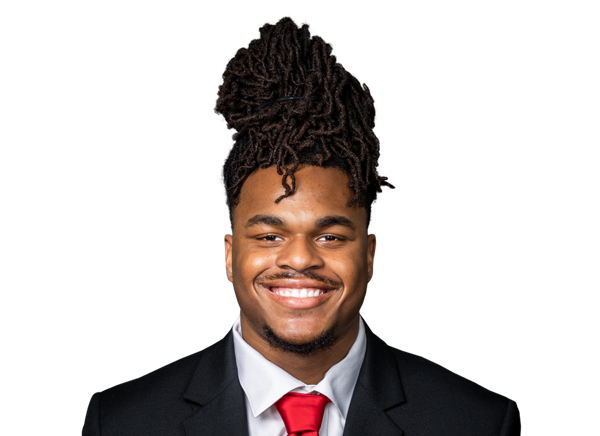 Solomon Baggett#23 | 9 | 27 | 3.0 | 0 | 11 |
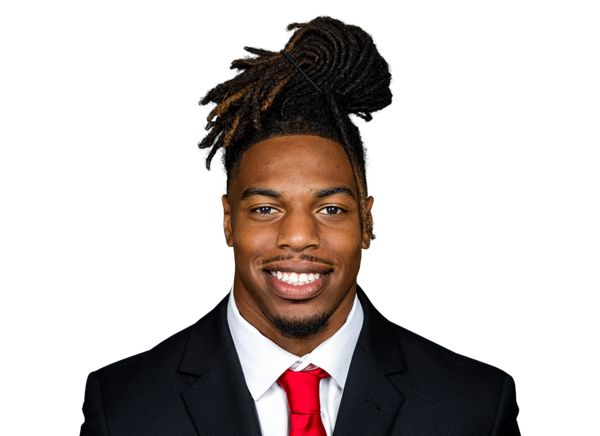 Kenyon Clay#5 | 2 | 5 | 2.5 | 0 | 5 |
 Ezell Jolly#22 | 3 | 4 | 1.3 | 1 | 2 |
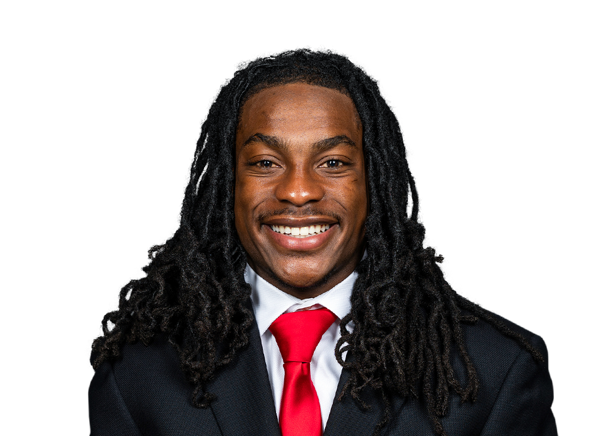 Chauncy Cobb#2 | 1 | 4 | 4.0 | 0 | 4 |
 Timothy Carter#31 | 2 | 2 | 1.0 | 0 | 2 |
TCU| Player | CAR | YDS | AVG | TD | LONG |
|---|---|---|---|---|---|
| Jeremy Payne#26 | 24 | 86 | 3.6 | 1 | 11 |
 Joe Pitchford#24 | 7 | 26 | 3.7 | 0 | 11 |
| Jaden Craig#1 | 7 | 20 | 2.9 | 0 | 11 |
 Landon Walker#27 | 1 | -1 | -1.0 | 0 | 0 |
Arkansas State| Player | REC | YDS | AVG | TD | LONG |
|---|---|---|---|---|---|
| Hunter Summers#3 | 3 | 47 | 15.7 | 0 | 31 |
 Jabari Bush#17 | 1 | 46 | 46.0 | 0 | 46 |
| Chauncy Cobb#2 | 3 | 12 | 4.0 | 0 | 7 |
 Jaylen Bonelli#10 | 1 | 10 | 10.0 | 0 | 10 |
| Solomon Baggett#23 | 1 | 10 | 10.0 | 0 | 10 |
| Ezell Jolly#22 | 1 | 6 | 6.0 | 0 | 6 |
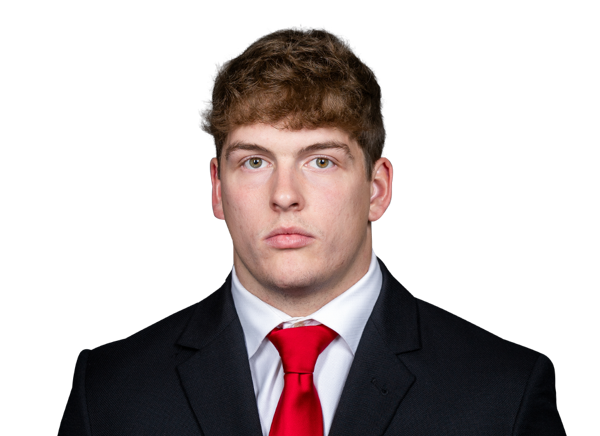 Tyler Little#11 | 1 | 2 | 2.0 | 0 | 2 |
TCU| Player | REC | YDS | AVG | TD | LONG |
|---|---|---|---|---|---|
| Ed Small#18 | 7 | 164 | 23.4 | 1 | 52 |
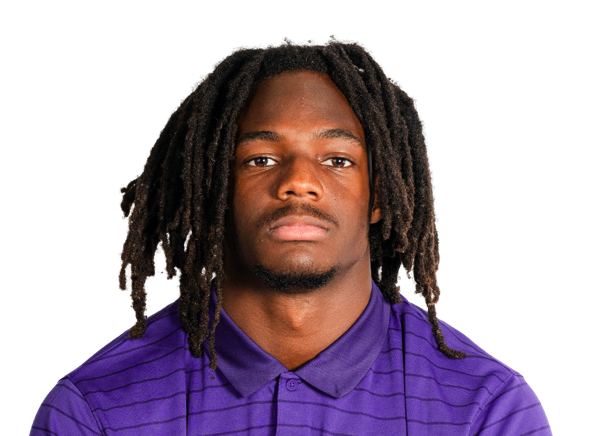 Kari Ashley#81 | 5 | 87 | 17.4 | 1 | 32 |
 Jacobe Hayes#80 | 3 | 52 | 17.3 | 0 | 29 |
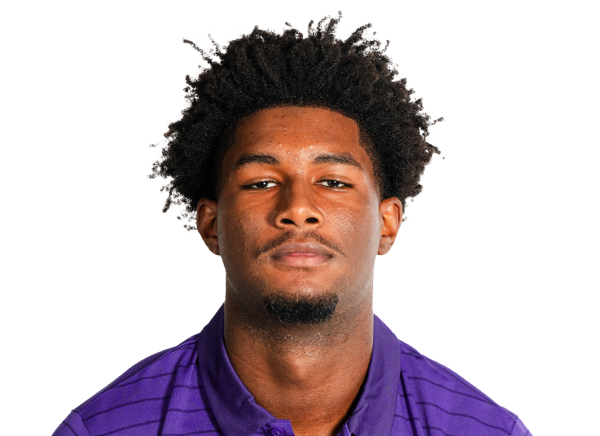 Jeremy Scott#6 | 2 | 13 | 6.5 | 0 | 9 |
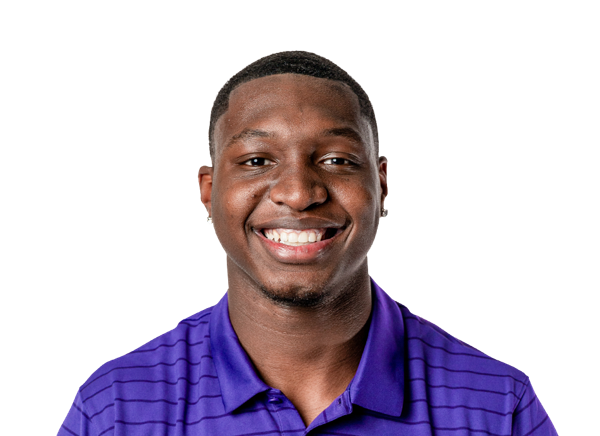 Ka'Morreun Pimpton#88 | 1 | 9 | 9.0 | 1 | 9 |
| Jeremy Payne#26 | 2 | 9 | 4.5 | 0 | 5 |
| Joe Pitchford#24 | 1 | 3 | 3.0 | 0 | 3 |
Arkansas State| Player | TOT | SOLO | SACKS | TFL | PD | QB HUR | TD |
|---|---|---|---|---|---|---|---|
| Five Hamilton#5 | 12 | 11 | 0 | 1 | 0 | 0 | 0 |
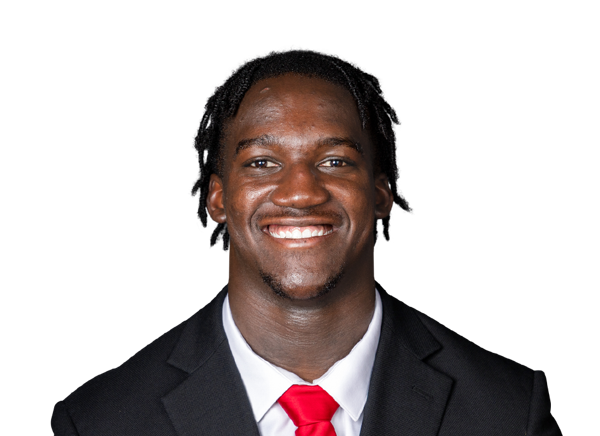 Joe Drew#16 | 12 | 9 | 0 | 0 | 0 | 0 | 0 |
 Robert Stevens#23 | 7 | 6 | 0 | 1 | 1 | 0 | 0 |
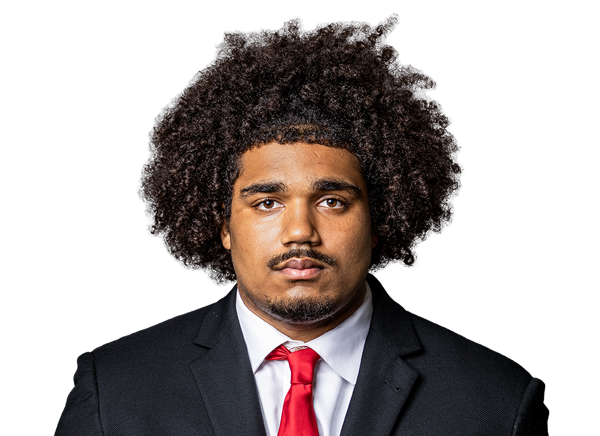 Elias Sherman#92 | 6 | 4 | 0 | 0 | 0 | 0 | 0 |
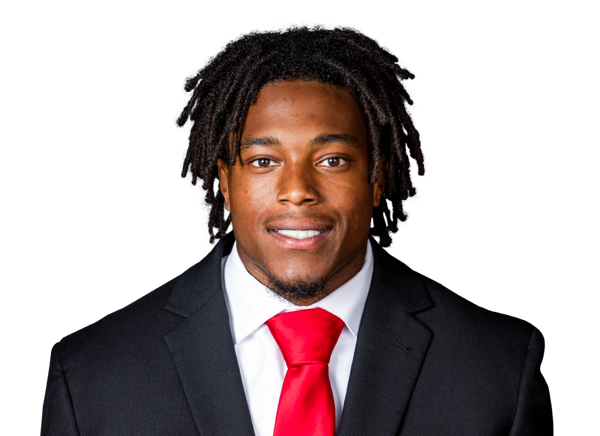 AG McGhee#6 | 4 | 4 | 0 | 0 | 0 | 0 | 0 |
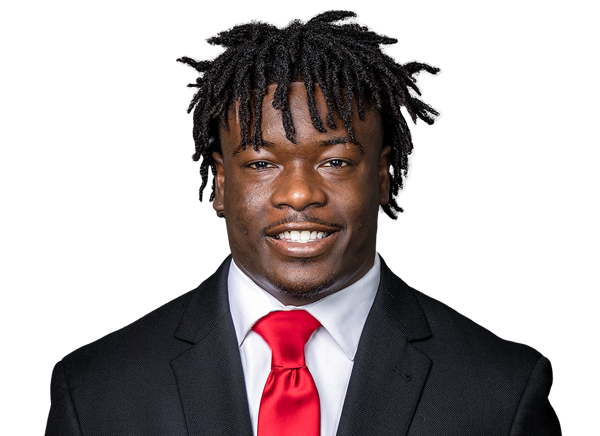 Makai Shahid#4 | 4 | 3 | 0 | 0 | 0 | 0 | 0 |
| Ryan Reese#54 | 3 | 1 | 1 | 1.5 | 0 | 0 | 0 |
 Brandon Greil#15 | 3 | 1 | 0 | 0 | 0 | 0 | 0 |
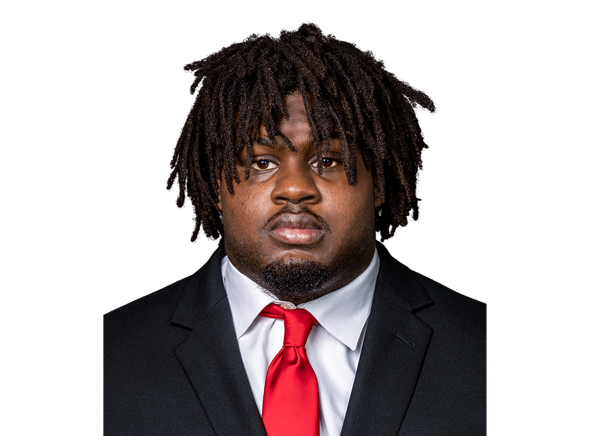 Shakai Woods#98 | 2 | 2 | 0 | 0 | 0 | 0 | 0 |
 Gavin Taylor#30 | 2 | 2 | 0 | 0 | 0 | 0 | 0 |
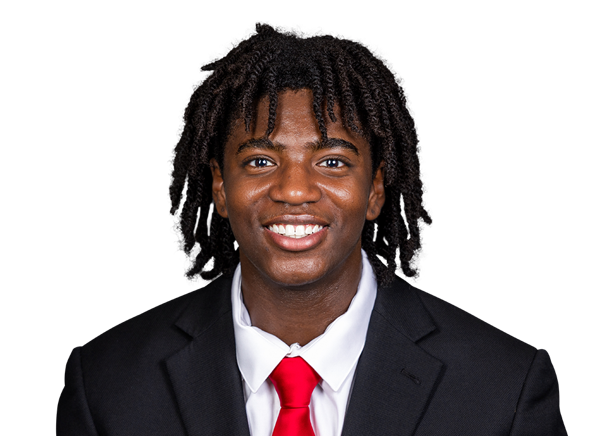 Mckinley Mcshan#34 | 2 | 2 | 0 | 0 | 0 | 0 | 0 |
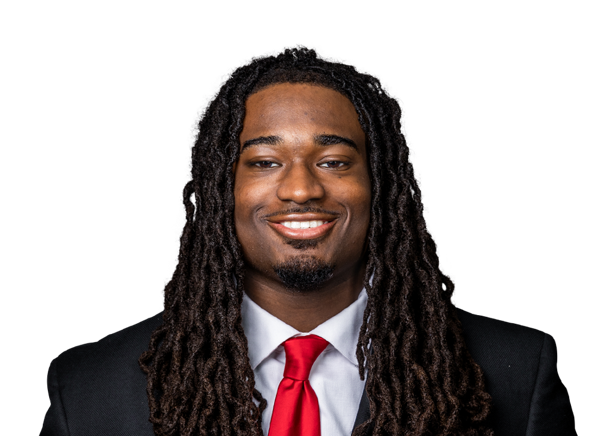 TJ Grant#20 | 2 | 1 | 0 | 0.5 | 0 | 0 | 0 |
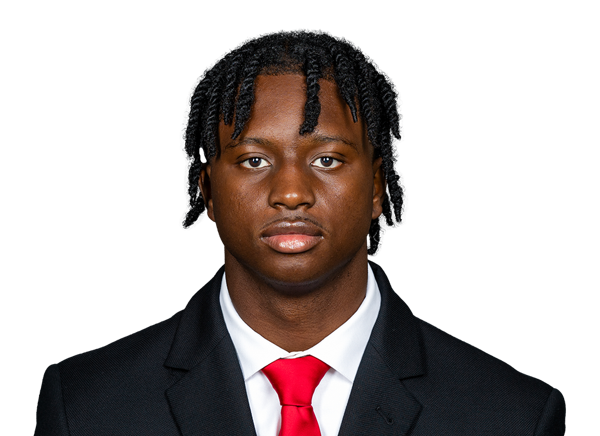 Kyle Williams#13 | 1 | 1 | 0 | 0 | 0 | 0 | 0 |
 Braden Jackson#1 | 1 | 1 | 0 | 0 | 0 | 0 | 0 |
 Reed Linder#84 | 1 | 0 | 0 | 0 | 0 | 0 | 0 |
 Brandon Barnes#8 | 1 | 0 | 0 | 0 | 0 | 0 | 0 |
 Marquis Williams#17 | 1 | 0 | 0 | 0 | 0 | 0 | 0 |
TCU| Player | TOT | SOLO | SACKS | TFL | PD | QB HUR | TD |
|---|---|---|---|---|---|---|---|
| Jamel Johnson#2 | 7 | 5 | 0 | 0 | 0 | 1 | 0 |
 Hudson Hooper#37 | 7 | 5 | 0 | 0 | 0 | 0 | 0 |
 Ansel Din-Mbuh#92 | 7 | 4 | 0 | 0 | 0 | 0 | 0 |
 Devyn Hidrogo#15 | 4 | 4 | 0 | 0 | 0 | 0 | 0 |
 Gil Jackson Jr.#4 | 4 | 3 | 0 | 0 | 1 | 1 | 0 |
 Julius Simms#7 | 3 | 2 | 0 | 0 | 1 | 0 | 0 |
 Max Carroll#3 | 3 | 0 | 0 | 0 | 1 | 0 | 0 |
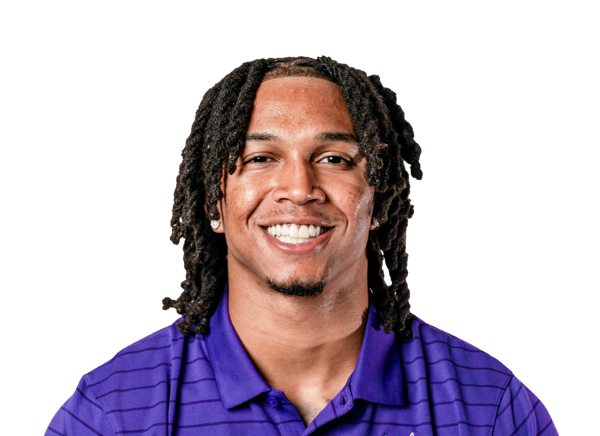 Vernon Glover Jr.#1 | 2 | 2 | 0 | 0 | 1 | 0 | 0 |
 Kaden McFadden#18 | 2 | 2 | 0 | 0 | 0 | 0 | 0 |
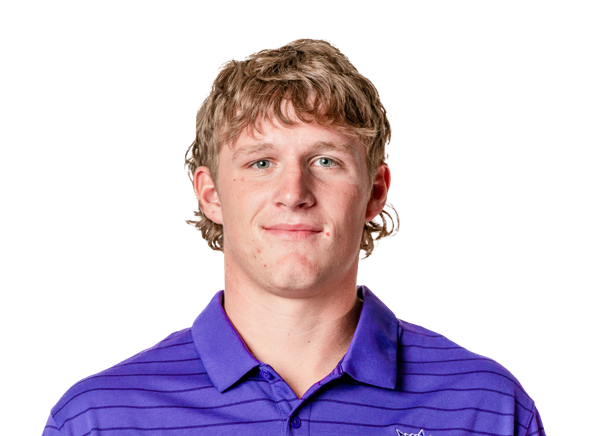 John Schobel#14 | 2 | 1 | 0 | 0 | 0 | 1 | 0 |
 Markis Deal#95 | 2 | 0 | 0 | 0 | 1 | 0 | 0 |
| Paul Oyewale#97 | 1 | 1 | 1 | 1 | 0 | 1 | 0 |
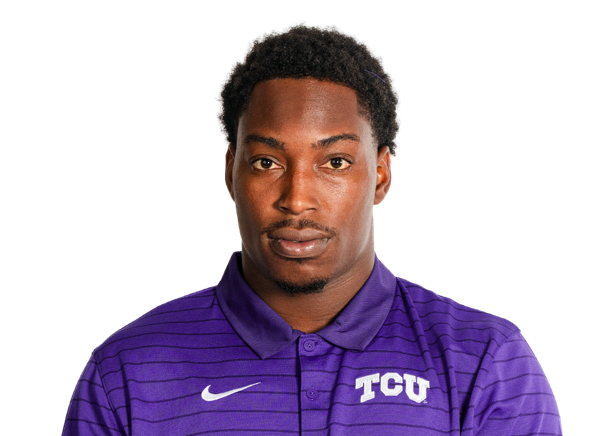 Koron Hayward#16 | 1 | 1 | 1 | 1 | 0 | 0 | 0 |
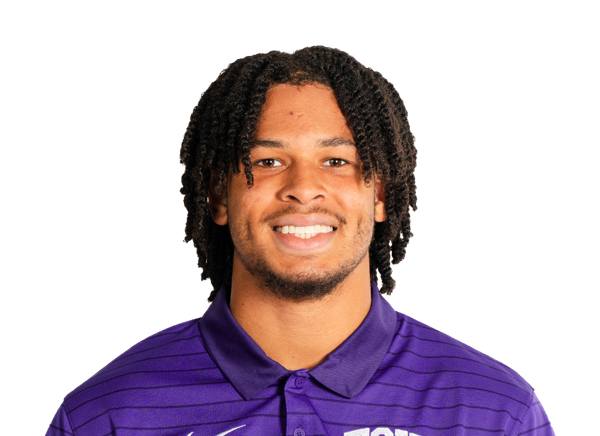 Michael Short#11 | 1 | 1 | 0 | 0 | 0 | 0 | 0 |
 Jordan Lester#22 | 1 | 1 | 0 | 0 | 1 | 0 | 0 |
| Jeremy Scott#6 | 1 | 1 | 0 | 0 | 0 | 0 | 0 |
 Floyd Guidry#91 | 1 | 1 | 0 | 0 | 0 | 0 | 0 |
 CJ Woodfork#9 | 1 | 1 | 0 | 0 | 0 | 0 | 0 |
 Tristan Johnson#35 | 1 | 0 | 0 | 0 | 0 | 0 | 0 |
 Brock King#16 | 0 | 0 | 0 | 0 | 0 | 1 | 0 |
TCU| Player | FUM | LOST | REC |
|---|---|---|---|
 Ace Theus#4 | 1 | 0 | 0 |
Arkansas State| Player | FG | PCT | LONG | XP | PTS |
|---|---|---|---|---|---|
 Clune Van Andel#34 | 0/0 | 0.0 | 0 | 1/1 | 1 |
TCU| Player | FG | PCT | LONG | XP | PTS |
|---|---|---|---|---|---|
 Nate McCashland#99 | 1/1 | 100.0 | 29 | 4/4 | 7 |
Arkansas State| Player | NO | YDS | AVG | TB | In 20 | LONG |
|---|---|---|---|---|---|---|
 Daniel Vuckovic#90 | 6 | 239 | 39.8 | 0 | 2 | 47 |
TCU| Player | NO | YDS | AVG | TB | In 20 | LONG |
|---|---|---|---|---|---|---|
 John Hoyet Chance#48 | 3 | 158 | 52.7 | 0 | 2 | 56 |
TCU| Player | NO | YDS | AVG | LONG | TD |
|---|---|---|---|---|---|
| Ace Theus#4 | 1 | 18 | 18.0 | 18 | 0 |
Arkansas State| Player | NO | YDS | AVG | LONG | TD |
|---|---|---|---|---|---|
| Jaylen Bonelli#10 | 2 | 16 | 8.0 | 14 | 0 |
TCU| Player | NO | YDS | AVG | LONG | TD |
|---|---|---|---|---|---|
| Ace Theus#4 | 4 | 26 | 6.5 | 21 | 0 |
Arkansas State| Player | INT | YDS | TD |
|---|---|---|---|
| Kyle Williams#13 | 1 | 24 | 0 |
Drive Summary
ARST
Punt
19
TCU
Touchdown
76
ARST
Downs
39
TCU
Punt
0
ARST
Punt
8
TCU
Interception
11
ARST
Punt
15
TCU
Downs
30
ARST
Punt
2
TCU
Touchdown
77
ARST
Punt
22
TCU
Punt
16
ARST
Touchdown
84
TCU
End Of Half
28
TCU
6
ARST
Downs
60
TCU
Touchdown
99
ARST
Punt
2
TCU
Field Goal
78
ARST
Downs
9
TCU
Touchdown
33
ARST
End Of Quarter
11
Injury Report
No current injury report is available for this matchup.
Head-to-Head
Historical meetings are not available for this matchup.
Game Information
StageWeek 3
Season2026
KickoffSat, Sep 19, 8:00 pm
VenueAmon G. Carter Stadium
LocationFort Worth, TX
SurfaceGrass
BroadcastESPNU
Division Standings
FBS — Big 12 Conference
| Team | W | L | T | Pct | PF | PA | Home | Away | Strk |
|---|---|---|---|---|---|---|---|---|---|
 Texas Tech | 8 | 1 | 0 | 0.889 | 338 | 217 | 6-0 | 2-1 | W2 |
 BYU | 7 | 2 | 0 | 0.778 | 279 | 178 | 5-0 | 2-2 | L1 |
 Arizona State | 5 | 4 | 0 | 0.556 | 256 | 246 | 4-1 | 1-3 | W1 |
 Cincinnati | 5 | 4 | 0 | 0.556 | 297 | 265 | 5-1 | 0-3 | L2 |
 Kansas State | 4 | 5 | 0 | 0.444 | 282 | 241 | 4-2 | 0-3 | L3 |
 Utah | 9 | 0 | 0 | 1.000 | 339 | 147 | 6-0 | 3-0 | W9 |
 West Virginia | 5 | 4 | 0 | 0.556 | 335 | 311 | 3-2 | 2-2 | L1 |
 Baylor | 6 | 3 | 0 | 0.667 | 287 | 153 | 4-1 | 2-2 | W2 |
 Colorado | 3 | 6 | 0 | 0.333 | 178 | 255 | 2-2 | 1-4 | L1 |
 Iowa State | 4 | 5 | 0 | 0.444 | 263 | 260 | 4-1 | 0-4 | L1 |
 Oklahoma State | 6 | 3 | 0 | 0.667 | 395 | 245 | 4-0 | 2-3 | W1 |
| TCU | 4 | 5 | 0 | 0.444 | 214 | 142 | 3-3 | 1-2 | L1 |
 UCF | 5 | 4 | 0 | 0.556 | 271 | 234 | 4-1 | 1-3 | W1 |
 Houston | 7 | 2 | 0 | 0.778 | 319 | 192 | 5-0 | 2-2 | W1 |
 Arizona | 7 | 2 | 0 | 0.778 | 308 | 179 | 5-0 | 2-2 | W1 |
 Kansas | 3 | 6 | 0 | 0.333 | 265 | 223 | 3-3 | 0-3 | L2 |
Arkansas State
8th in Sun Belt
VS
TCU
12th in Big 12
Quarterbacks & Specialists
#9
Trey Owens
#90
Daniel Vuckovic
Receivers & Backs
#23
Solomon Baggett
#10
Jaylen Bonelli
#17
Jabari Bush
#31
Timothy Carter
#5
Kenyon Clay
#2
Chauncy Cobb
#22
Ezell Jolly
#27
James Lee
#84
Reed Linder
#11
Tyler Little
#3
Hunter Summers
Defensive Line & Linebackers
#20
TJ Grant
#34
Mckinley Mcshan
#54
Ryan Reese
#92
Elias Sherman
#23
Tre Stevens
#30
Gavin Taylor
#98
Shakai Woods
Defensive Backs
#8
Brandon Barnes
#16
Joe Drew
#15
Brandon Greil
#5
Five Hamilton
#1
Braden Jackson
#6
AG McGhee
#4
Makai Shahid
#13
Kyle Williams
#17
Marquis Williams
Other
#34
Clune Van Andel
Quarterbacks & Specialists
#48
John Hoyet Chance
#1
Jaden Craig
Receivers & Backs
#81
Kari Ashley
#80
Jacobe Hayes
#26
Jeremy Payne
#88
Ka'Morreun Pimpton
#24
Joe Pitchford
#6
Jeremy Scott
#18
Ed Small
#4
Ace Theus
#27
Landon Walker
Defensive Line & Linebackers
#3
Max Carroll
#95
Markis Deal
#92
Ansel Din-Mbuh
#91
Floyd Guidry
#16
Koron Hayward
#37
Hudson Hooper
#35
Tristan Johnson
#97
Paul Oyewale
#14
John Schobel
#11
Michael Short
#9
CJ Woodfork
Defensive Backs
#1
Vernon Glover Jr.
#15
Devyn Hidrogo
#4
Gil Jackson Jr.
#2
Jamel Johnson
#16
Brock King
#22
Jordan Lester
#18
Kaden McFadden
#7
Julius Simms
Other
#99
Nate McCashland
Arkansas State
2nd in Sun Belt - West
VS
TCU
8th in Big 12
Passing
68.2
Completion Percentage
64.8
159
Completions
175
2.60
Interception Percentage
2.20
6
Interceptions
6
75
Longest Pass
67
1,940
Net Passing Yards
2,207
242.5
Net Passing Yards Per Game
275.9
233
Passing Attempts
270
4.70
Passing Touchdown %
4.10
11
Passing Touchdowns
11
148.3
Passer Rating
142.7
15
Total Sacks
21
78
Sack Yards Lost
150
8.3
Yards Per Pass Attempt
8.2
1,940
Passing Yards
2,207
0
Passing Fumbles Lost
0
8
Team Games Played
8
378.9
Yards Per Game
390.5
28.8
Total Points Per Game
23.3
230
Total Points
186
29
Total Touchdowns
23
242.5
Passing Yards Per Game
275.9
159-233
Comp-Att
175-270
15-78
Sacks-Yards Lost
21-150
Rushing
265
Rushing Attempts
265
1,091
Rushing Yards
917
4.1
Yards Per Rush Attempt
3.5
48
Long Rushing
48
0
20+ Yard Rushing Plays
0
16
Rushing Touchdowns
10
136.4
Rushing Yards Per Game
114.6
0
Rushing Fumbles
0
0
Rushing Fumbles Lost
0
63
Rushing 1st downs
54
8
Team Games Played
8
3,031
Total Yards
3,124
513
Total Offensive Plays
556
28.8
Total Points Per Game
23.3
230
Total Points
186
29
Total Touchdowns
23
Receiving
159
Receptions
175
0
Receiving Targets
0
1,940
Receiving Yards
2,207
1,940
Receiving Yards
2,207
11
Receiving Touchdowns
11
75
Long Reception
67
0
20+ Yard Receiving Plays
0
242.5
Receiving Yards Per Game
275.9
0
Receiving Fumbles
0
0
Receiving Fumbles Lost
0
876
Receiving Yards After Catch
822
91
Receiving First Downs
101
8
Team Games Played
8
12.2
Yards Per Reception
12.6
28.8
Total Points Per Game
23.3
230
Total Points
186
29
Total Touchdowns
23
Miscellaneous
170
Total 1st downs
170
63
Rushing 1st downs
54
91
Passing 1st downs
101
16
1st downs by penalty
15
39
Third Down Conversions
47
94
Third Down Attempts
110
41.49
3rd down %
42.73
7
Fourth Down Conversions
7
11
First Downs Attempts
15
63.64
4th down %
46.67
40
Total Penalties
56
372
Total Penalty Yards
541
14939
Possession Time Seconds
14768
0.00
Red Zone Field Goal Percentage
0.00
0.00
Red Zone Scoring Percentage
0.00
0.00
Red Zone Efficiency Percentage
0.00
0.00
Red Zone Touchdown Percentage
0.00
11
Total Takeaways
14
8
Total Giveaways
13
3
Turnover Ratio
1
0
Fumbles Lost
0
39-94
3rd down efficiency
47-110
7-11
4th down efficiency
7-15
40-372
Total-Yards
56-541
Defense
272
Solo Tackles
303
226
Assist Tackles
144
498
Total Tackles
447
5
Sacks
18
37
Sack Yards
106
40
Stuffs
64
14
Passes Defended
23
14.7
Average Interception Yards
25.8
91
Long Interception
67
0
Miscellaneous Touchdowns
0
0
Kicks Blocked
2
15
Tackles For Loss
37
8
Team Games Played
8
Defensive Interceptions
9
Interceptions
5
132
Interception Yards
129
1
Interception Touchdowns
2
9-132
INT: Total
5-129
General
5
Fumbles
18
3
Forced Fumbles
9
5
Fumbles Recovered
8
1
Fumbles Touchdowns
0
8
Games Played
8
5-0
Fumbles-Lost
18-0
Returning
13
Kick Returns
11
302
Kick Return Yards
188
23.2
Yards Per Kick Return
17.1
82
Long Kick Return
24
0
Kick Return Touchdowns
0
8
Punt Returns
19
88
Punt Return Yards
193
11.0
Yards Per Punt Return
10.2
22
Long Punt Return
33
0
Punt Return Touchdowns
0
0
Punt Return Fair Catches
0
0
Kick Return Fumbles Lost
0
0
Punt Return Fumbles Lost
0
8
Team Games Played
8
8-88
Punt: Total
19-193
Kicking
9
Field Goal Made
8
13
Field Goal Attempts
11
69.2
Field Goal Percentage
72.7
48
Long Field Goal Made
45
0
Field Goal Attempts 1-19
0
5
Field Goal Attempts 20-29
3
1
Field Goal Attempts 30-39
3
7
Field Goal Attempts 40-49
4
0
Field Goal Attempts 50+
1
29
Extra Points Made
22
29
Extra Point Attempts
22
100.0
Extra Point Percentage
100.0
0
Field Goals Made 1-19
0
5
Field Goals Made 20-29
3
1
Field Goals Made 30-39
3
3
Field Goals Made 40-49
2
0
Field Goals Made 50+
0
56
Total Kicking Points
46
8
Team Games Played
8
50
Touchback Percentage
85
0.0
Average Kickoff Return Yards
0.0
0
Kickoff Return Yards
0
0
Kickoff Returns
0
0-0
Kickoffs: Total
0-0
9-13
FG: Good-Attempts
8-11
Punting
26
Punts
34
1,045
Punt Yards
1,466
73
Long Punt
66
40.2
Gross Average Punt Yards
43.1
40.2
Net Average Punt Yards
43.1
0
Punts Blocked
0
10
Punts Inside 20
16
1
Touchbacks
0
10
Fair Catches
8
7
Punt Returns
8
0
Punt Return Yards
0
0.0
Average Punt Return Yards
0.0
8
Team Games Played
8
26-1,045
Punt: Total Yards
34-1,466
Scoring
16
Rushing Touchdowns
10
11
Receiving Touchdowns
11
0
Return Touchdowns
0
28
Total Touchdowns
21
9
Field Goals
8
29
Kick Extra Points
22
0
Total Two Point Conversions
1
230
Total Points
186
28.8
Total Points Per Game
23.3