

Auburn vs TBD Live Score (5 Dec, 2026)
Game Information
EventMountain West Championship
StageWeek 14
Season2026
KickoffFri, Dec 4, 9:00 pm
BroadcastFOX
Game Leaders
Player leaders are not available for this matchup yet.
Injury Report
No current injury report is available for this matchup.
Head-to-Head
Historical meetings are not available for this matchup.

Auburn
6th in SEC
VS
Home
Quarterbacks & Specialists
#39

Max Bourke
#17
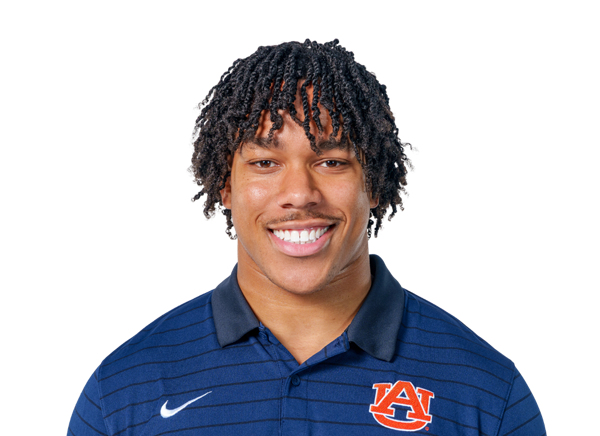
Byrum Brown
#19

Rhys Brush
#64

Benton Cantey
#16

John Colvin
#3
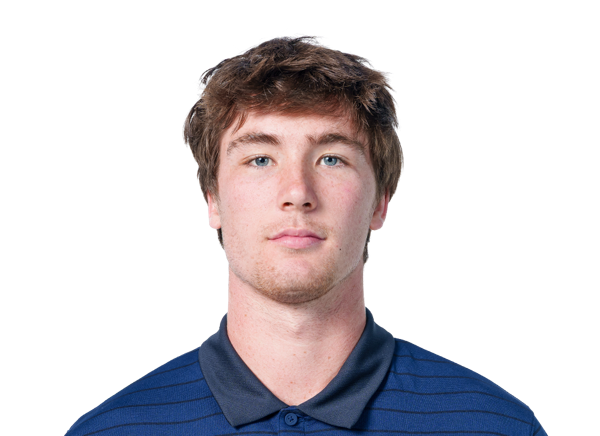
Locklan Hewlett
#14

Hudson Kaak
#37
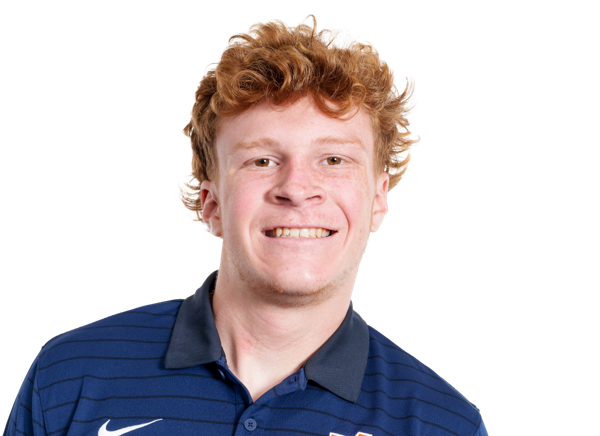
John McGuire
#11

Will Myers
#49

Hudson Powell
#10
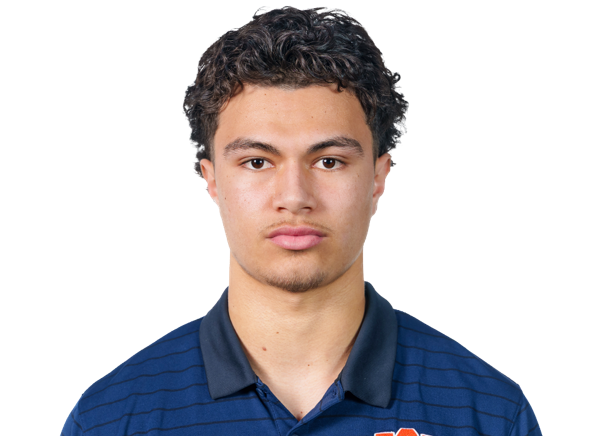
Tristan Ti'a
#47
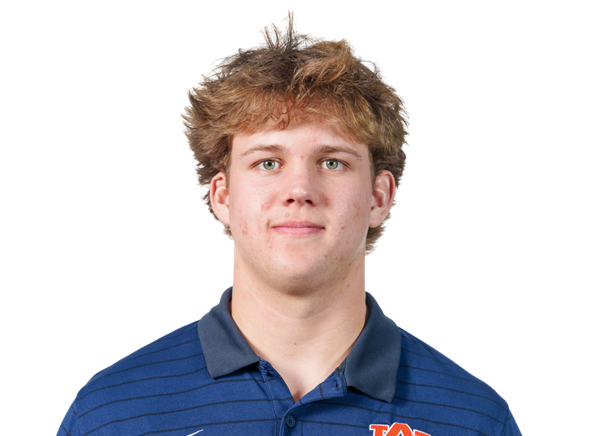
Travis Wakefield
Offensive Line
#60

Cade Barnett
#72

Cole Best
#71
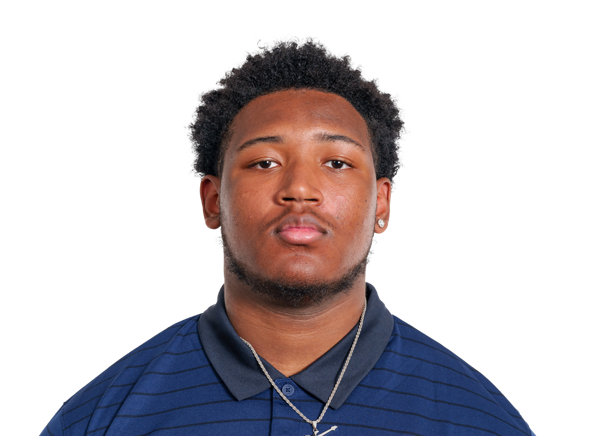
Tai Buster
#57
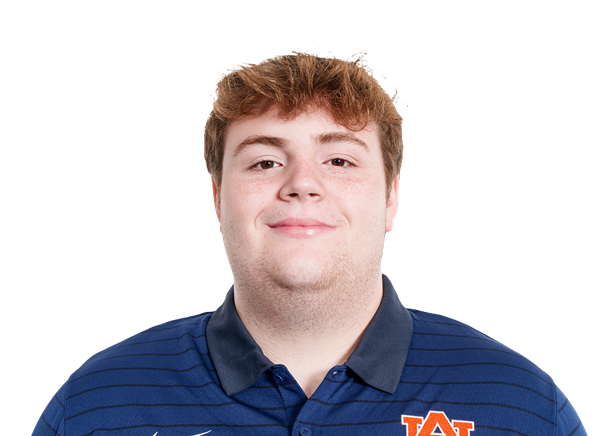
Harrison Clemmer
#51

Kail Ellis
#58
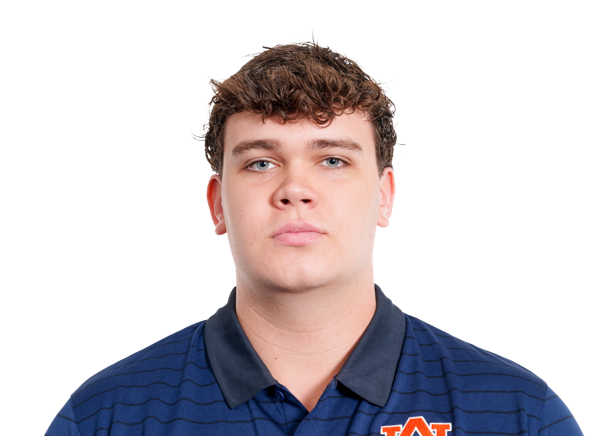
John Henry Flatt
#50
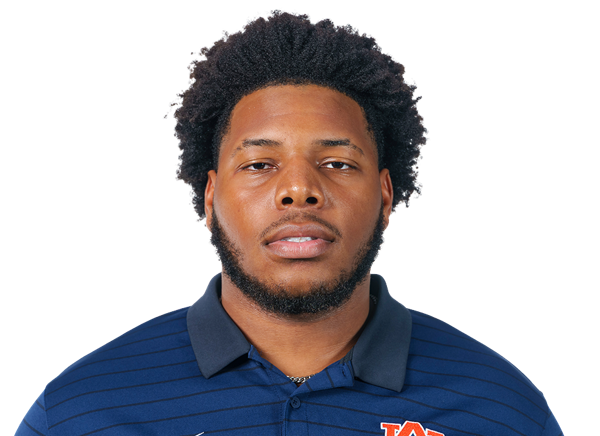
TJ Hedrick
#76
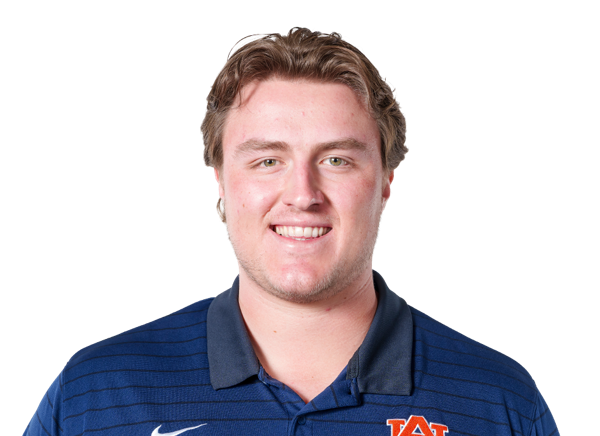
Jack Leyrer
#73
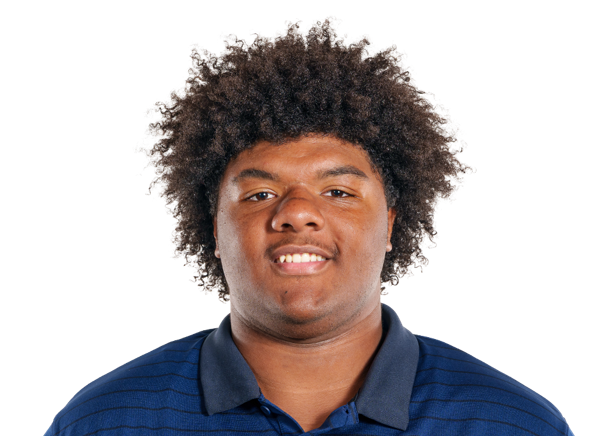
Mykall Lundy-Foster
#78
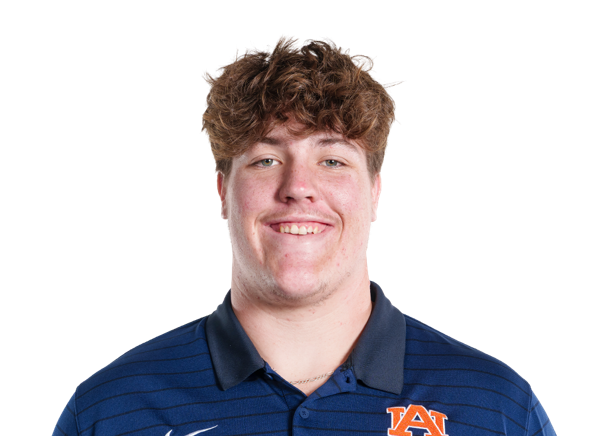
Mason Mathis
#55

Kenneth McManus IV
#75
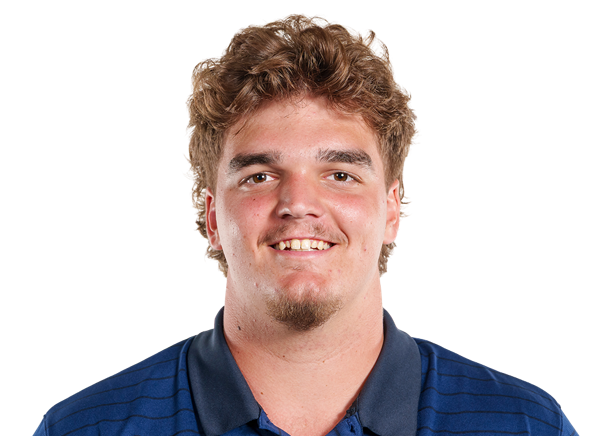
Bear McWhorter
#52
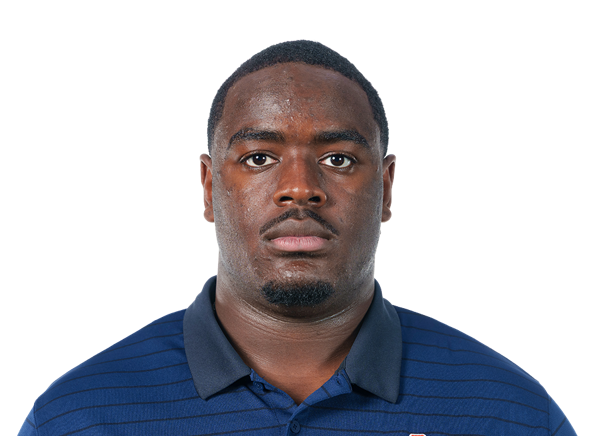
Deryc Plazz
#70
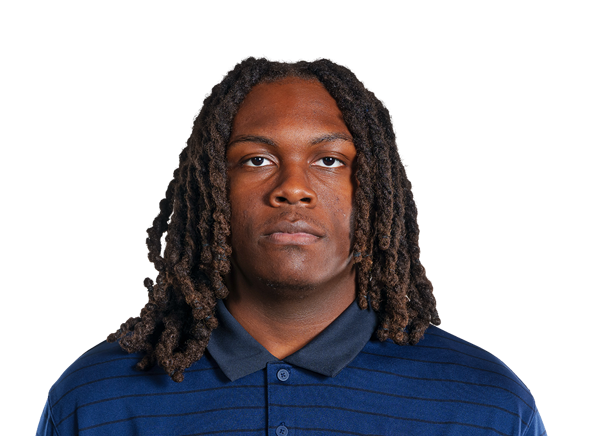
Parker Pritchett
#65
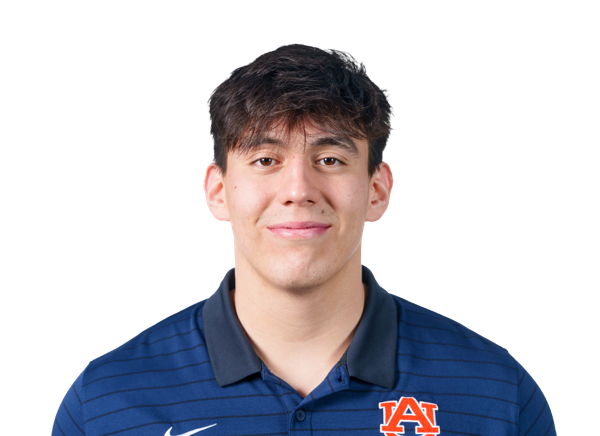
Stanton Ramil
#79
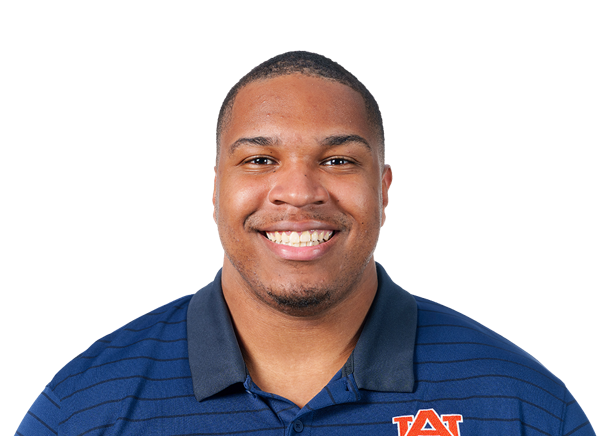
Jo Simmons
#56

Cole Skinner
#69
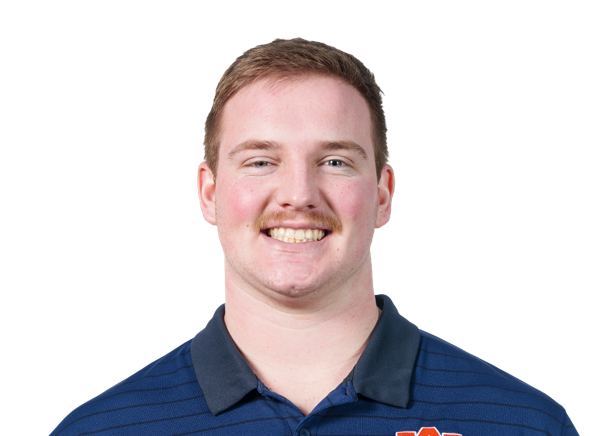
Jacob Strand
#74
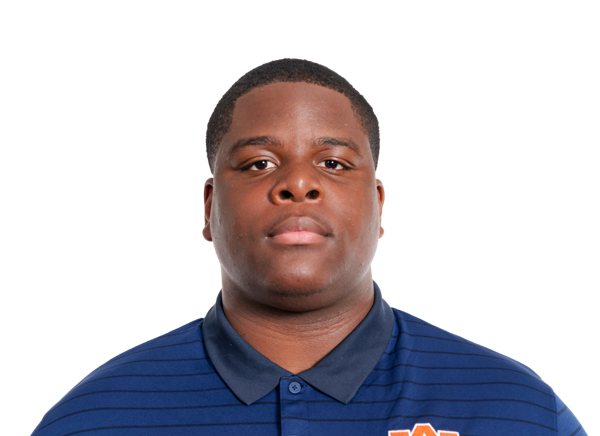
Jacobe' Ward
#77

Wilson Zierer
Receivers & Backs
#36
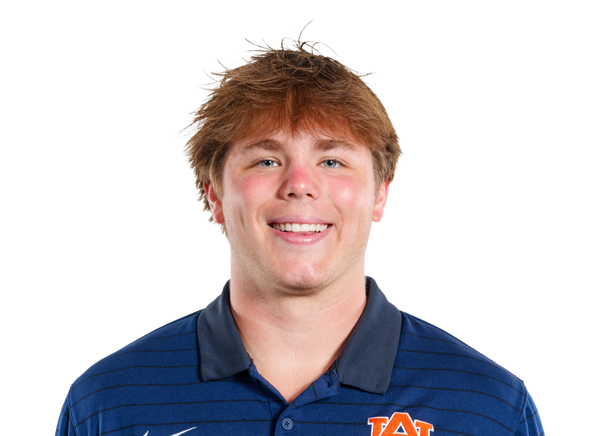
Stuart Andrews
#82

Arlis Boardingham
#87
DJ Broughton Jr.
#26

Christian Burnette
#6

Bryce Cain
#23

Jeremiah Cobb
#24
Nykahi Davenport
#1

Jonathan Echols
#86

Jack Ellenburg
#25

Cole Gamble
#84

Ryan Ghea
#22
Alvin Henderson
#85

Hunter Herring
#19
Jake Johnson
#4
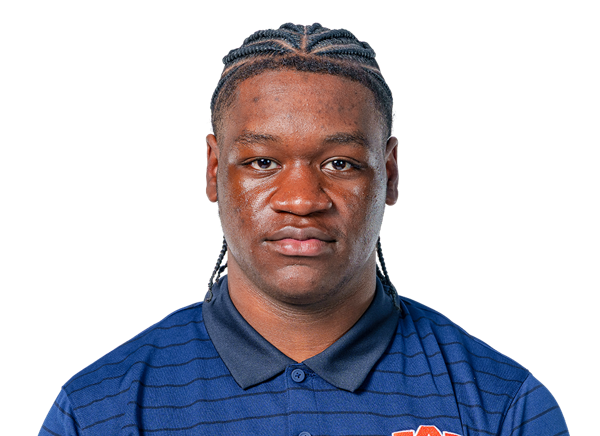
Jeremiah Koger
#29
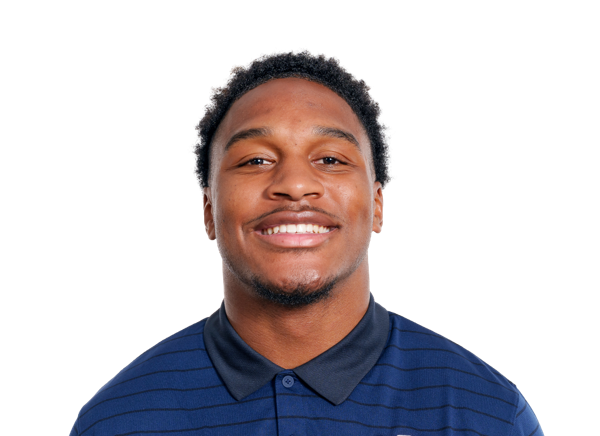
Omar Mabson II
#12
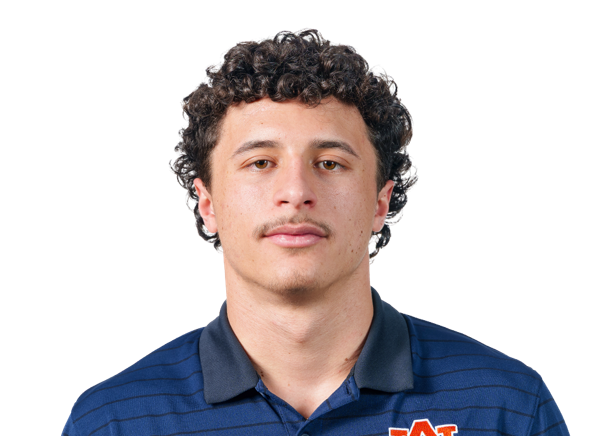
Brady Marchese
#21

Tae Meadows
#8

Christian Neptune
#83
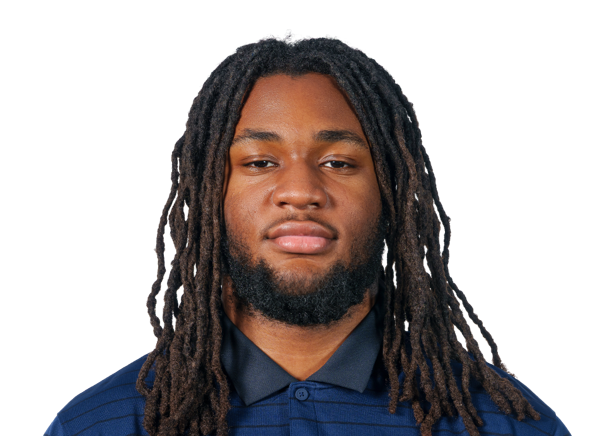
Xavier Newsom
#5
Chas Nimrod
#40
Hunter Ousley
#13
Kory Pettigrew
#11
Keshaun Singleton
#9
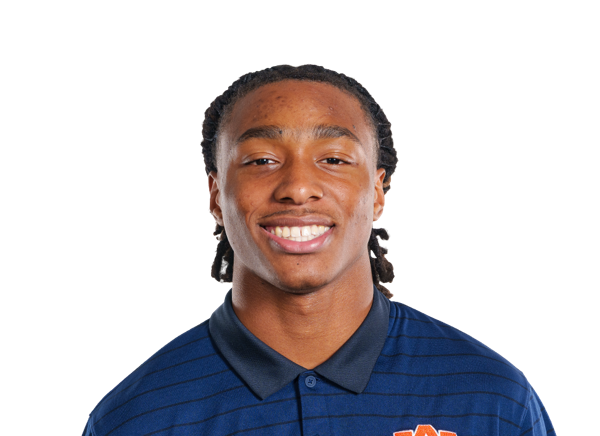
DeShawn Spencer
#18
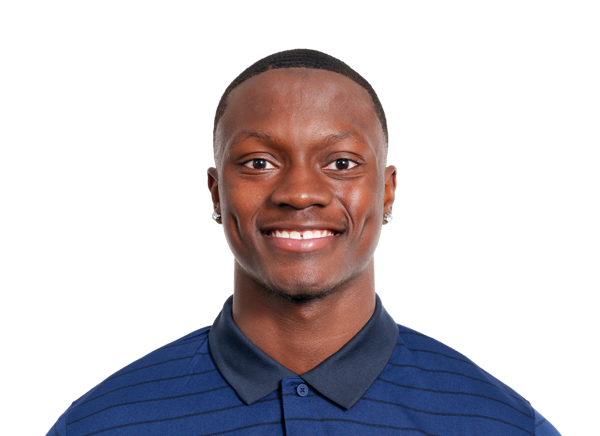
Sam Turner
#80
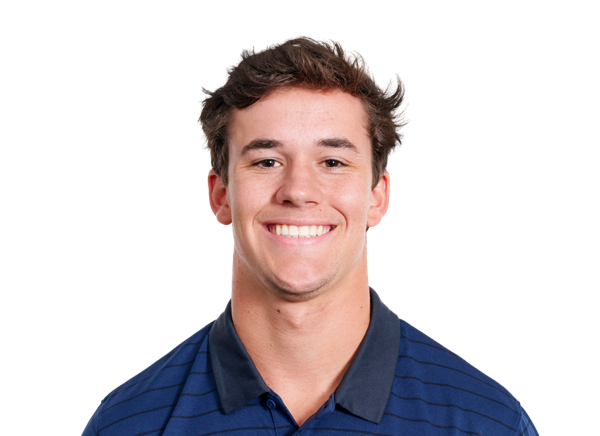
Will Upton
#30

Bryson Washington
#89
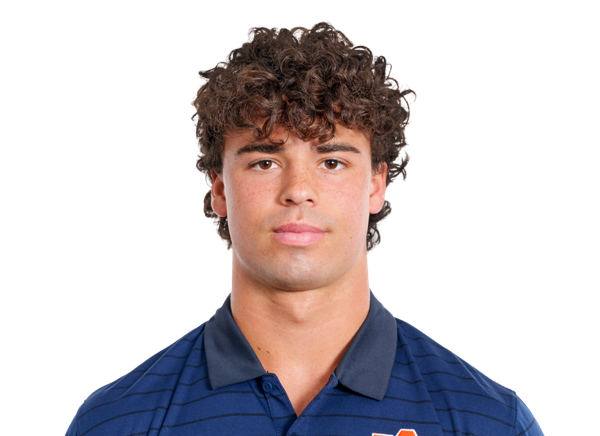
Jake White
#15
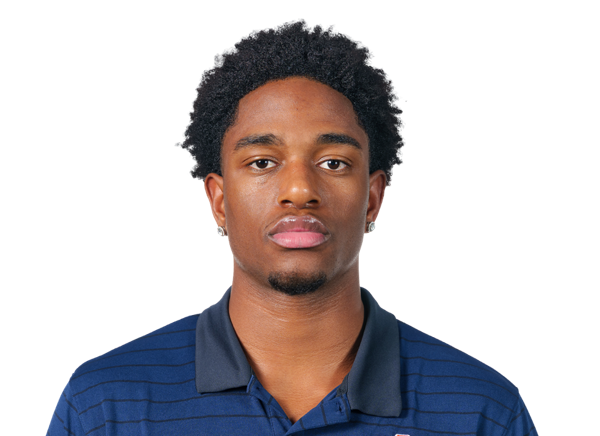
Brian Williams Jr.
Defensive Line & Linebackers
#17
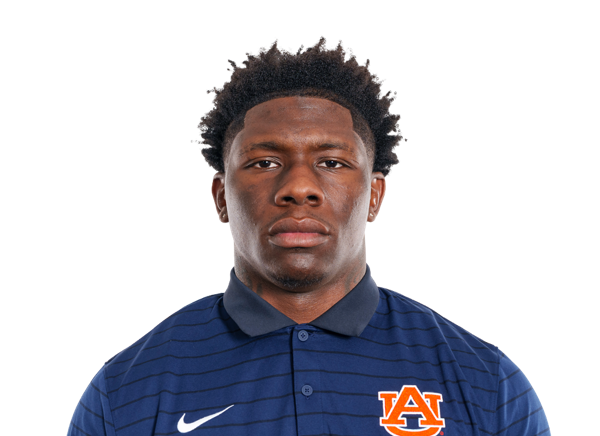
Xavier Atkins
#96
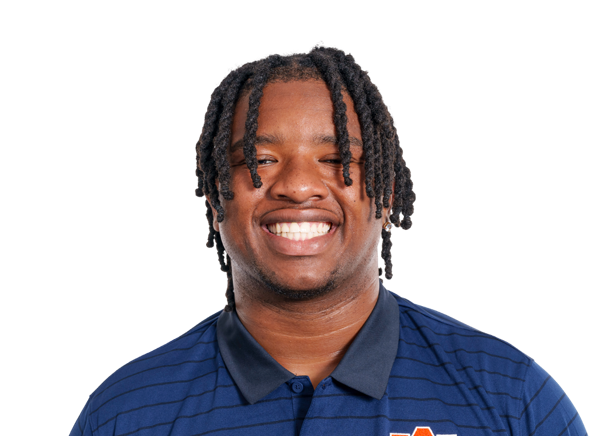
Malik Autry
#44
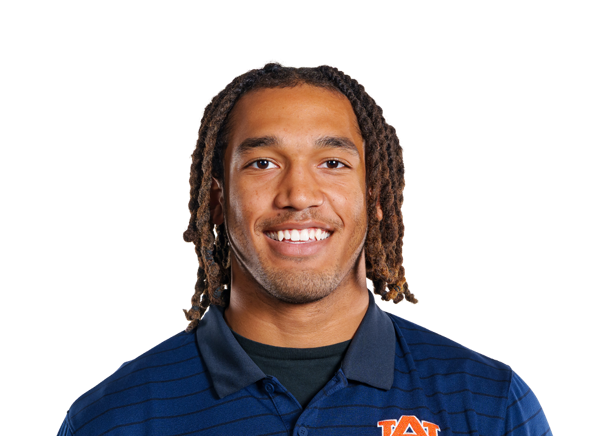
Adam Balogoun-Ali
#91
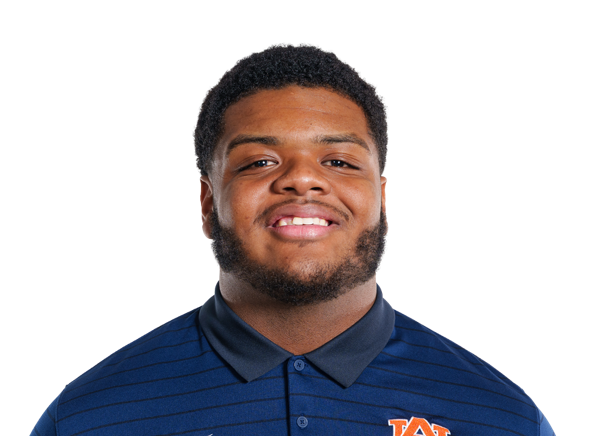
Tavian Branch
#95
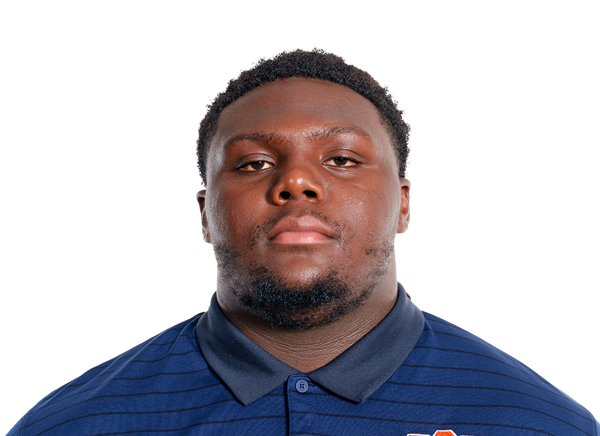
Jourdin Crawford
#16
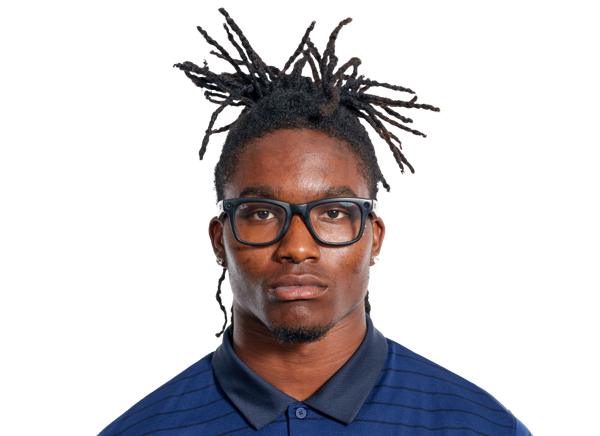
Bryce Deas
#99

Saint Farrior
#42

Coleman Granberry
#10
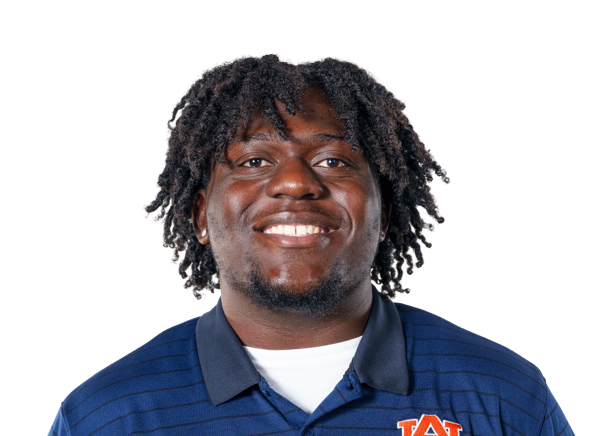
Walter Mathis Jr.
#51
Michael Matthews-Canty
#52
William Grier McDuffie
#45
Antonio Melendez
#9
Elijah Melendez
#13

Chris Murray
#6
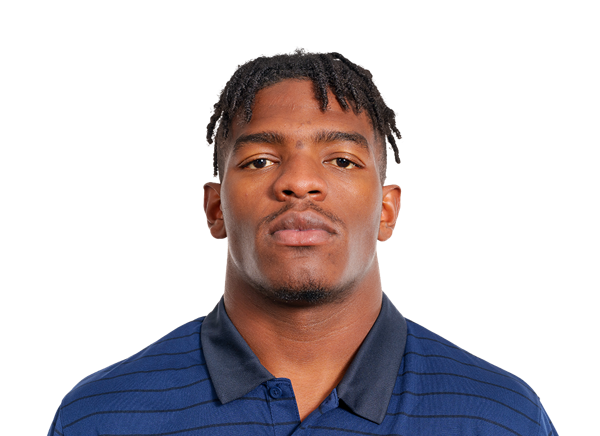
De'Marcus Riddick
#94
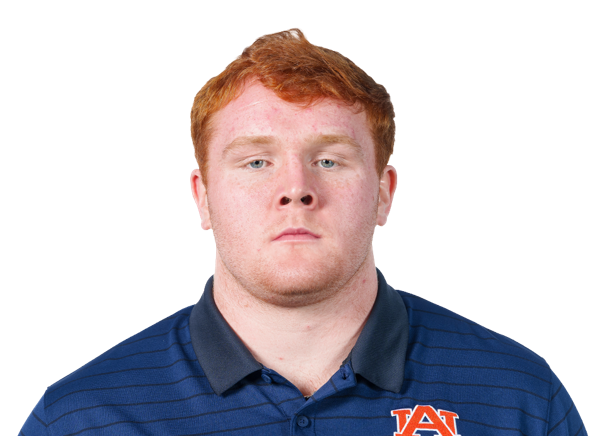
Cody Sigler
#11
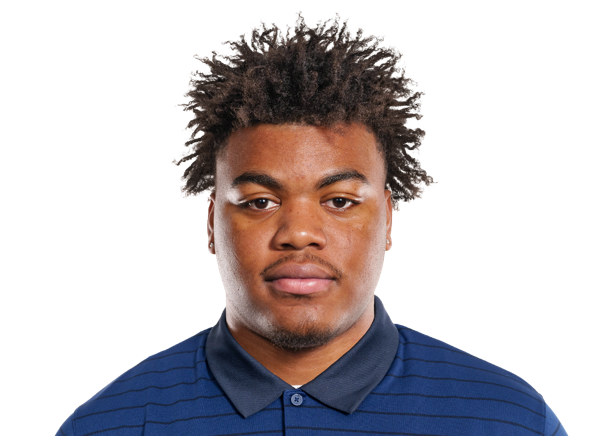
Darrion Smith
#24
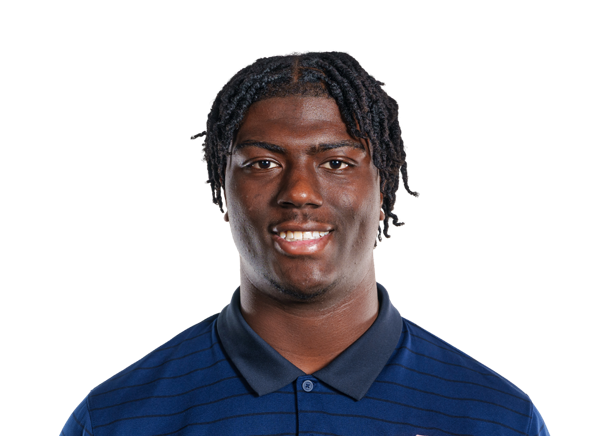
Shadarius Toodle
#35
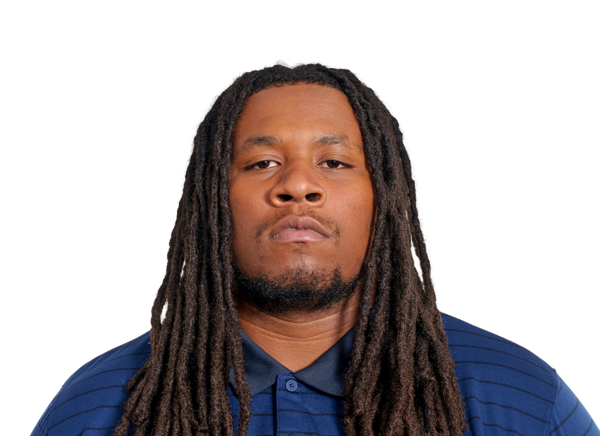
Dallas Walker IV
#40
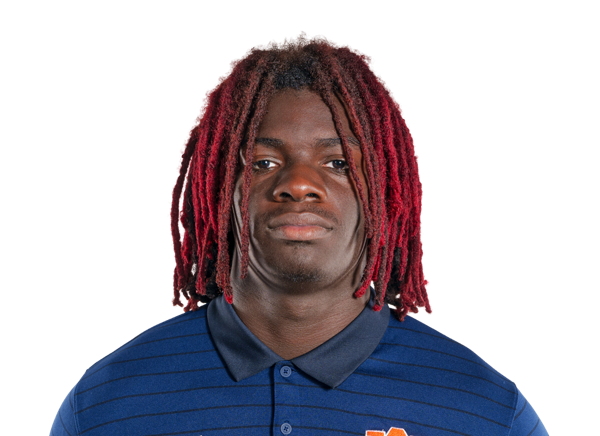
Chris Wells
#98
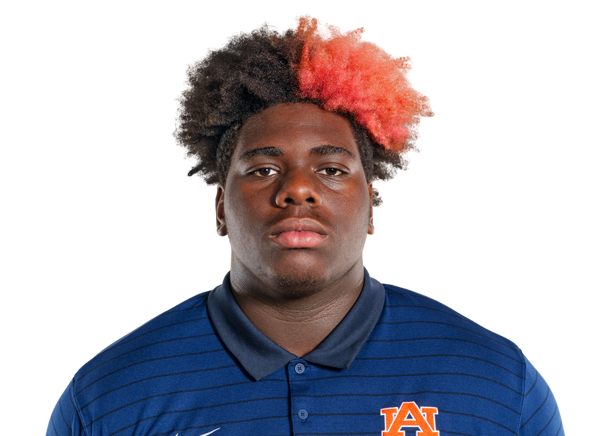
Corey Wells
Defensive Backs
#1

Champ Anthony
#14
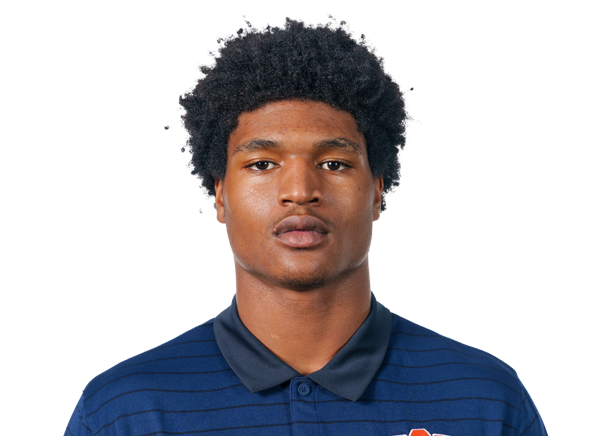
Shamar Arnoux
#32
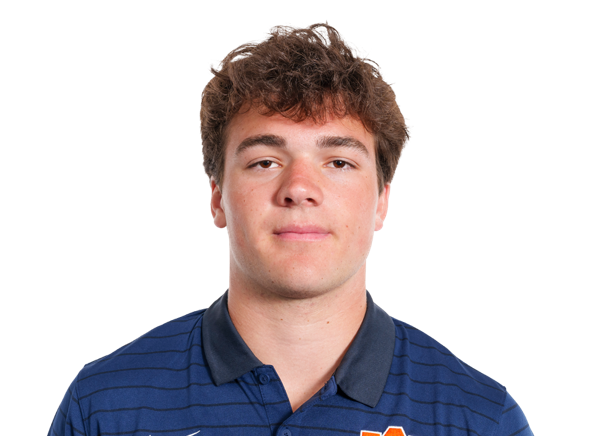
Cade Carlson
#3

AnQuon Fegans
#48

Peyton Floyd
#23
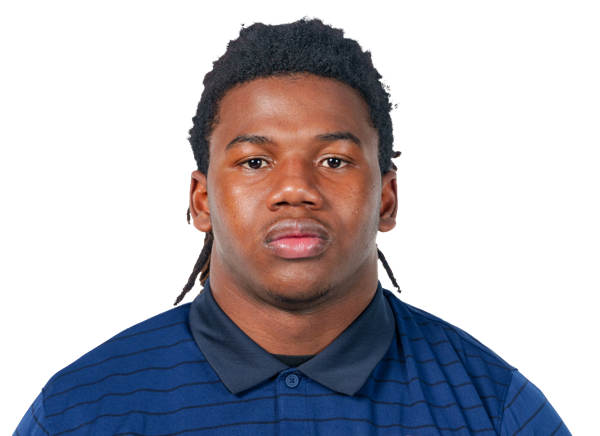
Fred Gaskin III
#8
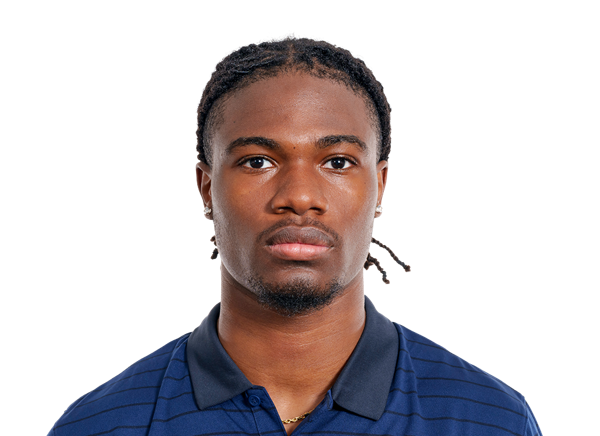
Kaleb Harris
#26
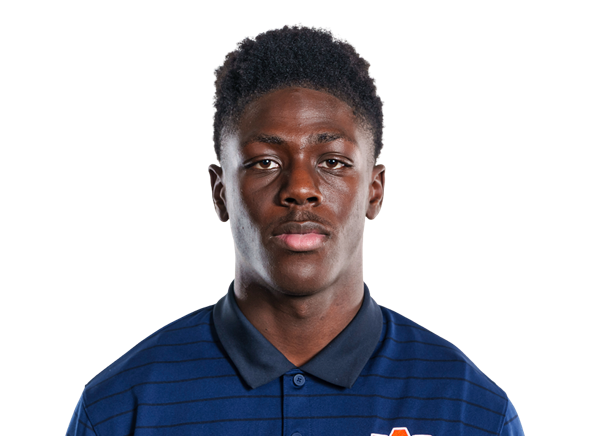
Wayne Henry
#21
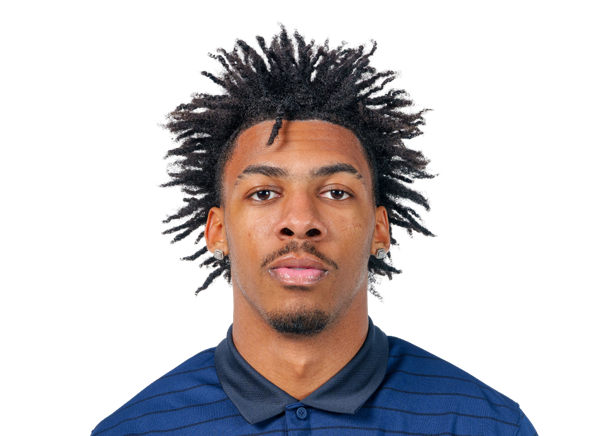
Gavin Jenkins
#22
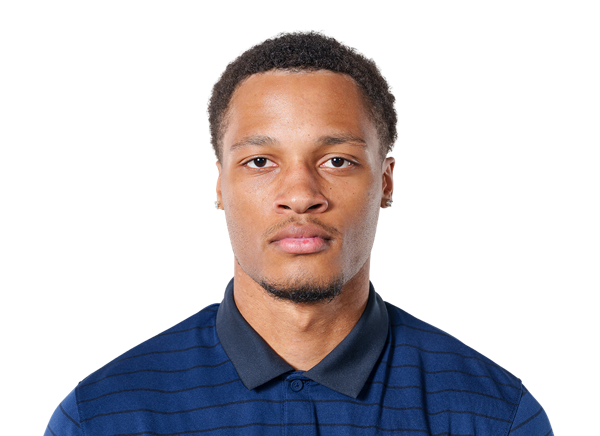
Andre Jordan Jr.
#20
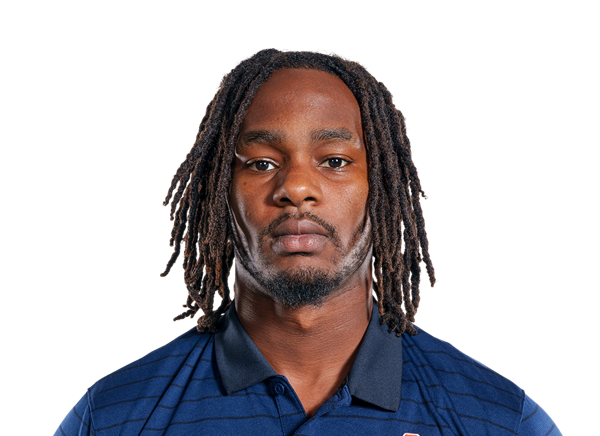
Jacoby Mathews
#4
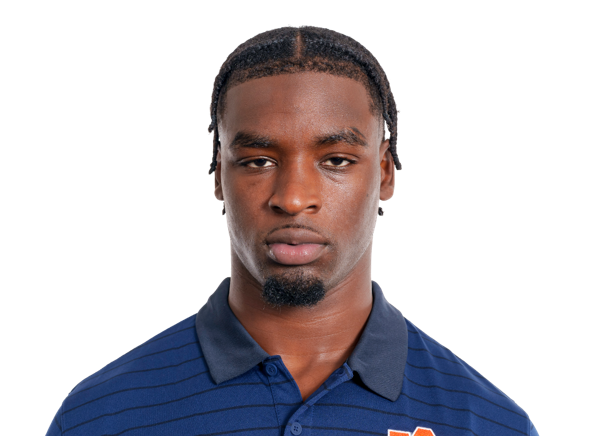
Rayshawn Pleasant
#46
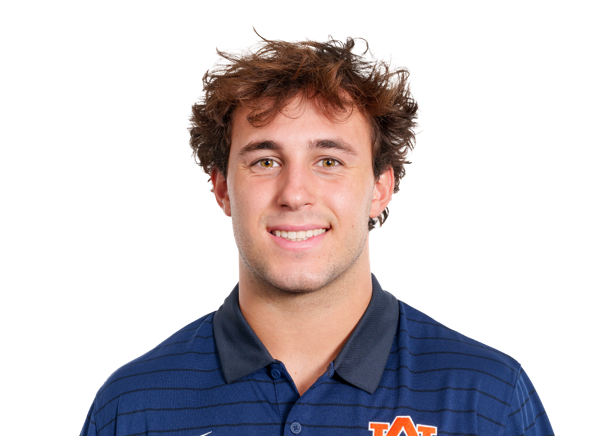
Grey Reebals
#19
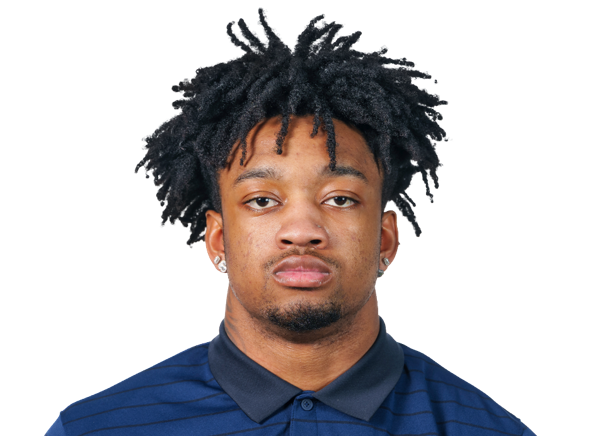
Scrap Richardson
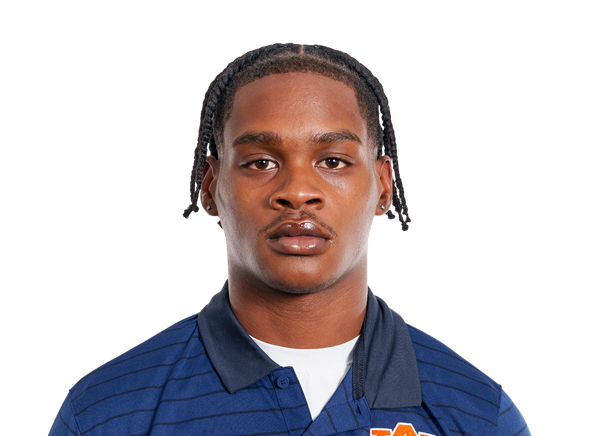
Sylvester Smith-Reed
#25

Damonte Tabb
#33
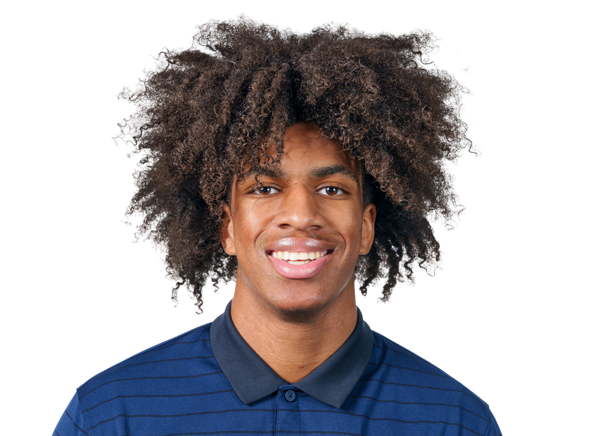
Kamari Todd
#28
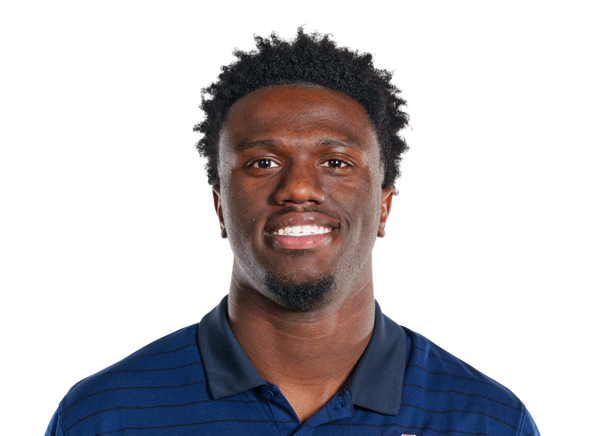
Shadrick Toodle Jr.
#27
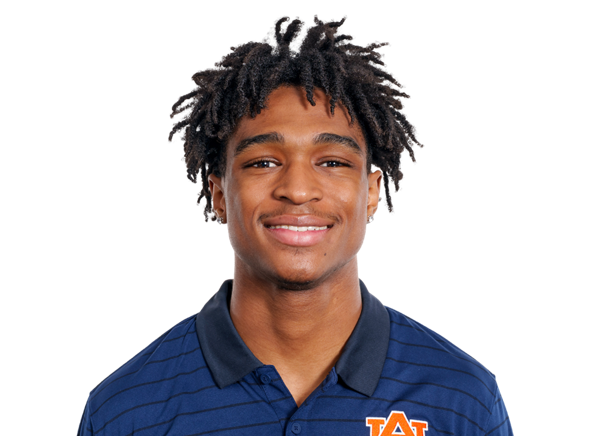
Devin Williams
#5
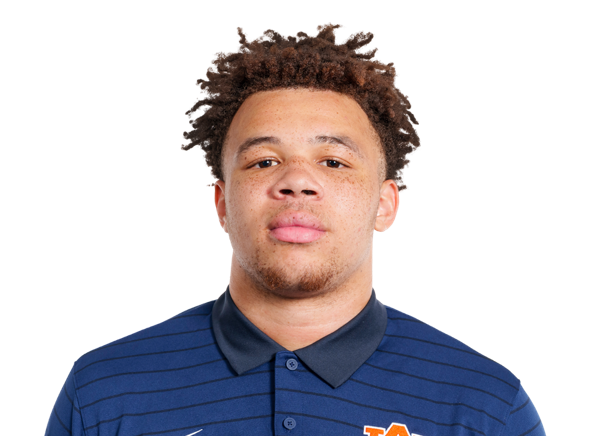
Eric Winters
#12
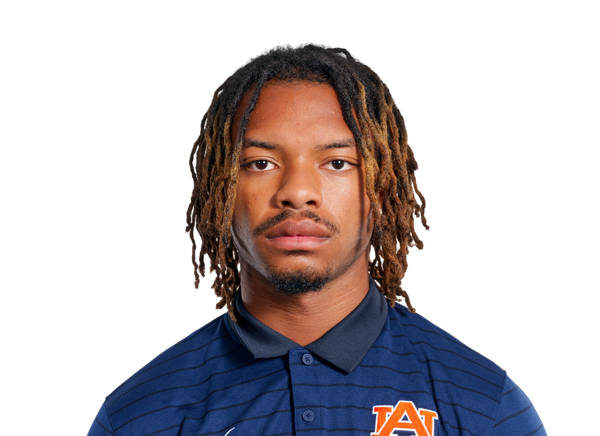
Blake Woodby
Other
#18

J.J. Faulk
#41
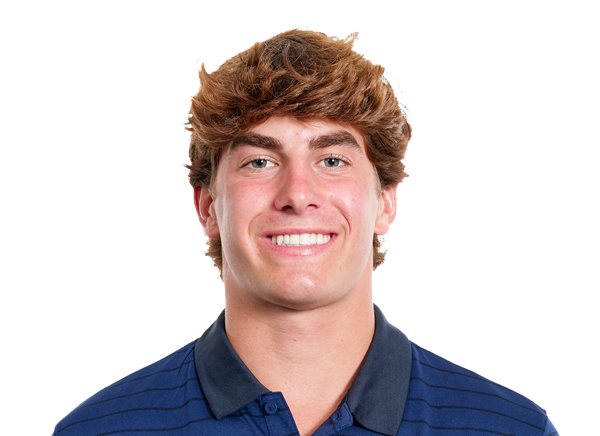
Connor Gibbs
#90
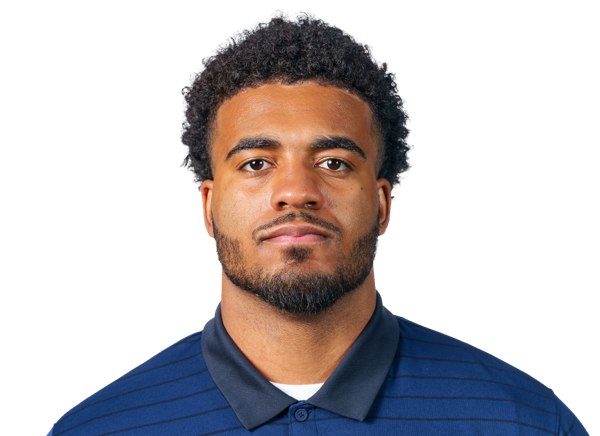
Nate Johnson
#38

Alex McPherson
#31

Joe Phillips
#93

Charley Schwinger
#41

Jared Smith
#29

Jaquez Wilkes
#15
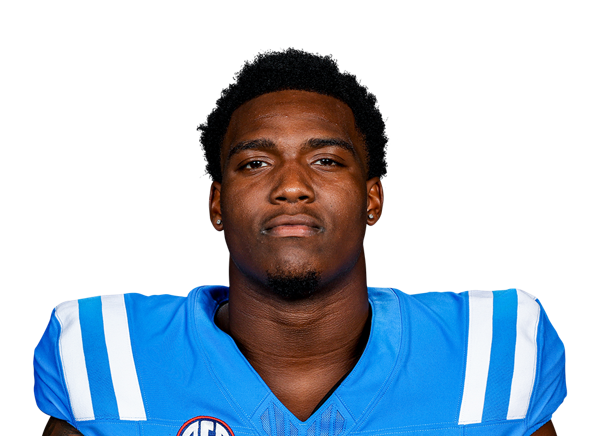
Da'Shawn Womack
No roster data
Auburn
6th in SEC
VS
Home
Passing
64.9
Completion Percentage
—
85
Completions
—
3.80
Interception Percentage
—
5
Interceptions
—
48
Longest Pass
—
940
Net Passing Yards
—
235.0
Net Passing Yards Per Game
—
131
Passing Attempts
—
5.30
Passing Touchdown %
—
7
Passing Touchdowns
—
135.4
Passer Rating
—
14
Total Sacks
—
62
Sack Yards Lost
—
7.2
Yards Per Pass Attempt
—
940
Passing Yards
—
0
Passing Fumbles Lost
—
4
Team Games Played
—
413.5
Yards Per Game
—
30.0
Total Points Per Game
—
120
Total Points
—
15
Total Touchdowns
—
235.0
Passing Yards Per Game
—
85-131
Comp-Att
—
14-62
Sacks-Yards Lost
—
Rushing
154
Rushing Attempts
—
714
Rushing Yards
—
4.6
Yards Per Rush Attempt
—
39
Long Rushing
—
0
20+ Yard Rushing Plays
—
6
Rushing Touchdowns
—
178.5
Rushing Yards Per Game
—
0
Rushing Fumbles
—
0
Rushing Fumbles Lost
—
41
Rushing 1st downs
—
4
Team Games Played
—
1,654
Total Yards
—
299
Total Offensive Plays
—
30.0
Total Points Per Game
—
120
Total Points
—
15
Total Touchdowns
—
Receiving
85
Receptions
—
0
Receiving Targets
—
940
Receiving Yards
—
940
Receiving Yards
—
7
Receiving Touchdowns
—
48
Long Reception
—
0
20+ Yard Receiving Plays
—
235.0
Receiving Yards Per Game
—
0
Receiving Fumbles
—
0
Receiving Fumbles Lost
—
360
Receiving Yards After Catch
—
45
Receiving First Downs
—
4
Team Games Played
—
11.1
Yards Per Reception
—
30.0
Total Points Per Game
—
120
Total Points
—
15
Total Touchdowns
—
Miscellaneous
92
Total 1st downs
—
41
Rushing 1st downs
—
45
Passing 1st downs
—
6
1st downs by penalty
—
30
Third Down Conversions
—
61
Third Down Attempts
—
49.18
3rd down %
—
5
Fourth Down Conversions
—
8
First Downs Attempts
—
62.50
4th down %
—
27
Total Penalties
—
229
Total Penalty Yards
—
6133
Possession Time Seconds
—
0.00
Red Zone Field Goal Percentage
—
0.00
Red Zone Scoring Percentage
—
0.00
Red Zone Efficiency Percentage
—
0.00
Red Zone Touchdown Percentage
—
7
Total Takeaways
—
6
Total Giveaways
—
1
Turnover Ratio
—
0
Fumbles Lost
—
30-61
3rd down efficiency
—
5-8
4th down efficiency
—
27-229
Total-Yards
—
Defense
188
Solo Tackles
—
68
Assist Tackles
—
256
Total Tackles
—
11
Sacks
—
55
Sack Yards
—
39
Stuffs
—
0
Passes Defended
—
8.6
Average Interception Yards
—
29
Long Interception
—
0
Miscellaneous Touchdowns
—
2
Kicks Blocked
—
25
Tackles For Loss
—
4
Team Games Played
—
Defensive Interceptions
5
Interceptions
—
43
Interception Yards
—
1
Interception Touchdowns
—
5-43
INT: Total
—
General
3
Fumbles
—
1
Forced Fumbles
—
2
Fumbles Recovered
—
0
Fumbles Touchdowns
—
4
Games Played
—
3-0
Fumbles-Lost
—
Returning
5
Kick Returns
—
111
Kick Return Yards
—
22.2
Yards Per Kick Return
—
31
Long Kick Return
—
0
Kick Return Touchdowns
—
6
Punt Returns
—
41
Punt Return Yards
—
6.8
Yards Per Punt Return
—
38
Long Punt Return
—
1
Punt Return Touchdowns
—
0
Punt Return Fair Catches
—
0
Kick Return Fumbles Lost
—
0
Punt Return Fumbles Lost
—
4
Team Games Played
—
6-41
Punt: Total
—
Kicking
4
Field Goal Made
—
6
Field Goal Attempts
—
66.7
Field Goal Percentage
—
55
Long Field Goal Made
—
0
Field Goal Attempts 1-19
—
0
Field Goal Attempts 20-29
—
0
Field Goal Attempts 30-39
—
4
Field Goal Attempts 40-49
—
2
Field Goal Attempts 50+
—
14
Extra Points Made
—
14
Extra Point Attempts
—
100.0
Extra Point Percentage
—
0
Field Goals Made 1-19
—
0
Field Goals Made 20-29
—
0
Field Goals Made 30-39
—
3
Field Goals Made 40-49
—
1
Field Goals Made 50+
—
26
Total Kicking Points
—
4
Team Games Played
—
100
Touchback Percentage
—
0.0
Average Kickoff Return Yards
—
0
Kickoff Return Yards
—
0
Kickoff Returns
—
0-0
Kickoffs: Total
—
4-6
FG: Good-Attempts
—
Punting
13
Punts
—
519
Punt Yards
—
49
Long Punt
—
39.9
Gross Average Punt Yards
—
39.9
Net Average Punt Yards
—
0
Punts Blocked
—
6
Punts Inside 20
—
0
Touchbacks
—
6
Fair Catches
—
2
Punt Returns
—
0
Punt Return Yards
—
0.0
Average Punt Return Yards
—
4
Team Games Played
—
13-519
Punt: Total Yards
—
Scoring
6
Rushing Touchdowns
—
7
Receiving Touchdowns
—
1
Return Touchdowns
—
14
Total Touchdowns
—
4
Field Goals
—
14
Kick Extra Points
—
1
Total Two Point Conversions
—
120
Total Points
—
30.0
Total Points Per Game
—