

Auburn vs TBD Live Score (23 Dec, 2026)
Game Information
EventNew Orleans Bowl
StagePostseason Week 1
Season2026
KickoffWed, Dec 23, 2:00 pm
VenueCaesars Superdome
LocationNew Orleans, LA
SurfaceArtificial Turf
SiteNeutral Site
BroadcastESPN
Game Leaders
Player leaders are not available for this matchup yet.
Injury Report
No current injury report is available for this matchup.
Head-to-Head
Historical meetings are not available for this matchup.

Auburn
1st in SEC
VS
Home
Quarterbacks & Specialists
#39

Max Bourke
#17
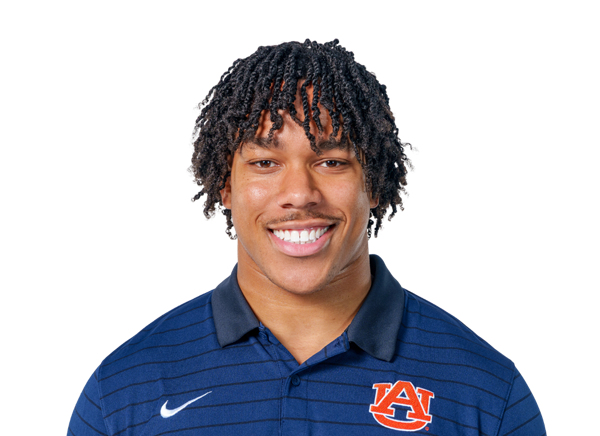
Byrum Brown
#19

Rhys Brush
#64

Benton Cantey
#16

John Colvin
#3
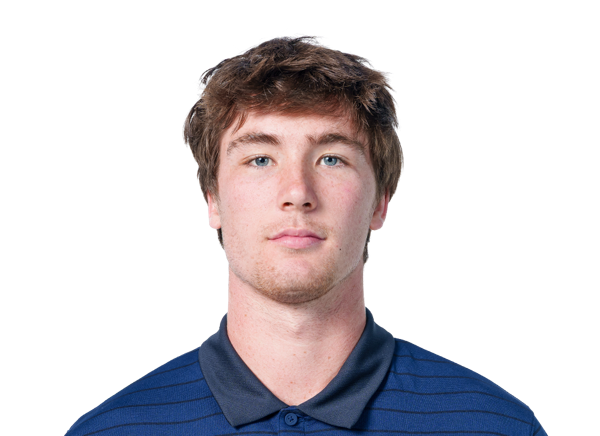
Locklan Hewlett
#14

Hudson Kaak
#37
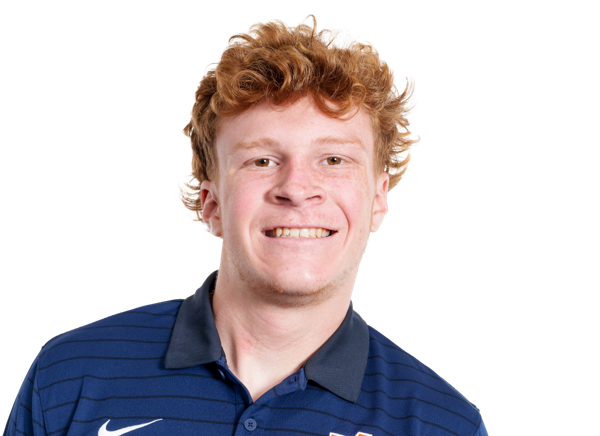
John McGuire
#11

Will Myers
#49

Hudson Powell
#10
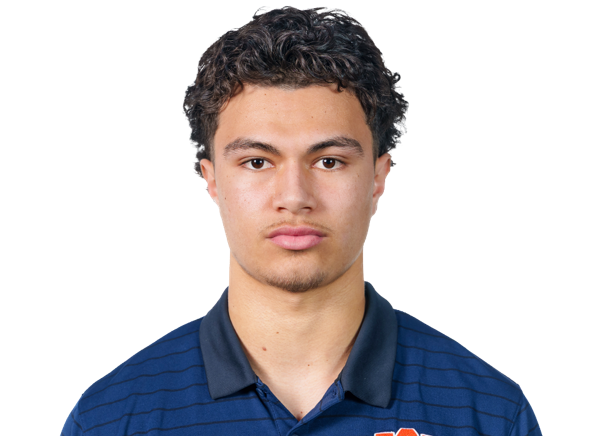
Tristan Ti'a
#47
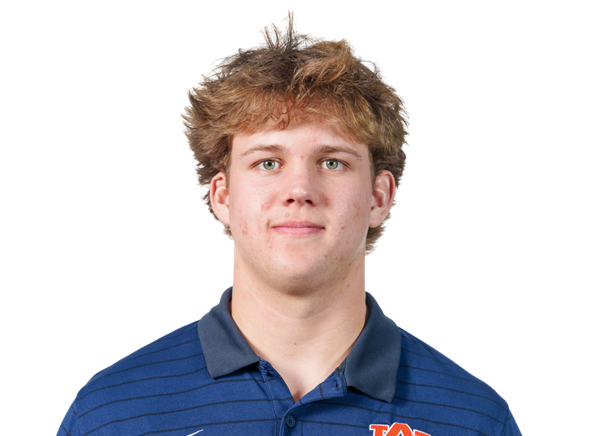
Travis Wakefield
Offensive Line
#60

Cade Barnett
#72

Cole Best
#71
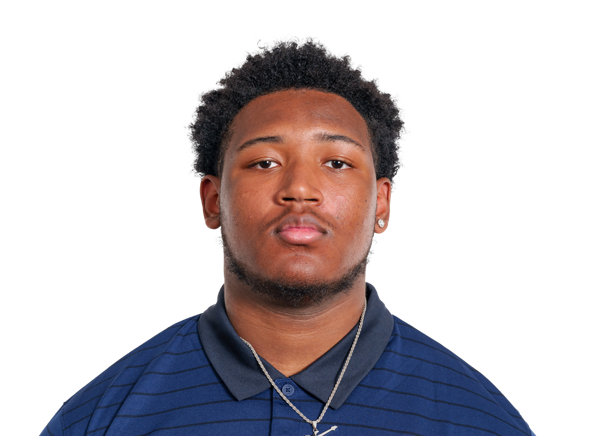
Tai Buster
#57
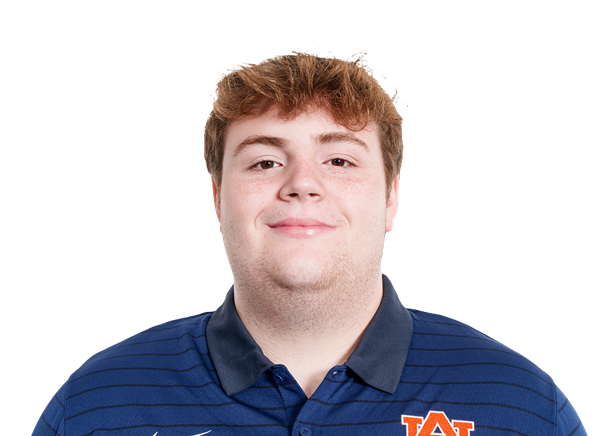
Harrison Clemmer
#51
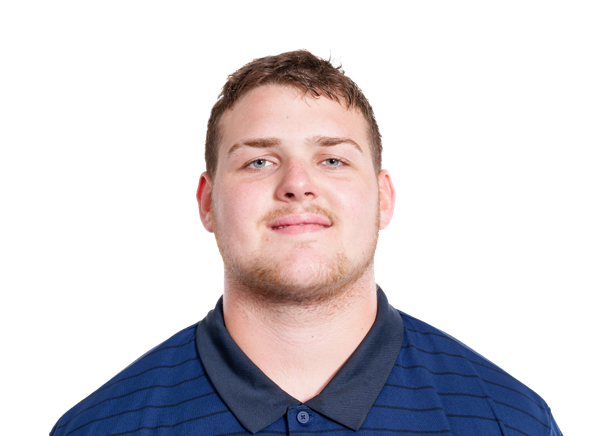
Kail Ellis
#58
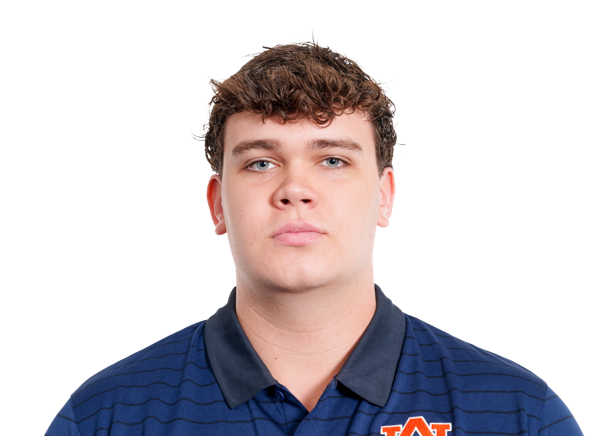
John Henry Flatt
#50
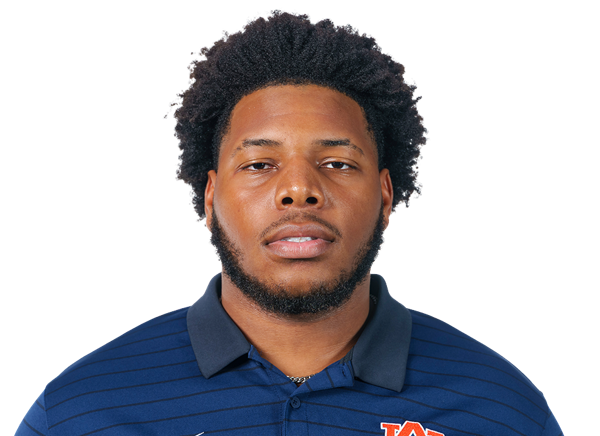
TJ Hedrick
#76
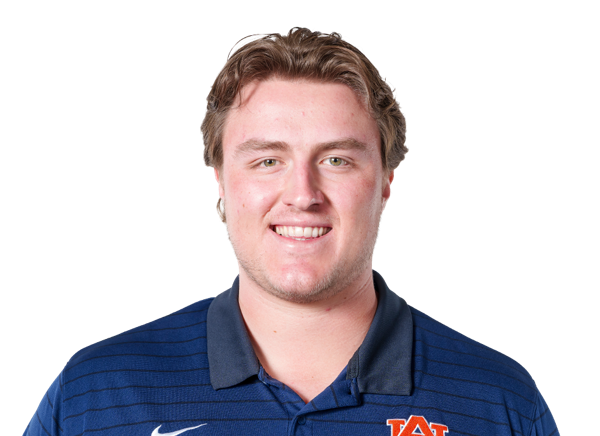
Jack Leyrer
#73
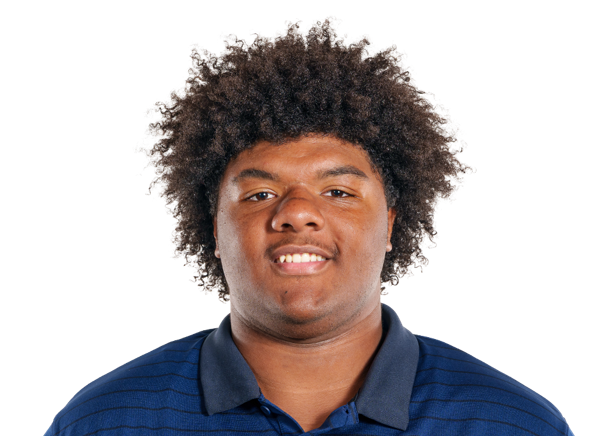
Mykall Lundy-Foster
#78
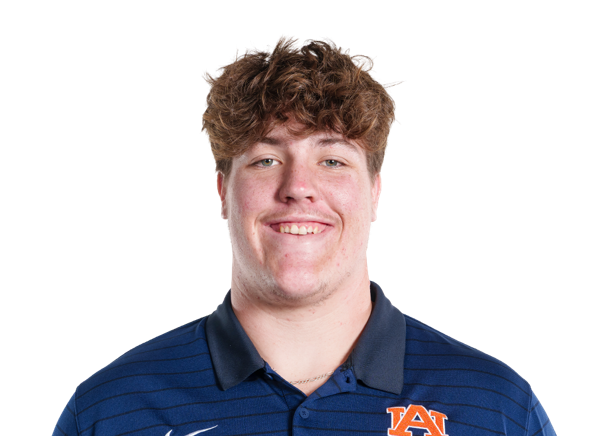
Mason Mathis
#55

Kenneth McManus IV
#75
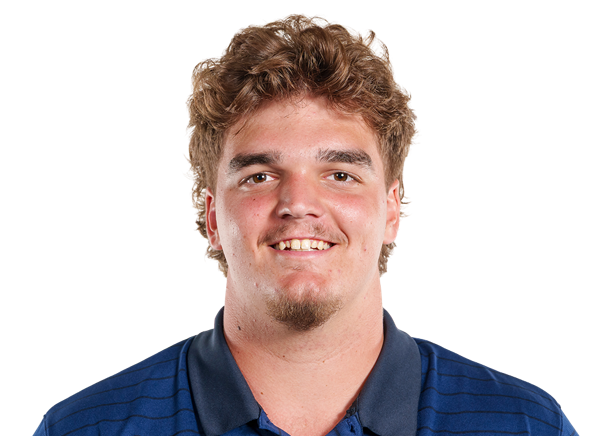
Bear McWhorter
#52
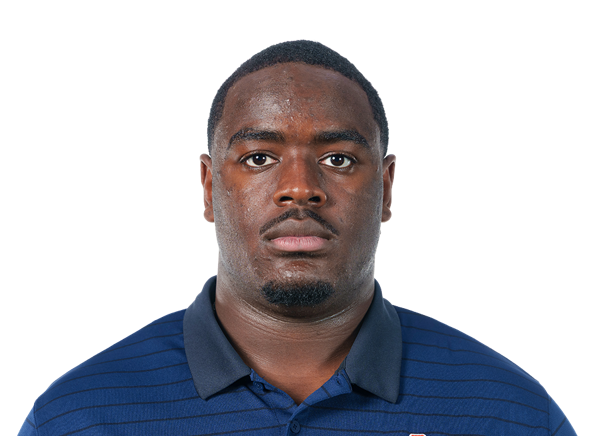
Deryc Plazz
#70
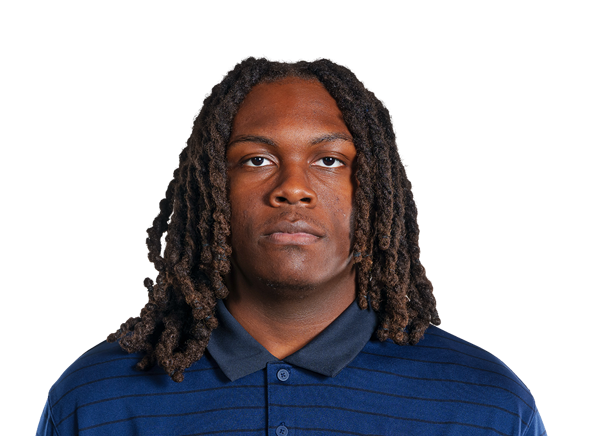
Parker Pritchett
#65
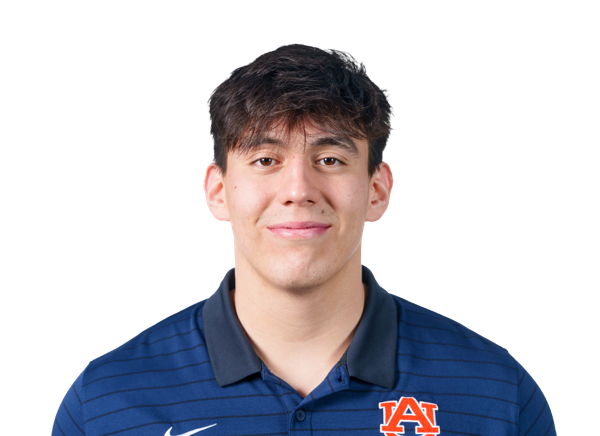
Stanton Ramil
#79
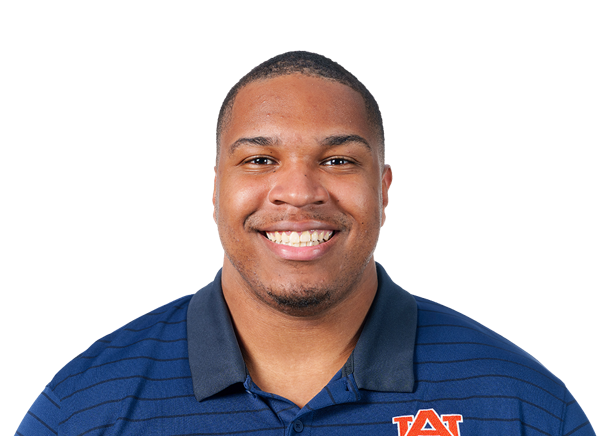
Jo Simmons
#56

Cole Skinner
#69
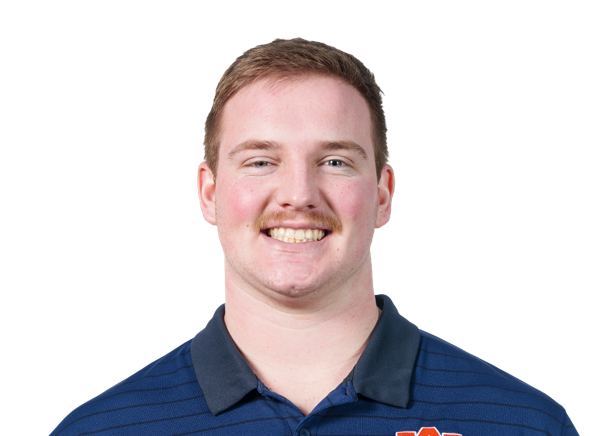
Jacob Strand
#74
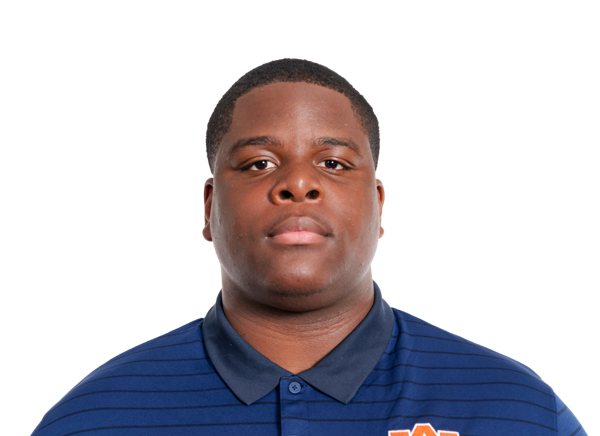
Jacobe' Ward
#77

Wilson Zierer
Receivers & Backs
#36
Stuart Andrews
#82

Arlis Boardingham
#87
DJ Broughton Jr.
#26

Christian Burnette
#6

Bryce Cain
#23

Jeremiah Cobb
#24
Nykahi Davenport
#1

Jonathan Echols
#86

Jack Ellenburg
#25
Cole Gamble
#84

Ryan Ghea
#22
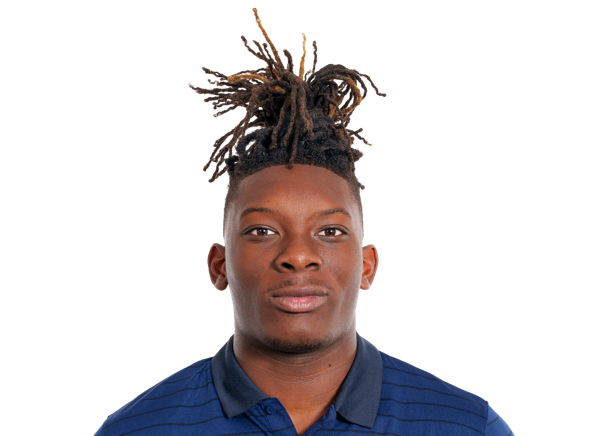
Alvin Henderson
#85

Hunter Herring
#19
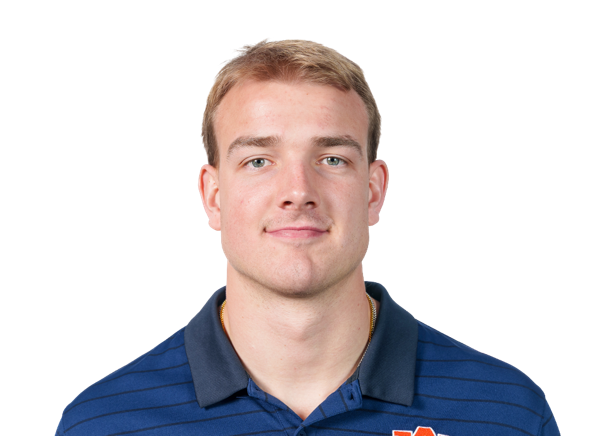
Jake Johnson
#4
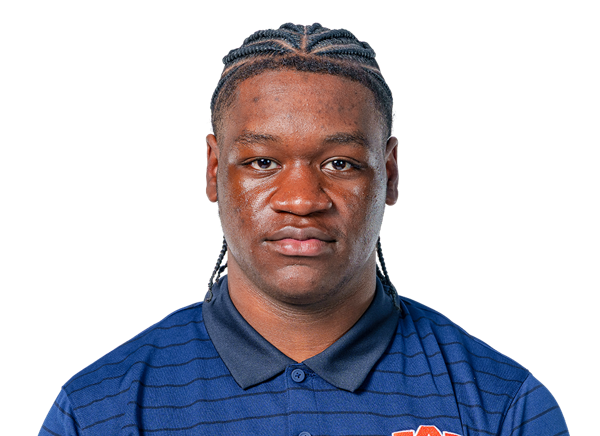
Jeremiah Koger
#29
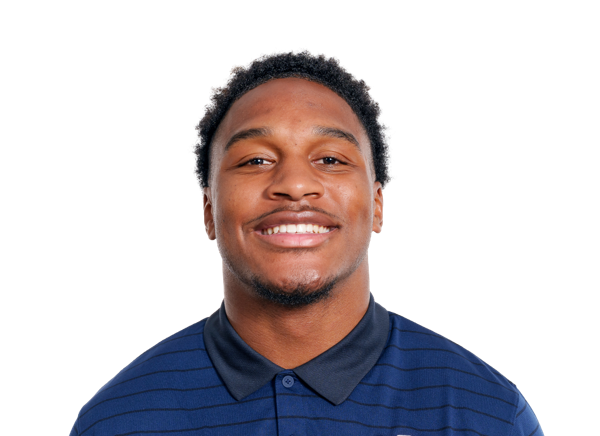
Omar Mabson II
#12
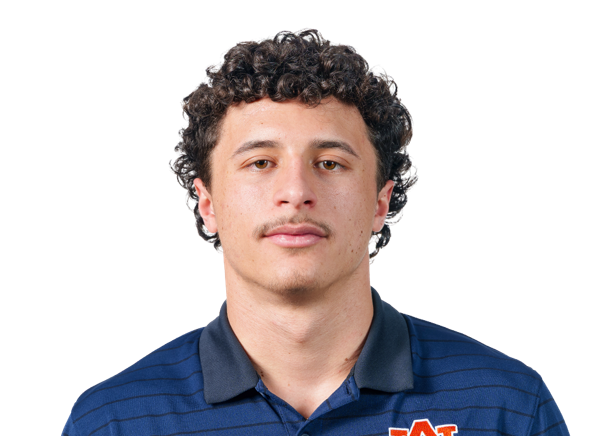
Brady Marchese
#21

Tae Meadows
#8

Christian Neptune
#83
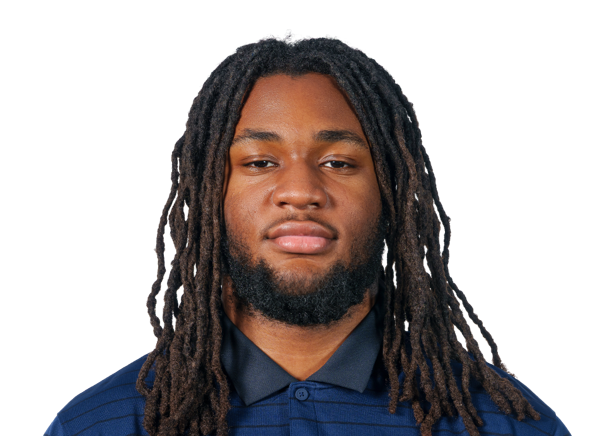
Xavier Newsom
#5
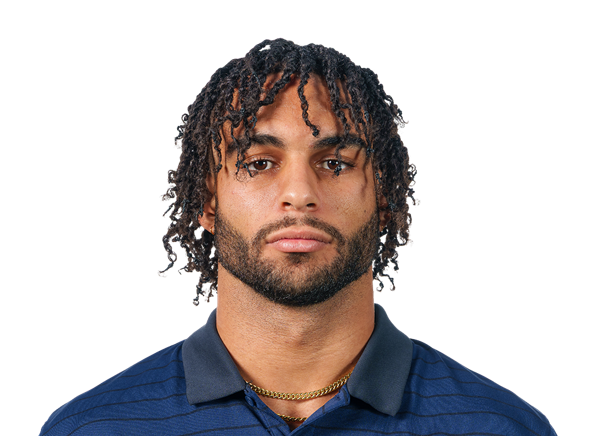
Chas Nimrod
#40
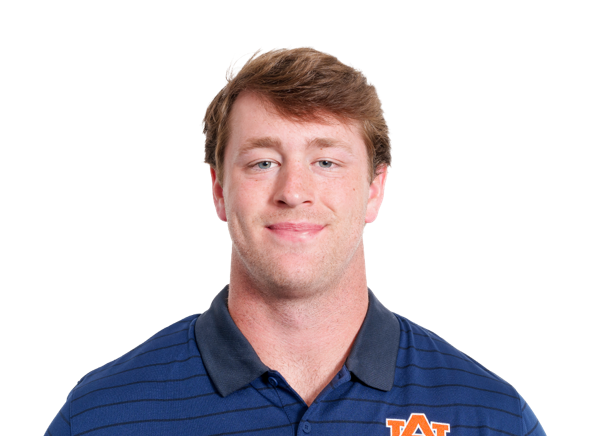
Hunter Ousley
#13
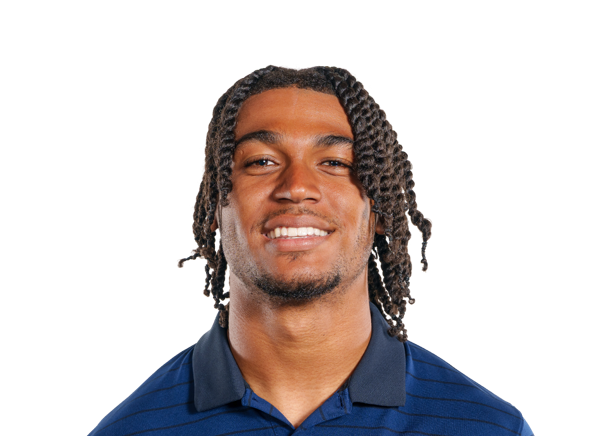
Kory Pettigrew
#11
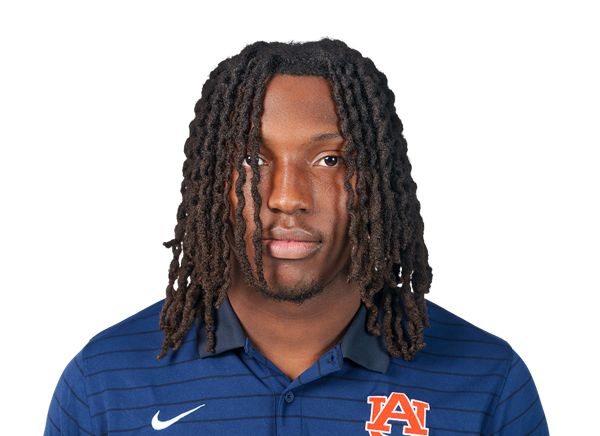
Keshaun Singleton
#81
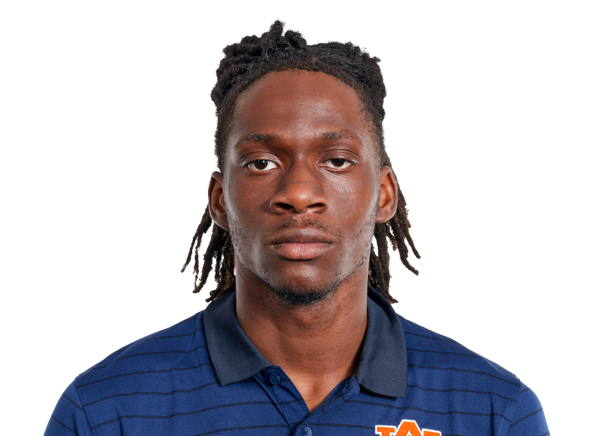
Erick Smith
#9
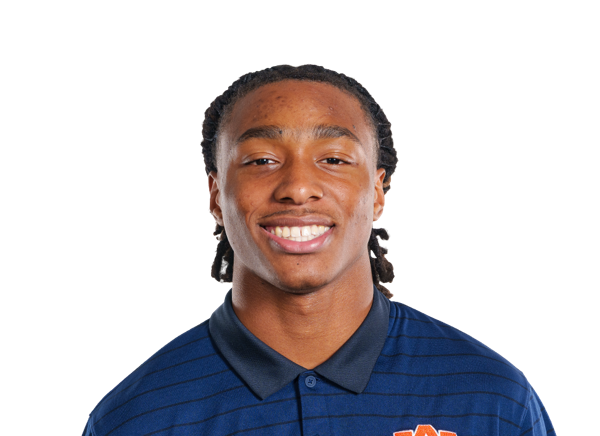
DeShawn Spencer
#18
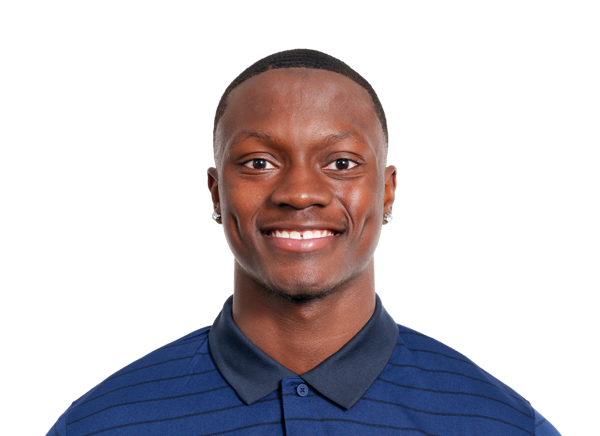
Sam Turner
#80
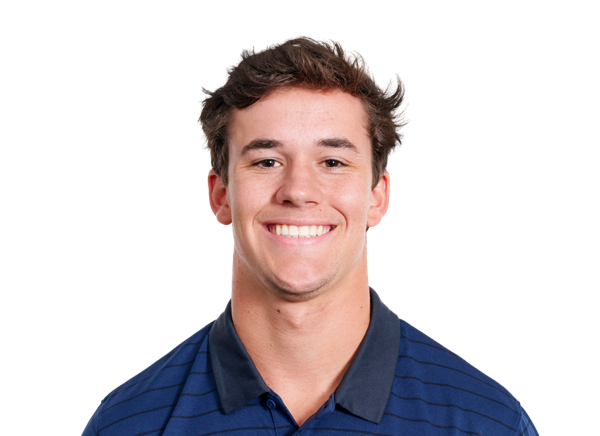
Will Upton
#30

Bryson Washington
#89
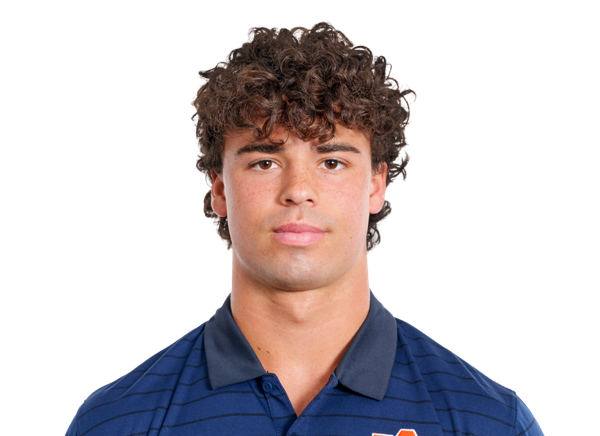
Jake White
#15
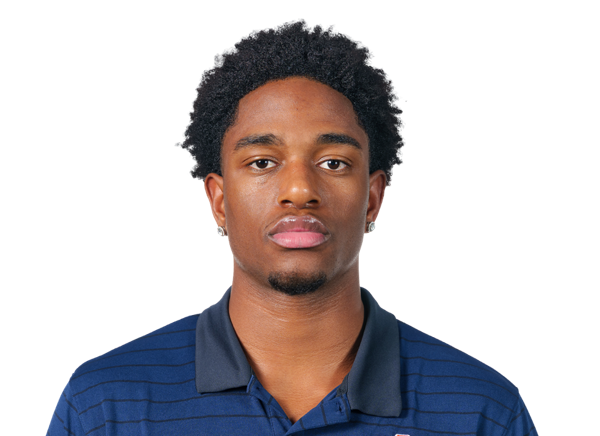
Brian Williams Jr.
Defensive Line & Linebackers
#17
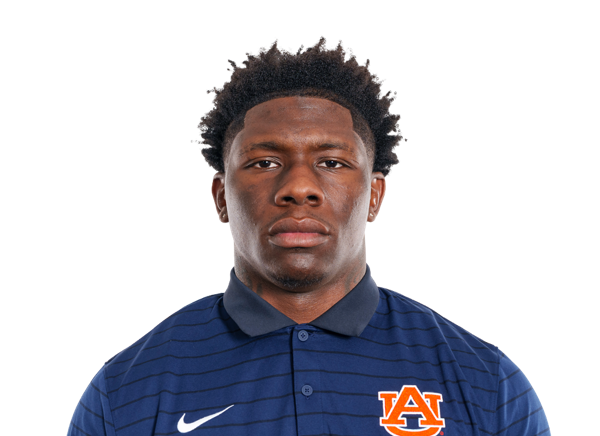
Xavier Atkins
#96
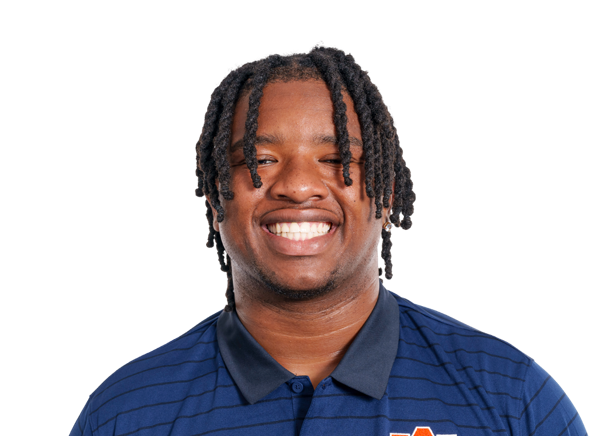
Malik Autry
#44
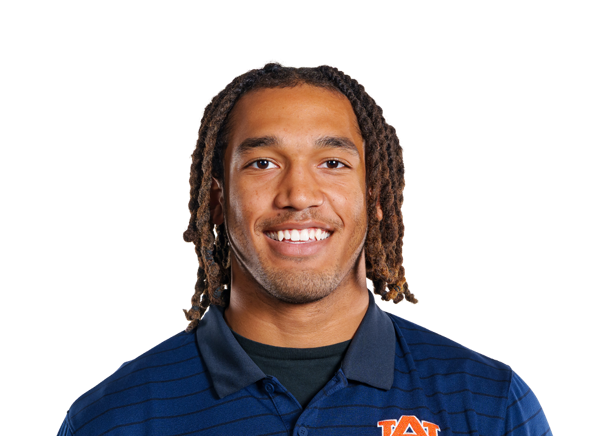
Adam Balogoun-Ali
#91
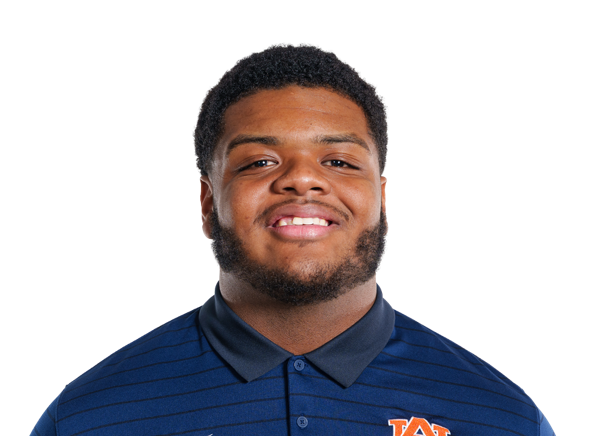
Tavian Branch
#95
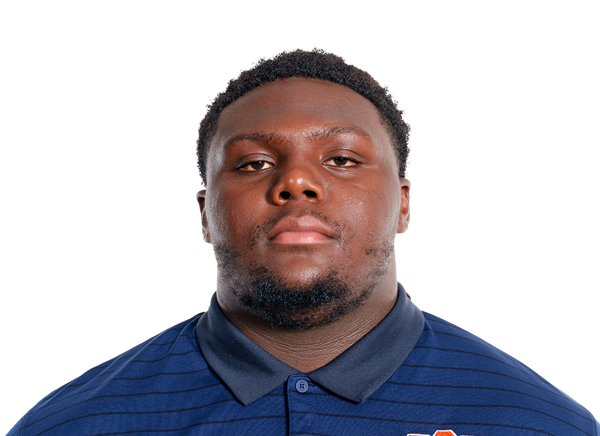
Jourdin Crawford
#16
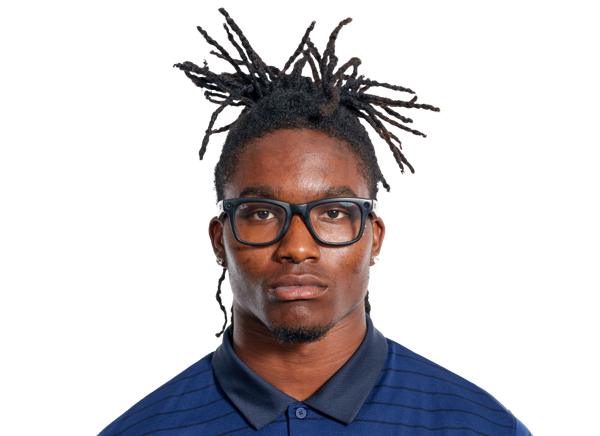
Bryce Deas
#99

Saint Farrior
#42

Coleman Granberry
#10
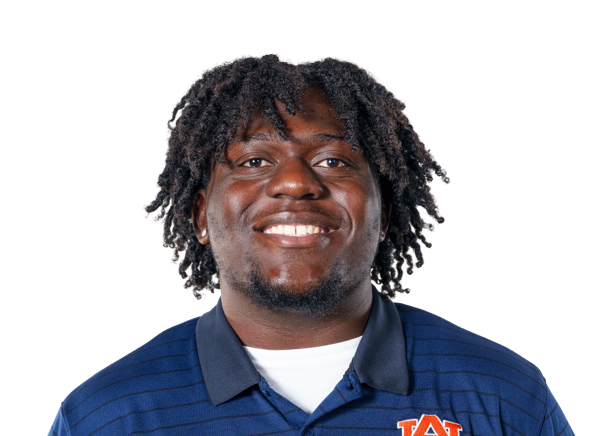
Walter Mathis Jr.
#51
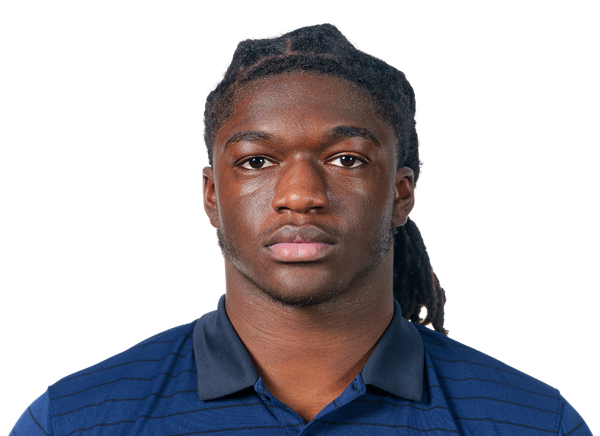
Michael Matthews-Canty
#52
William Grier McDuffie
#45
Antonio Melendez
#9
Elijah Melendez
#13

Chris Murray
#6
De'marcus Riddick
#94
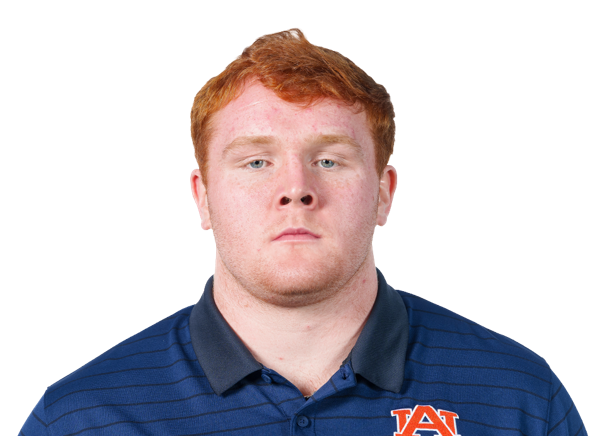
Cody Sigler
#11
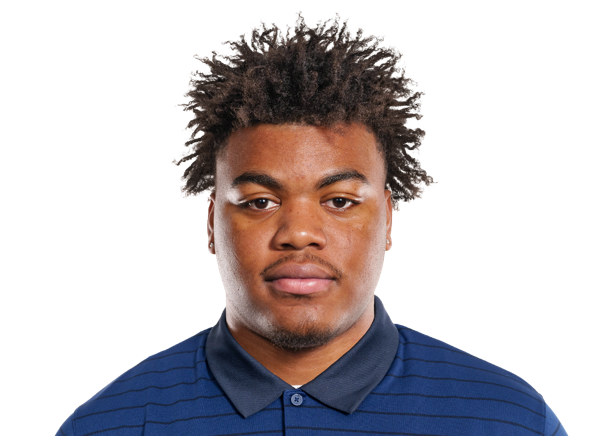
Darrion Smith
#24
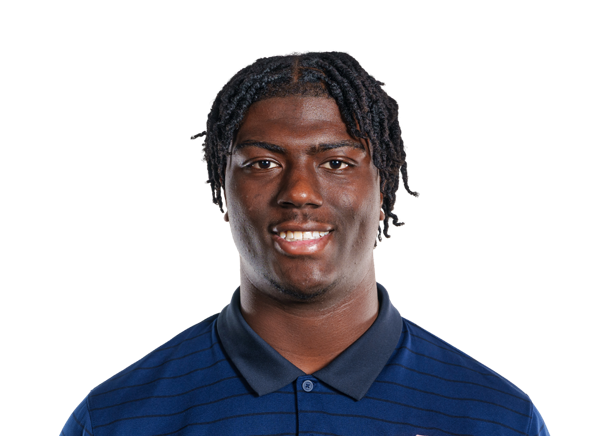
Shadarius Toodle
#35
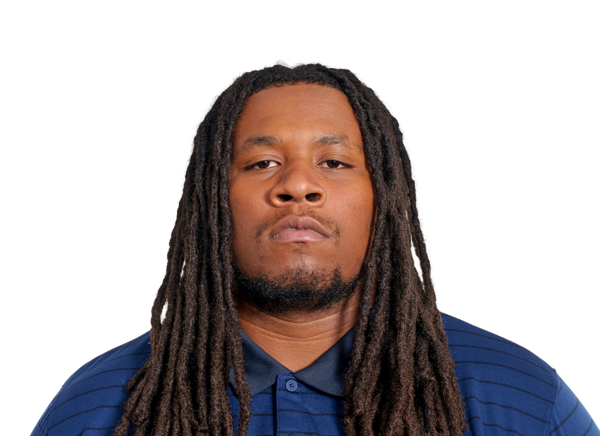
Dallas Walker IV
#40
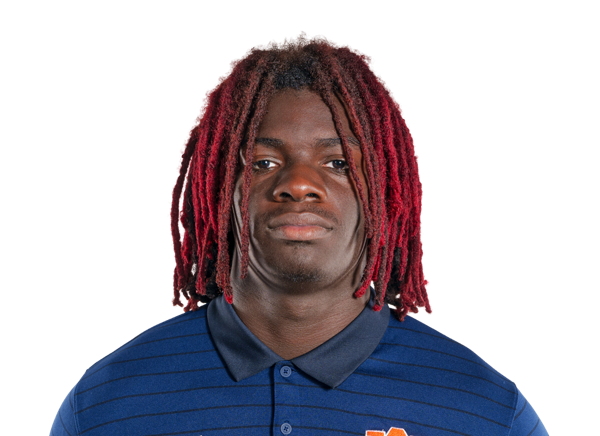
Chris Wells
#98
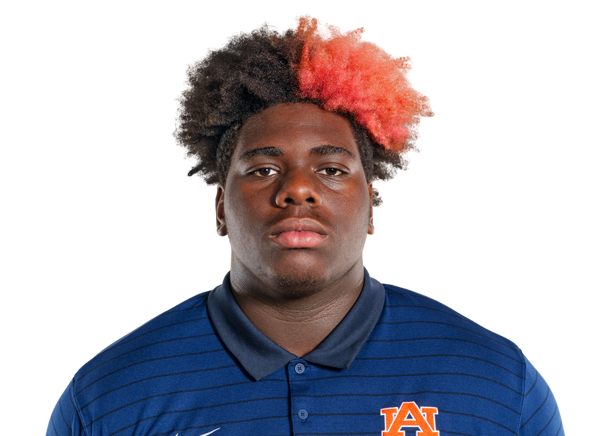
Corey Wells
Defensive Backs
#1

Champ Anthony
#14
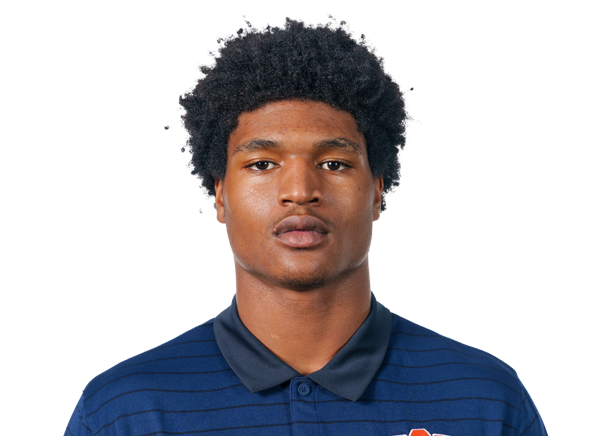
Shamar Arnoux
#32
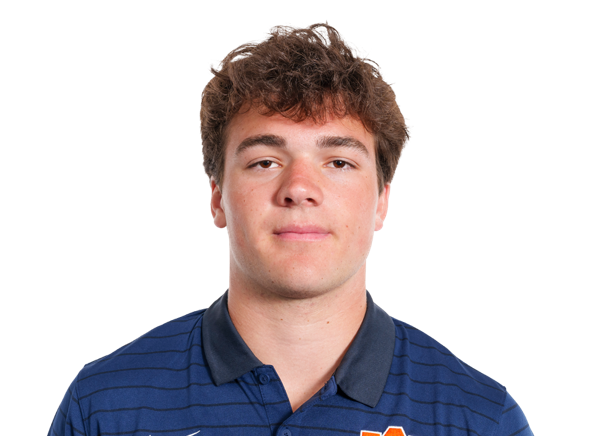
Cade Carlson
#3

AnQuon Fegans
#23
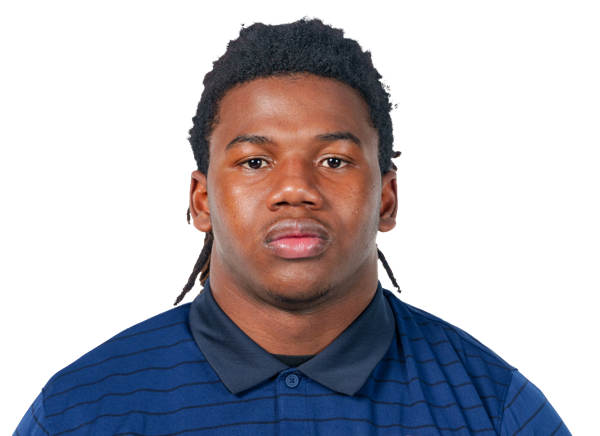
Fred Gaskin III
#8
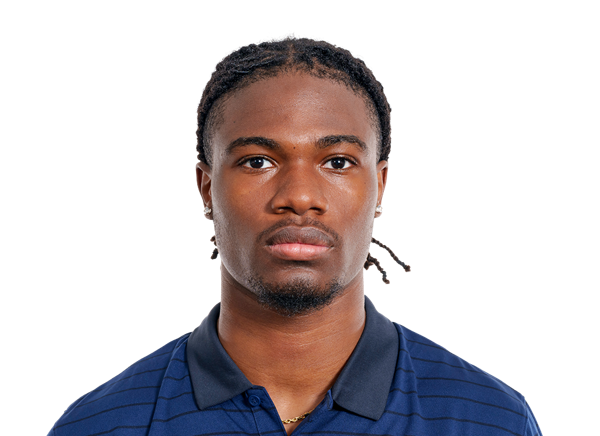
Kaleb Harris
#26
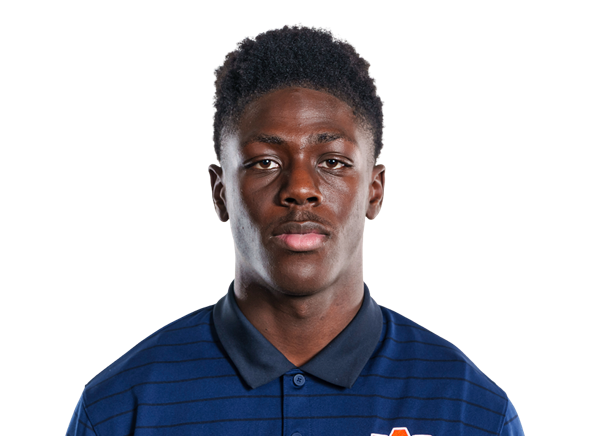
Wayne Henry
#21
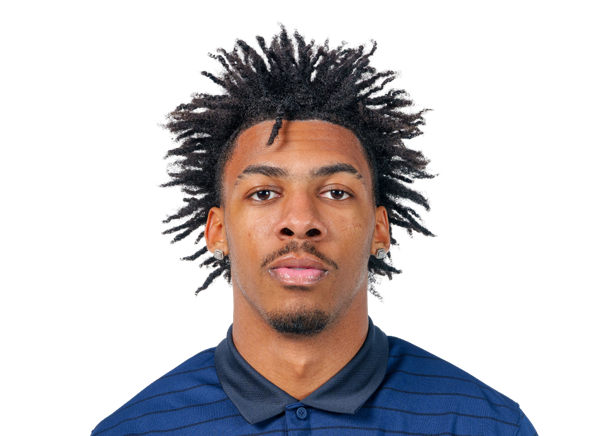
Gavin Jenkins
#22
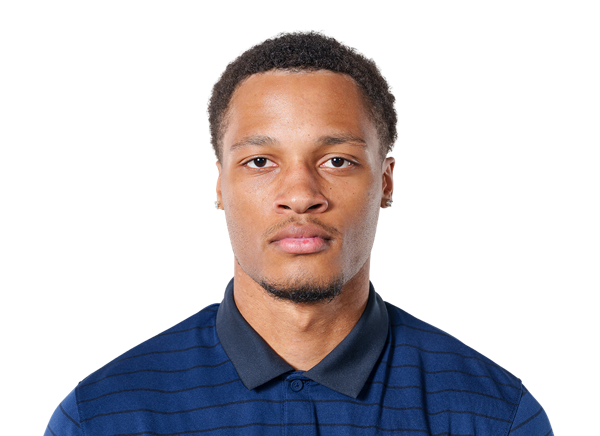
Andre Jordan Jr.
#20
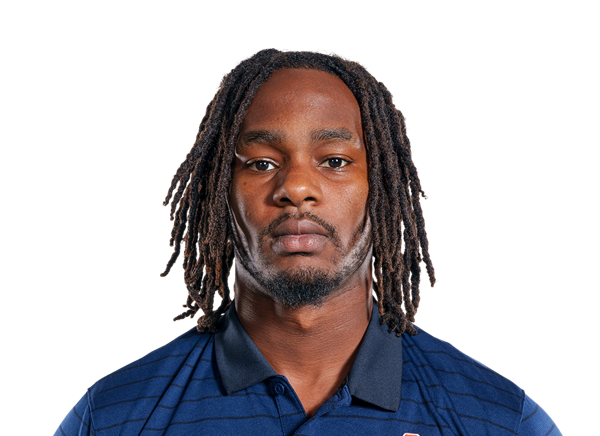
Jacoby Mathews
#4
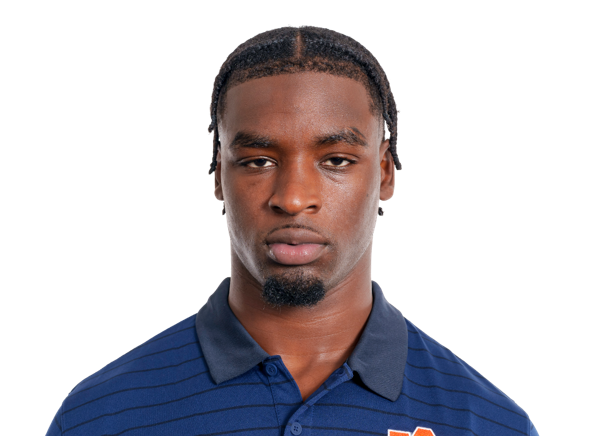
Rayshawn Pleasant
#46
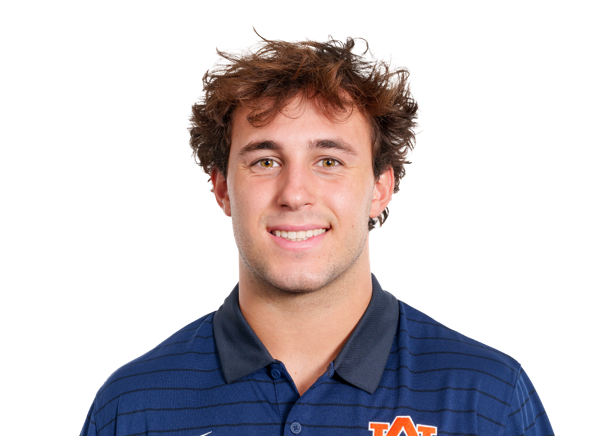
Grey Reebals
#19
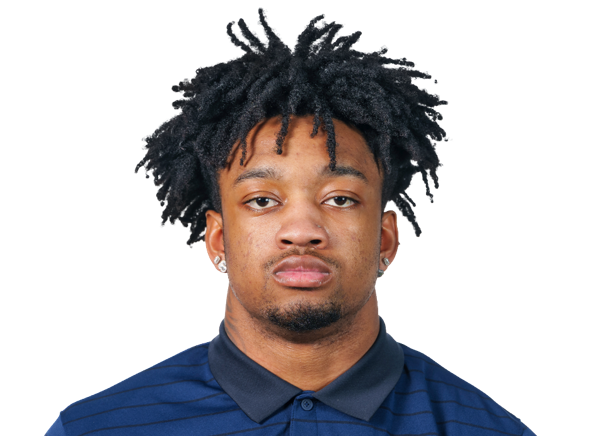
Scrap Richardson
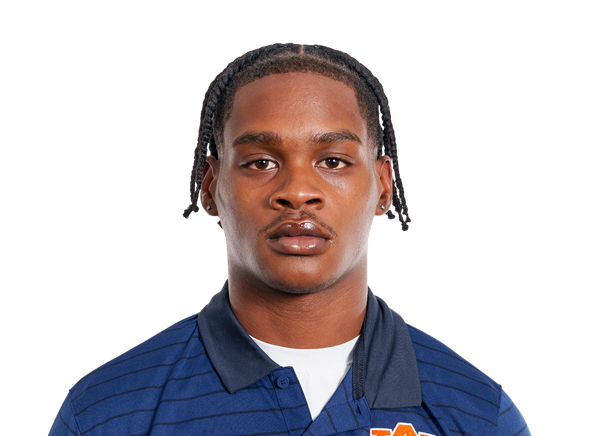
Sylvester Smith-Reed
#25

Damonte Tabb
#33
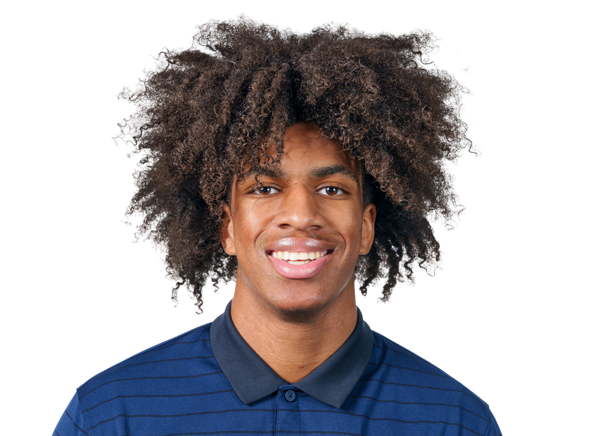
Kamari Todd
#28
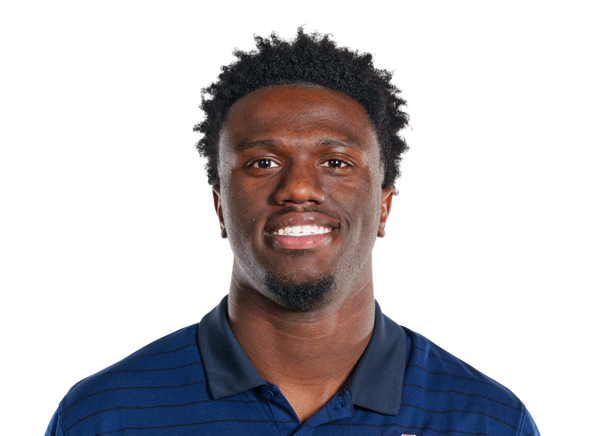
Shadrick Toodle Jr.
#27
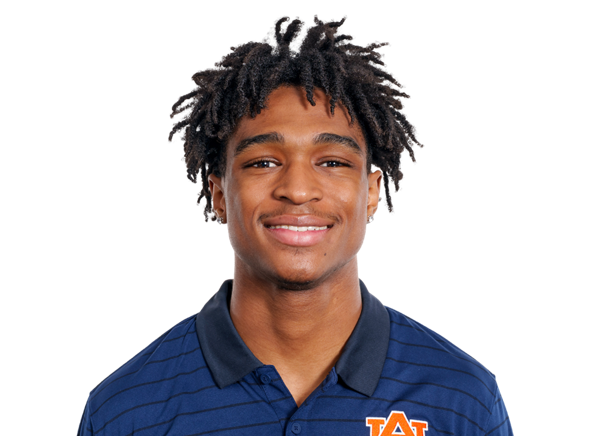
Devin Williams
#5
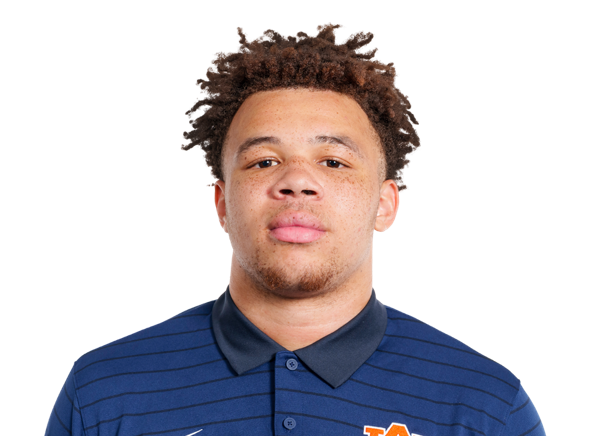
Eric Winters
#12
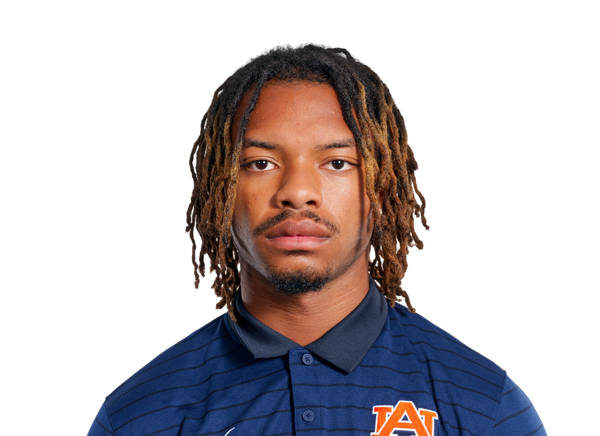
Blake Woodby
Other
#18

J.J. Faulk
#41
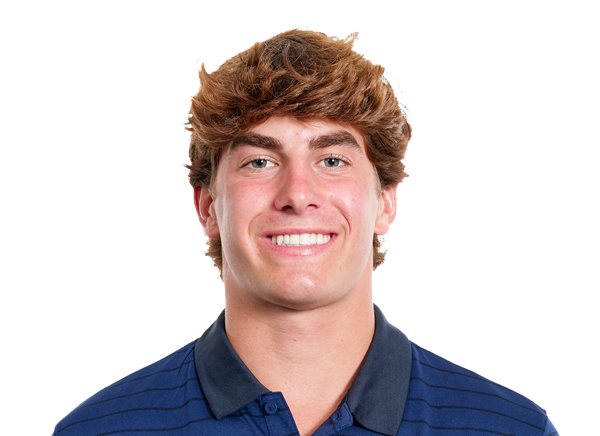
Connor Gibbs
#90
Nate Johnson
#38

Alex McPherson
#31

Joe Phillips
#93

Charley Schwinger
#41

Jared Smith
#29

Jaquez Wilkes
#15
Da'Shawn Womack
No roster data
Auburn
1st in SEC
VS
Home
Passing
61.1
Completion Percentage
—
221
Completions
—
1.11
Interception Percentage
—
4
Interceptions
—
91
Longest Pass
—
2,365
Net Passing Yards
—
197.1
Net Passing Yards Per Game
—
362
Passing Attempts
—
3.04
Passing Touchdown %
—
11
Passing Touchdowns
—
123.7
Passer Rating
—
42
Total Sacks
—
-257
Sack Yards Lost
—
6.5
Yards Per Pass Attempt
—
2,365
Passing Yards
—
0
Passing Fumbles Lost
—
12
Team Games Played
—
373.9
Yards Per Game
—
26.8
Total Points Per Game
—
321
Total Points
—
45
Total Touchdowns
—
197.1
Passing Yards Per Game
—
221-362
Comp-Att
—
42--257
Sacks-Yards Lost
—
Rushing
454
Rushing Attempts
—
2,122
Rushing Yards
—
4.7
Yards Per Rush Attempt
—
75
Long Rushing
—
0
20+ Yard Rushing Plays
—
23
Rushing Touchdowns
—
176.8
Rushing Yards Per Game
—
0
Rushing Fumbles
—
0
Rushing Fumbles Lost
—
0
Rushing 1st downs
—
12
Team Games Played
—
4,487
Total Yards
—
858
Total Offensive Plays
—
26.8
Total Points Per Game
—
321
Total Points
—
45
Total Touchdowns
—
Receiving
221
Receptions
—
0
Receiving Targets
—
2,365
Receiving Yards
—
2,365
Receiving Yards
—
11
Receiving Touchdowns
—
91
Long Reception
—
0
20+ Yard Receiving Plays
—
197.1
Receiving Yards Per Game
—
0
Receiving Fumbles
—
0
Receiving Fumbles Lost
—
0
Receiving Yards After Catch
—
0
Receiving First Downs
—
12
Team Games Played
—
10.7
Yards Per Reception
—
26.8
Total Points Per Game
—
321
Total Points
—
45
Total Touchdowns
—
Miscellaneous
249
Total 1st downs
—
122
Rushing 1st downs
—
107
Passing 1st downs
—
20
1st downs by penalty
—
65
Third Down Conversions
—
166
Third Down Attempts
—
39.16
3rd down %
—
12
Fourth Down Conversions
—
23
First Downs Attempts
—
52.17
4th down %
—
93
Total Penalties
—
764
Total Penalty Yards
—
21190
Possession Time Seconds
—
0.00
Red Zone Field Goal Percentage
—
0.00
Red Zone Scoring Percentage
—
0.00
Red Zone Efficiency Percentage
—
0.00
Red Zone Touchdown Percentage
—
17
Total Takeaways
—
8
Total Giveaways
—
9
Turnover Ratio
—
4
Fumbles Lost
—
65-166
3rd down efficiency
—
12-23
4th down efficiency
—
93-764
Total-Yards
—
Defense
502
Solo Tackles
—
187
Assist Tackles
—
689
Total Tackles
—
31
Sacks
—
189
Sack Yards
—
0
Stuffs
—
32
Passes Defended
—
22.7
Average Interception Yards
—
73
Long Interception
—
0
Miscellaneous Touchdowns
—
1
Kicks Blocked
—
79
Tackles For Loss
—
12
Team Games Played
—
Defensive Interceptions
11
Interceptions
—
250
Interception Yards
—
2
Interception Touchdowns
—
11-250
INT: Total
—
General
16
Fumbles
—
6
Forced Fumbles
—
6
Fumbles Recovered
—
0
Fumbles Touchdowns
—
12
Games Played
—
16-4
Fumbles-Lost
—
Returning
20
Kick Returns
—
459
Kick Return Yards
—
23.0
Yards Per Kick Return
—
98
Long Kick Return
—
1
Kick Return Touchdowns
—
16
Punt Returns
—
60
Punt Return Yards
—
3.8
Yards Per Punt Return
—
15
Long Punt Return
—
0
Punt Return Touchdowns
—
0
Punt Return Fair Catches
—
0
Kick Return Fumbles Lost
—
0
Punt Return Fumbles Lost
—
12
Team Games Played
—
16-60
Punt: Total
—
Kicking
20
Field Goal Made
—
25
Field Goal Attempts
—
80.0
Field Goal Percentage
—
49
Long Field Goal Made
—
0
Field Goal Attempts 1-19
—
9
Field Goal Attempts 20-29
—
6
Field Goal Attempts 30-39
—
7
Field Goal Attempts 40-49
—
3
Field Goal Attempts 50+
—
35
Extra Points Made
—
35
Extra Point Attempts
—
100.0
Extra Point Percentage
—
0
Field Goals Made 1-19
—
9
Field Goals Made 20-29
—
5
Field Goals Made 30-39
—
6
Field Goals Made 40-49
—
0
Field Goals Made 50+
—
95
Total Kicking Points
—
12
Team Games Played
—
72
Touchback Percentage
—
23.0
Average Kickoff Return Yards
—
459
Kickoff Return Yards
—
20
Kickoff Returns
—
20-459
Kickoffs: Total
—
20-25
FG: Good-Attempts
—
Punting
49
Punts
—
2,060
Punt Yards
—
55
Long Punt
—
42.0
Gross Average Punt Yards
—
40.7
Net Average Punt Yards
—
0
Punts Blocked
—
11
Punts Inside 20
—
1
Touchbacks
—
0
Fair Catches
—
16
Punt Returns
—
60
Punt Return Yards
—
3.8
Average Punt Return Yards
—
12
Team Games Played
—
49-2,060
Punt: Total Yards
—
Scoring
23
Rushing Touchdowns
—
11
Receiving Touchdowns
—
3
Return Touchdowns
—
37
Total Touchdowns
—
20
Field Goals
—
35
Kick Extra Points
—
2
Total Two Point Conversions
—
321
Total Points
—
26.8
Total Points Per Game
—