

Baylor vs Auburn Live Score (5 Sep, 2026)
Score by Quarter
| Team | Q1 | Q2 | Q3 | Q4 | Final |
|---|---|---|---|---|---|
 Baylor |
0 | 7 | 0 | 9 | 16 |
 Auburn |
3 | 7 | 0 | 7 | 17 |
Scoring Plays
Q1
8:13
8:13
Alex McPherson 43 Yd Field Goal
Field Goal Good
0 – 3
Q2
3:51
3:51
Jeremiah Cobb 15 Yd Run (Alex McPherson Kick)
Rushing Touchdown
0 – 10
Q2
1:30
1:30
Louis Brown IV 14 Yd pass from DJ Lagway (Rhett Armstrong Kick)
Passing Touchdown
7 – 10
Q4
7:12
7:12
Rhett Armstrong 22 Yd Field Goal
Field Goal Good
10 – 10
Q4
3:21
3:21
Byrum Brown 11 Yd Run (Alex McPherson Kick)
Rushing Touchdown
10 – 17
Q4
0:09
0:09
Gavin Freeman 5 Yd pass from DJ Lagway (Two-Point Pass Conversion Failed)
Passing Touchdown
16 – 17
Game Leaders
BaylorAuburn
 D. Lagway QB
Passing Yards
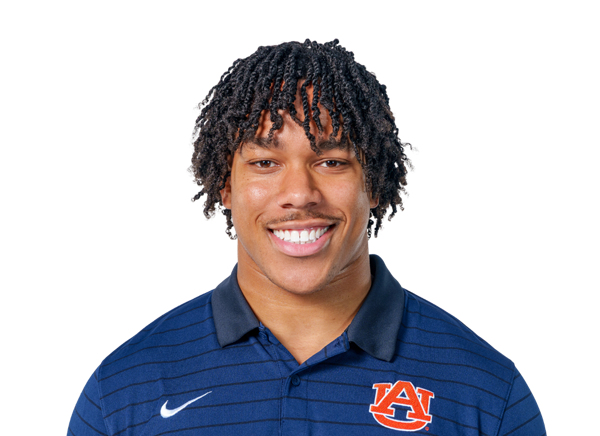 B. Brown QB
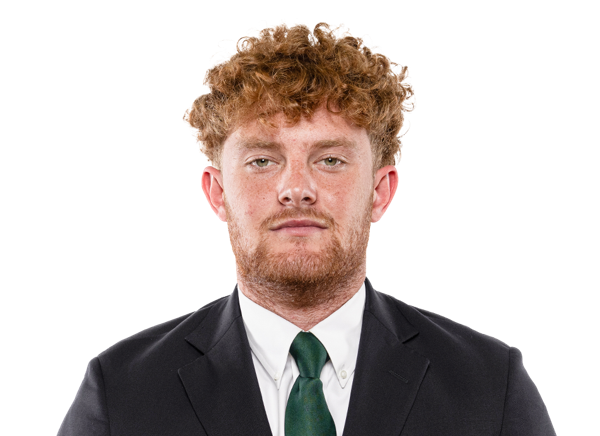 D. Pendergrass RB
Rushing Yards
 J. Cobb RB
 G. Freeman WR
Receiving Yards
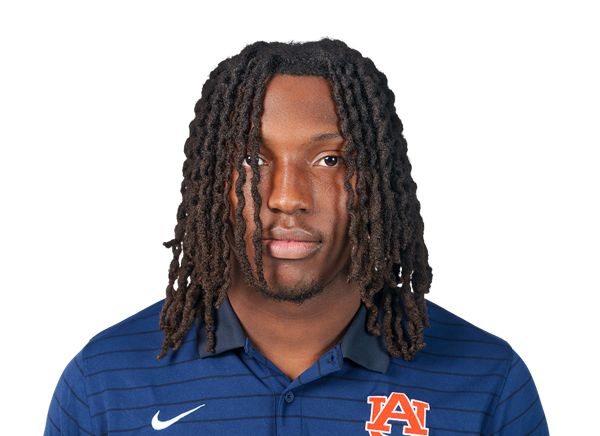 K. Singleton WR
 D. Tezino DL
Sacks
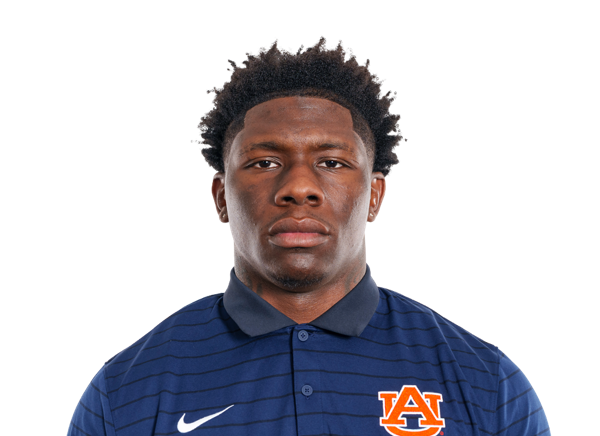 X. Atkins LB
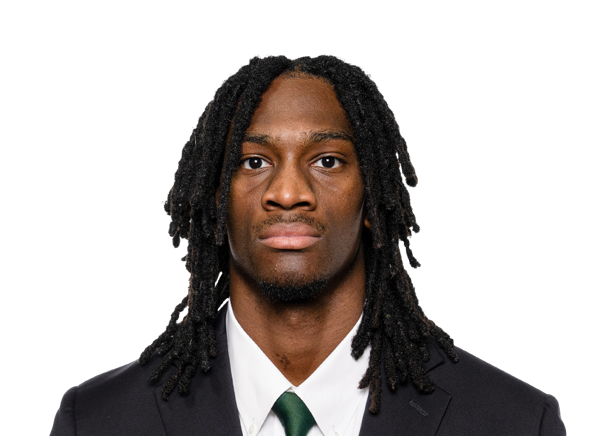 D. Turner S
Tackles
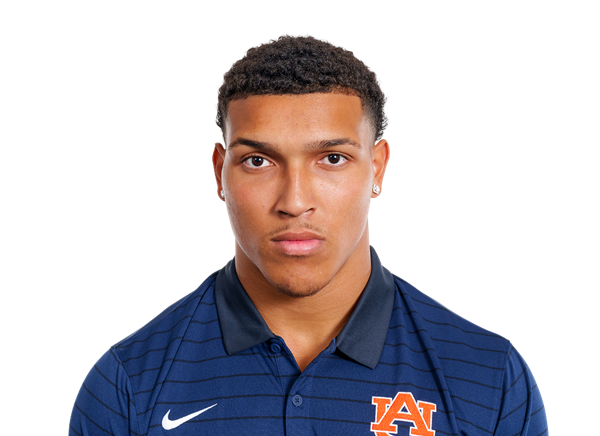 E. Melendez LB
Player Box Score
Baylor| Player | C/ATT | YDS | AVG | TD | INT |
|---|---|---|---|---|---|
| DJ Lagway#2 | 27/54 | 333 | 6.2 | 2 | 1 |
Auburn| Player | C/ATT | YDS | AVG | TD | INT |
|---|---|---|---|---|---|
| Byrum Brown#17 | 26/35 | 259 | 7.4 | 0 | 3 |
Baylor| Player | CAR | YDS | AVG | TD | LONG |
|---|---|---|---|---|---|
| Dawson Pendergrass#35 | 25 | 88 | 3.5 | 0 | 7 |
 Caden Knighten#11 | 12 | 33 | 2.8 | 0 | 10 |
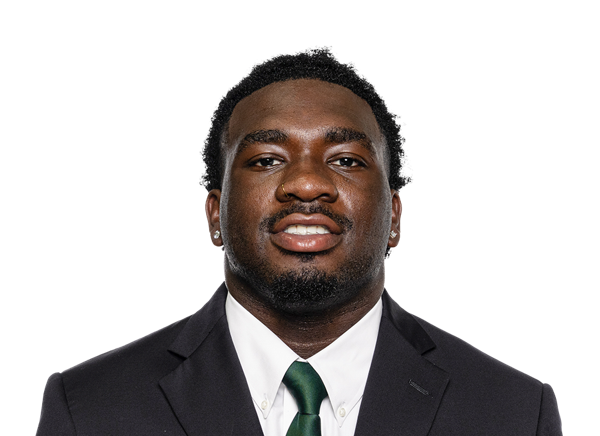 Michael Turner#23 | 4 | 6 | 1.5 | 0 | 4 |
| DJ Lagway#2 | 3 | -10 | -3.3 | 0 | 0 |
| Team | 1 | -14 | -14.0 | 0 | 14 |
Auburn| Player | CAR | YDS | AVG | TD | LONG |
|---|---|---|---|---|---|
| Jeremiah Cobb#23 | 12 | 53 | 4.4 | 1 | 15 |
| Byrum Brown#17 | 21 | 27 | 1.3 | 1 | 21 |
 Bryce Cain#6 | 1 | 25 | 25.0 | 0 | 25 |
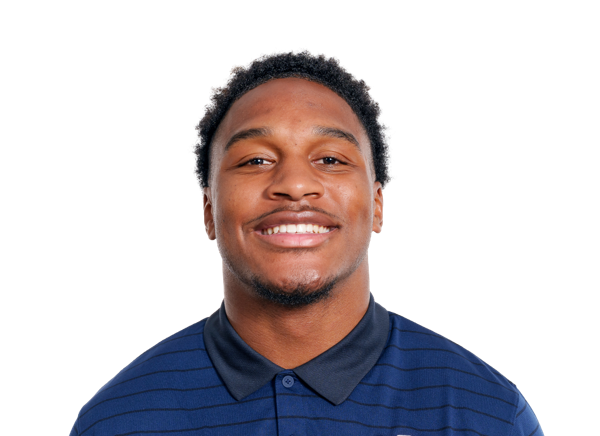 Omar Mabson II#29 | 5 | 19 | 3.8 | 0 | 12 |
 Bryson Washington#30 | 1 | 7 | 7.0 | 0 | 7 |
| Team | 1 | -1 | -1.0 | 0 | 0 |
Baylor| Player | REC | YDS | AVG | TD | LONG |
|---|---|---|---|---|---|
| Gavin Freeman#6 | 12 | 154 | 12.8 | 1 | 28 |
 Jadon Porter#3 | 5 | 77 | 15.4 | 0 | 27 |
 Louis Brown IV#4 | 5 | 62 | 12.4 | 1 | 15 |
 Hawkins Polley#86 | 1 | 20 | 20.0 | 0 | 20 |
| Dawson Pendergrass#35 | 2 | 11 | 5.5 | 0 | 6 |
| Caden Knighten#11 | 1 | 6 | 6.0 | 0 | 6 |
 Matthew Klopfenstein#85 | 1 | 3 | 3.0 | 0 | 3 |
Auburn| Player | REC | YDS | AVG | TD | LONG |
|---|---|---|---|---|---|
| Keshaun Singleton#11 | 7 | 89 | 12.7 | 0 | 20 |
 Jeremiah Koger#4 | 5 | 66 | 13.2 | 0 | 30 |
 Chas Nimrod#5 | 4 | 41 | 10.3 | 0 | 26 |
 Jake Johnson#19 | 3 | 20 | 6.7 | 0 | 10 |
| Omar Mabson II#29 | 2 | 15 | 7.5 | 0 | 10 |
| Bryson Washington#30 | 2 | 13 | 6.5 | 0 | 8 |
| Jeremiah Cobb#23 | 2 | 8 | 4.0 | 0 | 9 |
 Jonathan Echols#1 | 1 | 7 | 7.0 | 0 | 7 |
Baylor| Player | TOT | SOLO | SACKS | TFL | PD | QB HUR | TD |
|---|---|---|---|---|---|---|---|
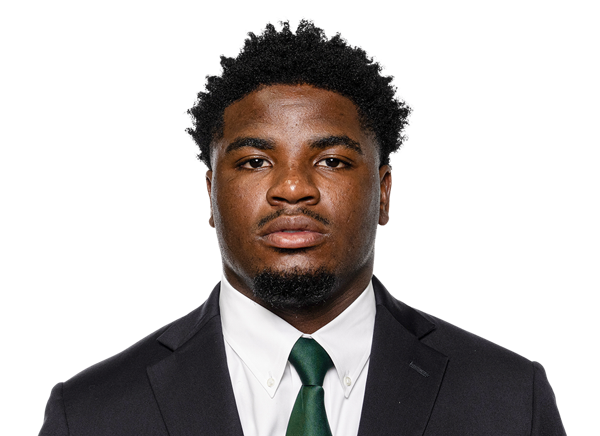 Travion Barnes#5 | 9 | 7 | 0 | 0 | 0 | 0 | 0 |
| Devin Turner#11 | 9 | 5 | 0 | 1 | 1 | 0 | 0 |
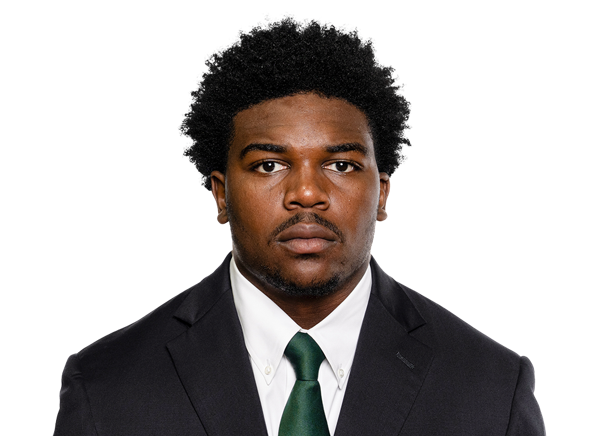 Kyland Reed#10 | 7 | 7 | 0 | 1 | 0 | 0 | 0 |
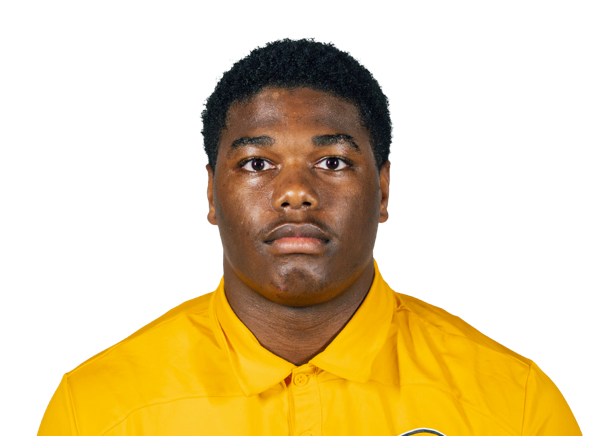 Garrick Ponder#13 | 4 | 3 | 1 | 2.5 | 0 | 0 | 0 |
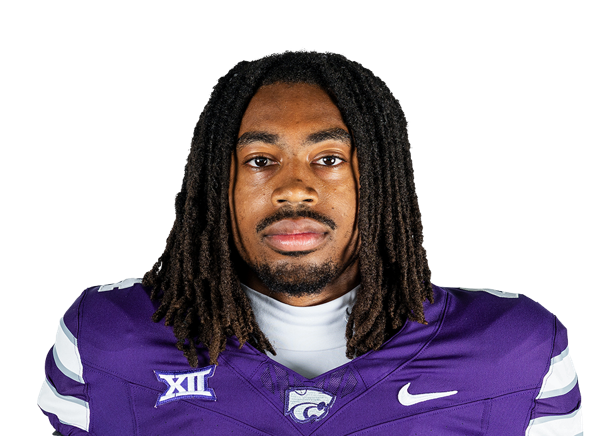 Daniel Cobbs#14 | 4 | 3 | 1 | 1 | 0 | 0 | 0 |
| Devonte Tezino#59 | 4 | 2 | 2 | 2 | 1 | 0 | 0 |
 Kyler Jordan#40 | 3 | 3 | 0 | 0 | 1 | 0 | 0 |
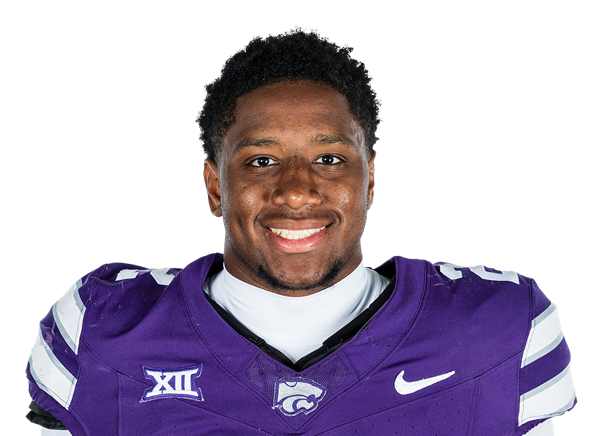 Colby McCalister#15 | 3 | 3 | 0 | 0 | 0 | 0 | 0 |
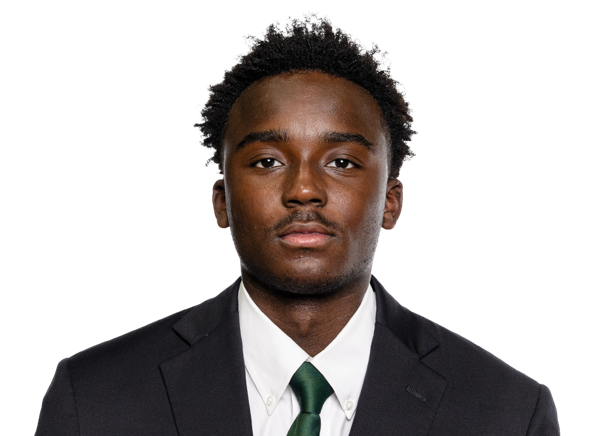 LeVar Thornton Jr.#25 | 3 | 3 | 0 | 0 | 0 | 0 | 0 |
 Devon Jordan#7 | 3 | 3 | 0 | 0 | 0 | 0 | 0 |
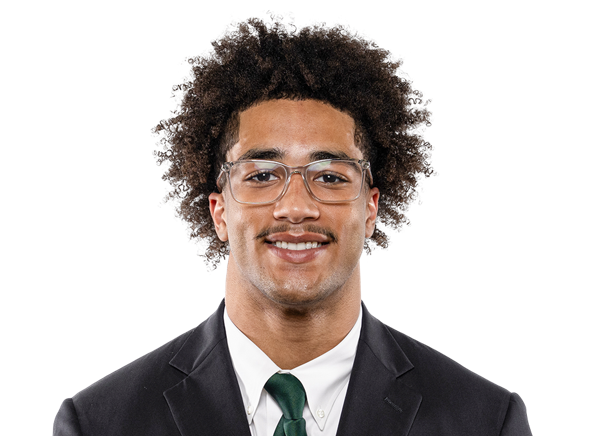 Micah Gifford#24 | 3 | 2 | 0 | 0.5 | 0 | 0 | 0 |
 Jamaal Whyce Jr.#99 | 3 | 1 | 0 | 0 | 0 | 0 | 0 |
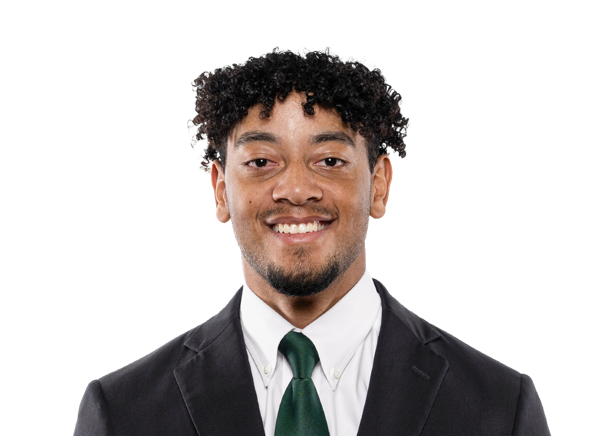 Reggie Bush II#22 | 3 | 1 | 0 | 0 | 0 | 0 | 0 |
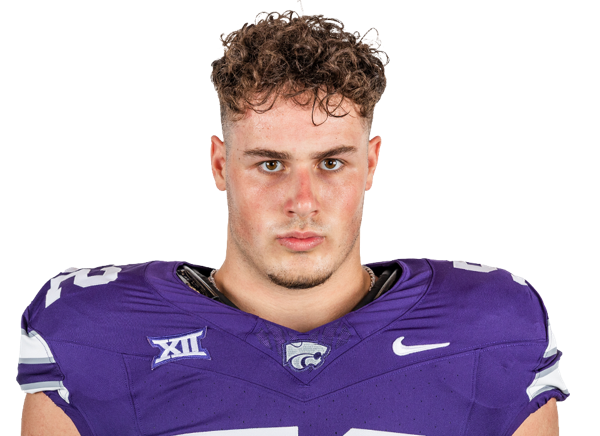 Ryan Davis#9 | 3 | 1 | 0 | 0 | 0 | 0 | 0 |
 Hosea Wheeler | 2 | 2 | 0 | 1 | 0 | 0 | 0 |
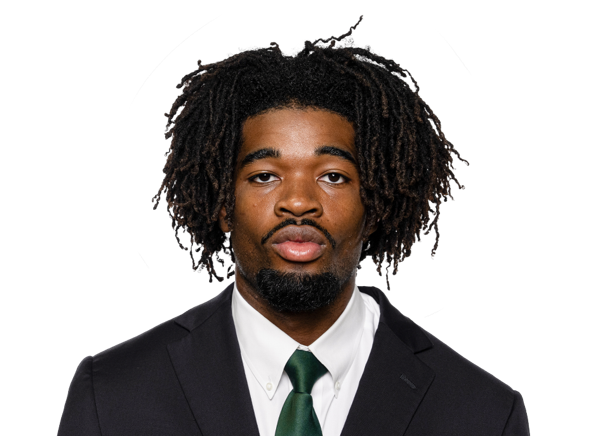 Bo Onu#21 | 2 | 2 | 0 | 0 | 0 | 0 | 0 |
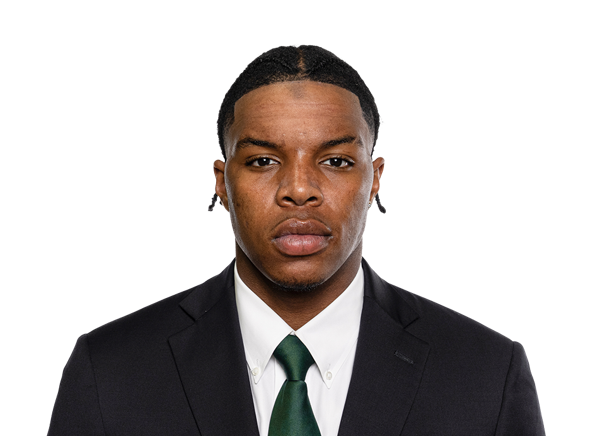 Kaleb Burns#41 | 2 | 2 | 0 | 1 | 1 | 0 | 0 |
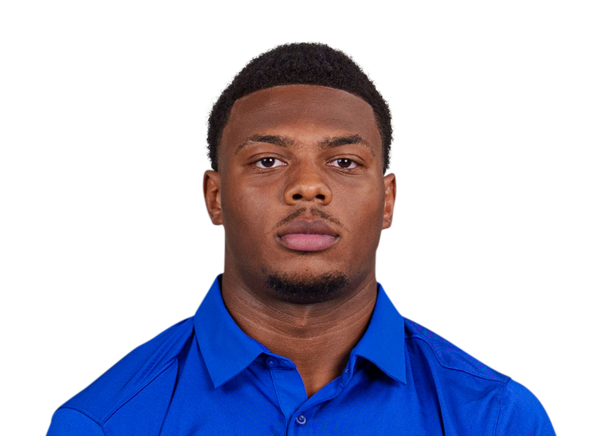 Kedrick Walker#36 | 2 | 2 | 0 | 0 | 0 | 0 | 0 |
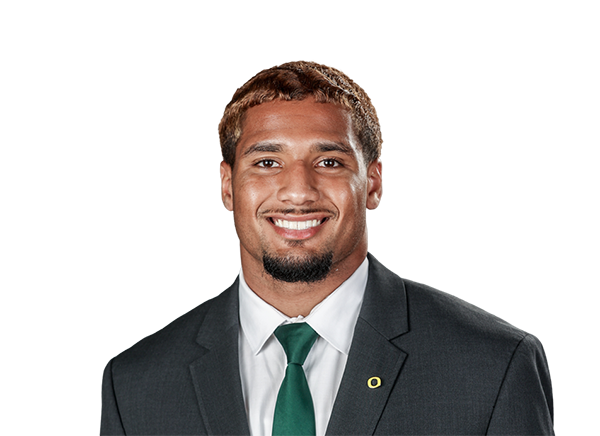 Tyler Turner#17 | 2 | 1 | 0 | 0 | 0 | 0 | 0 |
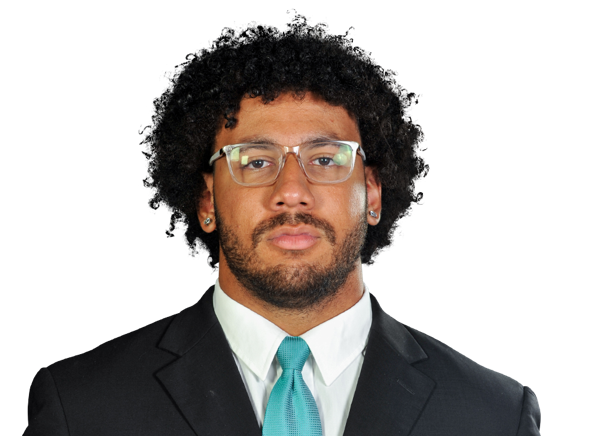 Jordan Mack#97 | 1 | 1 | 1 | 1 | 0 | 0 | 0 |
| Gavin Freeman#6 | 1 | 1 | 0 | 0 | 0 | 0 | 0 |
 Kamren Washington#96 | 1 | 0 | 0 | 0 | 0 | 0 | 0 |
| Kaleb Arterberry#56 | 1 | 0 | 0 | 0 | 0 | 0 | 0 |
Auburn| Player | TOT | SOLO | SACKS | TFL | PD | QB HUR | TD |
|---|---|---|---|---|---|---|---|
| Elijah Melendez#9 | 12 | 7 | 0 | 1.5 | 2 | 0 | 0 |
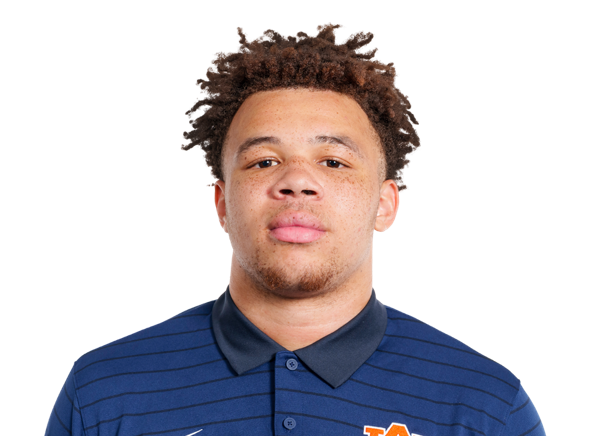 Eric Winters#5 | 11 | 9 | 0 | 2 | 0 | 0 | 0 |
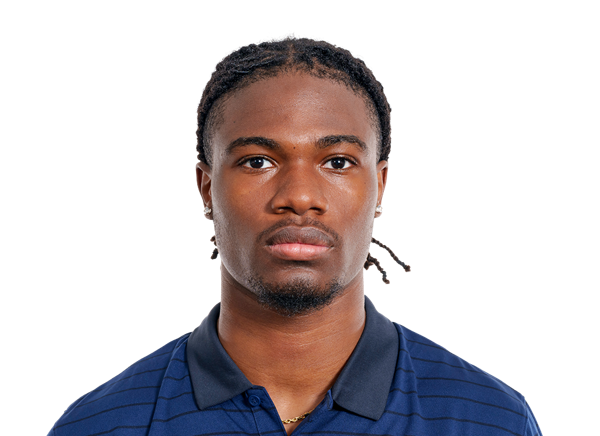 Kaleb Harris#8 | 6 | 3 | 0 | 0 | 0 | 0 | 0 |
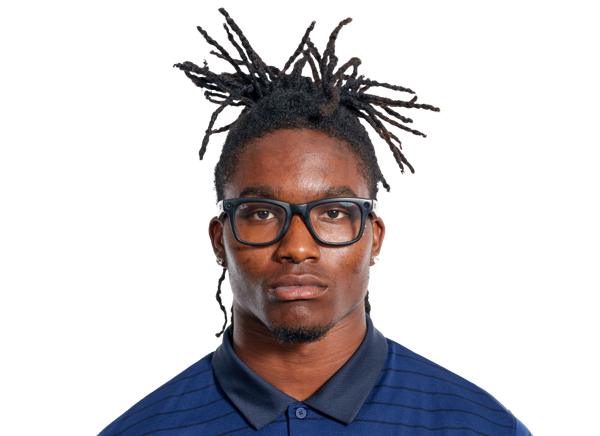 Bryce Deas#16 | 6 | 3 | 0 | 0 | 1 | 0 | 0 |
| Xavier Atkins#17 | 5 | 4 | 1 | 2 | 0 | 0 | 0 |
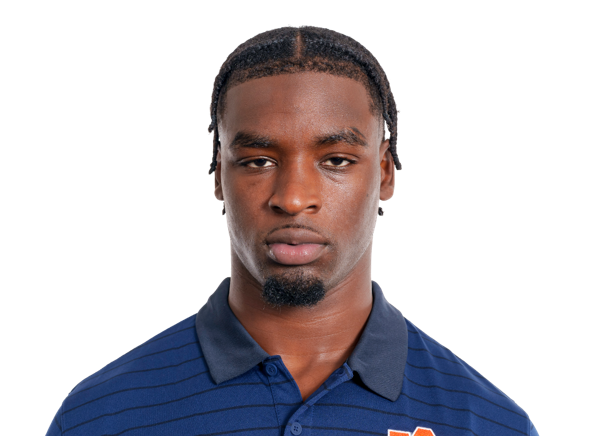 Rayshawn Pleasant#4 | 4 | 3 | 0 | 0 | 2 | 0 | 0 |
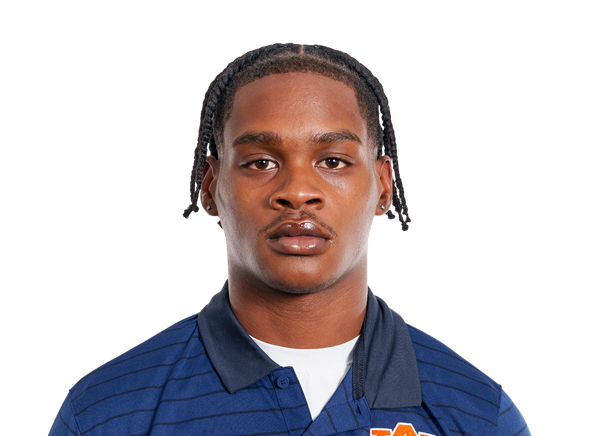 Sylvester Smith-Reed | 4 | 3 | 0 | 0 | 1 | 0 | 0 |
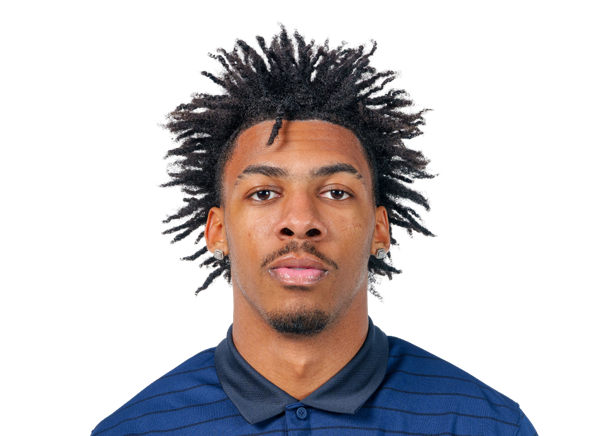 Gavin Jenkins#21 | 4 | 3 | 0 | 0 | 0 | 0 | 0 |
 Dallas Walker IV#35 | 4 | 2 | 0 | 0.5 | 0 | 0 | 0 |
 Champ Anthony#1 | 4 | 2 | 0 | 0 | 0 | 0 | 0 |
 Darrion Smith#11 | 3 | 2 | 0 | 0 | 0 | 0 | 0 |
 Andre Jordan Jr.#22 | 3 | 2 | 0 | 0 | 2 | 0 | 0 |
 Cody Sigler#94 | 3 | 2 | 0 | 0 | 1 | 0 | 0 |
| Chas Nimrod#5 | 2 | 2 | 0 | 0 | 0 | 0 | 0 |
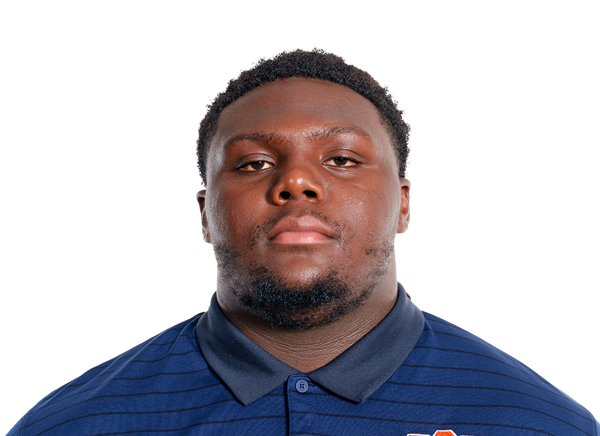 Jourdin Crawford#95 | 2 | 1 | 0 | 0 | 0 | 0 | 0 |
 Chris Murray#13 | 2 | 1 | 0 | 0 | 0 | 0 | 0 |
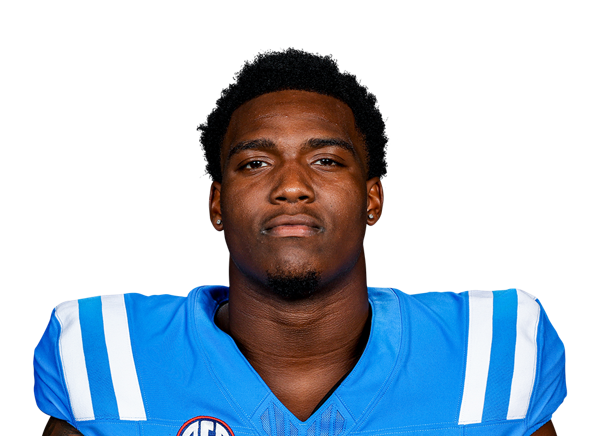 Da'Shawn Womack#15 | 1 | 1 | 0 | 0 | 0 | 0 | 0 |
| Bryce Cain#6 | 1 | 1 | 0 | 0 | 0 | 0 | 0 |
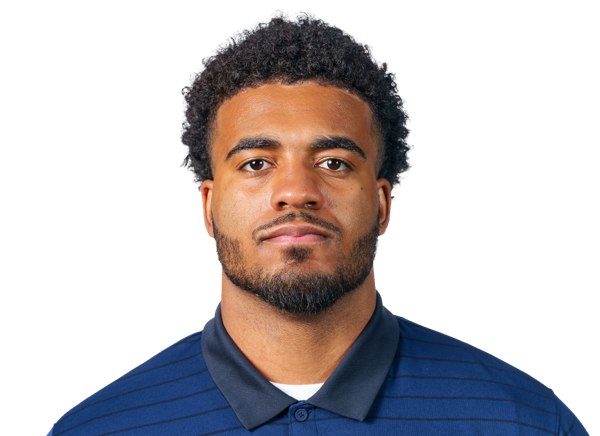 Nate Johnson#90 | 1 | 1 | 0 | 0 | 0 | 0 | 0 |
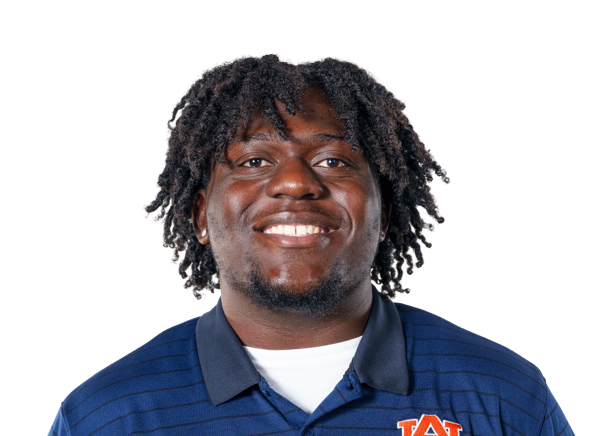 Walter Mathis Jr.#10 | 1 | 1 | 0 | 1 | 0 | 0 | 0 |
 Will Myers#11 | 1 | 1 | 0 | 0 | 0 | 0 | 0 |
 AnQuon Fegans#3 | 1 | 0 | 0 | 0.5 | 0 | 0 | 0 |
 Jared Smith#41 | 1 | 0 | 0 | 0.5 | 0 | 0 | 0 |
Baylor| Player | FUM | LOST | REC |
|---|---|---|---|
| DJ Lagway#2 | 1 | 1 | 0 |
| Team | 1 | 0 | 0 |
Auburn| Player | FUM | LOST | REC |
|---|---|---|---|
| Kaleb Harris#8 | 0 | 0 | 1 |
Baylor| Player | FG | PCT | LONG | XP | PTS |
|---|---|---|---|---|---|
 Rhett Armstrong#98 | 1/2 | 50.0 | 22 | 1/1 | 4 |
Auburn| Player | FG | PCT | LONG | XP | PTS |
|---|---|---|---|---|---|
 Alex McPherson#38 | 1/2 | 50.0 | 43 | 2/2 | 5 |
Baylor| Player | NO | YDS | AVG | TB | In 20 | LONG |
|---|---|---|---|---|---|---|
 Palmer Williams#94 | 4 | 208 | 52.0 | 0 | 1 | 54 |
Auburn| Player | NO | YDS | AVG | TB | In 20 | LONG |
|---|---|---|---|---|---|---|
 Hudson Kaak#14 | 4 | 170 | 42.5 | 0 | 2 | 49 |
Baylor| Player | NO | YDS | AVG | LONG | TD |
|---|---|---|---|---|---|
 Jayden McGowan#15 | 1 | -3 | -3.0 | 0 | 0 |
Auburn| Player | NO | YDS | AVG | LONG | TD |
|---|---|---|---|---|---|
 Christian Neptune#8 | 1 | 2 | 2.0 | 2 | 0 |
Baylor| Player | INT | YDS | TD |
|---|---|---|---|
| Micah Gifford#24 | 1 | 6 | 0 |
| Devon Jordan#7 | 1 | 6 | 0 |
| Reggie Bush II#22 | 1 | -2 | 0 |
Auburn| Player | INT | YDS | TD |
|---|---|---|---|
| Jared Smith#41 | 1 | 6 | 0 |
Drive Summary
AUB
Punt
15
BAY
Fumble
54
AUB
Field Goal
45
BAY
Interception
33
AUB
Punt
-18
BAY
Missed FG
50
AUB
Punt
1
BAY
Punt
30
AUB
Interception
50
BAY
Punt
3
AUB
Touchdown
57
BAY
Touchdown
75
AUB
Interception
49
BAY
End Of Half
1
BAY
Punt
0
AUB
Missed FG
53
BAY
Downs
58
AUB
Punt
38
BAY
Punt
-5
AUB
Downs
30
BAY
Downs
28
AUB
Interception
0
BAY
Field Goal
45
AUB
Touchdown
75
BAY
Touchdown
70
AUB
End Of Quarter
-1
Injury Report
No current injury report is available for this matchup.
Head-to-Head
Historical meetings are not available for this matchup.
Game Information
EventAflac Kickoff
StageWeek 1
Season2026
KickoffSat, Sep 5, 3:30 pm
VenueMercedes-Benz Stadium
LocationAtlanta, GA
SurfaceArtificial Turf
SiteNeutral Site
BroadcastABC, Disney+
Attendance55,068
Division Standings
FBS — Big 12 Conference
| Team | W | L | T | Pct | PF | PA | Home | Away | Strk |
|---|---|---|---|---|---|---|---|---|---|
 Cincinnati | 5 | 5 | 0 | 0.500 | 310 | 306 | 5-1 | 0-4 | L3 |
 Colorado | 4 | 6 | 0 | 0.400 | 220 | 287 | 3-2 | 1-4 | W1 |
 Houston | 7 | 3 | 0 | 0.700 | 351 | 234 | 5-0 | 2-3 | L1 |
 Iowa State | 5 | 5 | 0 | 0.500 | 304 | 273 | 5-1 | 0-4 | W1 |
 Kansas | 4 | 6 | 0 | 0.400 | 302 | 237 | 3-3 | 1-3 | W1 |
 UCF | 5 | 5 | 0 | 0.500 | 284 | 260 | 4-2 | 1-3 | L1 |
 Utah | 9 | 0 | 0 | 1.000 | 339 | 147 | 6-0 | 3-0 | W9 |
 West Virginia | 5 | 5 | 0 | 0.500 | 349 | 348 | 3-3 | 2-2 | L2 |
 Arizona State | 6 | 4 | 0 | 0.600 | 282 | 259 | 4-1 | 2-3 | W2 |
 Arizona | 7 | 2 | 0 | 0.778 | 308 | 179 | 5-0 | 2-2 | W1 |
 BYU | 8 | 2 | 0 | 0.800 | 307 | 185 | 6-0 | 2-2 | W1 |
 Kansas State | 4 | 6 | 0 | 0.400 | 292 | 261 | 4-2 | 0-4 | L4 |
 Texas Tech | 8 | 1 | 0 | 0.889 | 338 | 217 | 6-0 | 2-1 | W2 |
| Baylor | 6 | 4 | 0 | 0.600 | 294 | 181 | 4-1 | 2-3 | L1 |
 Oklahoma State | 6 | 3 | 0 | 0.667 | 395 | 245 | 4-0 | 2-3 | W1 |
 TCU | 5 | 5 | 0 | 0.500 | 234 | 152 | 4-3 | 1-2 | W1 |
FBS — Southeastern Conference
| Team | W | L | T | Pct | PF | PA | Home | Away | Strk |
|---|---|---|---|---|---|---|---|---|---|
 Alabama | 8 | 2 | 0 | 0.800 | 358 | 189 | 4-1 | 4-1 | W3 |
 Arkansas | 4 | 6 | 0 | 0.400 | 214 | 253 | 3-3 | 1-3 | W1 |
| Auburn | 6 | 4 | 0 | 0.600 | 260 | 246 | 4-2 | 2-2 | W2 |
 Georgia | 9 | 1 | 0 | 0.900 | 418 | 147 | 6-1 | 3-0 | W3 |
 Kentucky | 7 | 3 | 0 | 0.700 | 283 | 253 | 4-2 | 3-1 | L2 |
 Missouri | 6 | 4 | 0 | 0.600 | 293 | 229 | 4-1 | 2-3 | L2 |
 Oklahoma | 5 | 4 | 0 | 0.556 | 199 | 173 | 3-2 | 2-2 | W1 |
 South Carolina | 6 | 4 | 0 | 0.600 | 318 | 245 | 4-2 | 2-2 | L1 |
 Tennessee | 8 | 2 | 0 | 0.800 | 314 | 143 | 5-1 | 3-1 | W2 |
 Texas | 8 | 2 | 0 | 0.800 | 302 | 178 | 5-1 | 3-1 | W4 |
 Florida | 6 | 4 | 0 | 0.600 | 313 | 262 | 3-2 | 3-2 | W1 |
 LSU | 6 | 4 | 0 | 0.600 | 355 | 181 | 5-2 | 1-2 | L2 |
 Mississippi State | 4 | 6 | 0 | 0.400 | 245 | 291 | 2-4 | 2-2 | L6 |
 Ole Miss | 6 | 3 | 0 | 0.667 | 304 | 234 | 5-1 | 1-2 | L1 |
 Texas A&M | 4 | 6 | 0 | 0.400 | 242 | 190 | 4-2 | 0-4 | L3 |
 Vanderbilt | 4 | 6 | 0 | 0.400 | 213 | 286 | 3-3 | 1-3 | L1 |
Baylor
6th in Big 12
VS
Auburn
10th in SEC
Quarterbacks & Specialists
#2
DJ Lagway
#94
Palmer Williams
Receivers & Backs
#4
Louis Brown IV
#6
Gavin Freeman
#85
Matthew Klopfenstein
#11
Caden Knighten
#15
Jayden McGowan
#35
Dawson Pendergrass
#86
Hawkins Polley
#3
Jadon Porter
#23
Michael Turner
Defensive Line & Linebackers
#56
Kaleb Arterberry
#5
Travion Barnes
#41
Kaleb Burns
#9
Ryan Davis
#40
Kyler Jordan
#97
Jordan Mack
#13
Garrick Ponder
#10
Kyland Reed
#59
Devonte Tezino
#36
Kedrick Walker
#96
Kamren Washington
Hosea Wheeler
#99
Jamaal Whyce Jr.
Defensive Backs
#22
Reggie Bush II
#14
Daniel Cobbs
#24
Micah Gifford
#7
Devon Jordan
#15
Colby McCalister
#21
Bo Onu
#25
LeVar Thornton Jr.
#11
Devin Turner
#17
Tyler Turner
Other
#98
Rhett Armstrong
Quarterbacks & Specialists
#17
Byrum Brown
#14
Hudson Kaak
#11
Will Myers
Receivers & Backs
#6
Bryce Cain
#23
Jeremiah Cobb
#1
Jonathan Echols
#19
Jake Johnson
#4
Jeremiah Koger
#29
Omar Mabson II
#8
Christian Neptune
#5
Chas Nimrod
#11
Keshaun Singleton
#30
Bryson Washington
Defensive Line & Linebackers
#17
Xavier Atkins
#95
Jourdin Crawford
#16
Bryce Deas
#10
Walter Mathis Jr.
#9
Elijah Melendez
#13
Chris Murray
#94
Cody Sigler
#11
Darrion Smith
#35
Dallas Walker IV
Defensive Backs
#1
Champ Anthony
#3
AnQuon Fegans
#8
Kaleb Harris
#21
Gavin Jenkins
#22
Andre Jordan Jr.
#4
Rayshawn Pleasant
Sylvester Smith-Reed
#5
Eric Winters
Other
#90
Nate Johnson
#38
Alex McPherson
#41
Jared Smith
#15
Da'Shawn Womack
Baylor
3rd in Big 12
VS
Auburn
11th in SEC
Passing
57.1
Completion Percentage
65.2
194
Completions
195
2.10
Interception Percentage
2.30
7
Interceptions
7
77
Longest Pass
48
2,500
Net Passing Yards
1,906
277.8
Net Passing Yards Per Game
211.8
340
Passing Attempts
299
6.20
Passing Touchdown %
4.30
21
Passing Touchdowns
13
135.4
Passer Rating
128.7
19
Total Sacks
36
125
Sack Yards Lost
179
7.4
Yards Per Pass Attempt
6.4
2,500
Passing Yards
1,906
0
Passing Fumbles Lost
0
9
Team Games Played
9
433.4
Yards Per Game
367.7
31.9
Total Points Per Game
24.3
287
Total Points
219
35
Total Touchdowns
27
277.8
Passing Yards Per Game
211.8
194-340
Comp-Att
195-299
19-125
Sacks-Yards Lost
36-179
Rushing
347
Rushing Attempts
334
1,401
Rushing Yards
1,403
4.0
Yards Per Rush Attempt
4.2
75
Long Rushing
57
0
20+ Yard Rushing Plays
0
13
Rushing Touchdowns
12
155.7
Rushing Yards Per Game
155.9
0
Rushing Fumbles
0
0
Rushing Fumbles Lost
0
72
Rushing 1st downs
80
9
Team Games Played
9
3,901
Total Yards
3,309
706
Total Offensive Plays
669
31.9
Total Points Per Game
24.3
287
Total Points
219
35
Total Touchdowns
27
Receiving
194
Receptions
195
0
Receiving Targets
0
2,500
Receiving Yards
1,906
2,500
Receiving Yards
1,906
21
Receiving Touchdowns
13
77
Long Reception
48
0
20+ Yard Receiving Plays
0
277.8
Receiving Yards Per Game
211.8
0
Receiving Fumbles
0
0
Receiving Fumbles Lost
0
962
Receiving Yards After Catch
862
107
Receiving First Downs
96
9
Team Games Played
9
12.9
Yards Per Reception
9.8
31.9
Total Points Per Game
24.3
287
Total Points
219
35
Total Touchdowns
27
Miscellaneous
207
Total 1st downs
193
72
Rushing 1st downs
80
108
Passing 1st downs
96
26
1st downs by penalty
17
57
Third Down Conversions
57
145
Third Down Attempts
136
39.31
3rd down %
41.91
13
Fourth Down Conversions
13
22
First Downs Attempts
19
59.09
4th down %
68.42
69
Total Penalties
69
617
Total Penalty Yards
572
15273
Possession Time Seconds
14476
0.00
Red Zone Field Goal Percentage
0.00
0.00
Red Zone Scoring Percentage
0.00
0.00
Red Zone Efficiency Percentage
0.00
0.00
Red Zone Touchdown Percentage
0.00
15
Total Takeaways
12
11
Total Giveaways
11
4
Turnover Ratio
1
0
Fumbles Lost
0
57-145
3rd down efficiency
57-136
13-22
4th down efficiency
13-19
69-617
Total-Yards
69-572
Defense
385
Solo Tackles
405
210
Assist Tackles
184
595
Total Tackles
589
37
Sacks
23
233
Sack Yards
118
98
Stuffs
84
40
Passes Defended
32
11.2
Average Interception Yards
6.1
42
Long Interception
29
0
Miscellaneous Touchdowns
0
1
Kicks Blocked
3
69
Tackles For Loss
49
9
Team Games Played
9
Defensive Interceptions
9
Interceptions
10
101
Interception Yards
61
1
Interception Touchdowns
1
9-101
INT: Total
10-61
General
9
Fumbles
9
5
Forced Fumbles
4
8
Fumbles Recovered
5
0
Fumbles Touchdowns
0
9
Games Played
9
9-0
Fumbles-Lost
9-0
Returning
9
Kick Returns
7
238
Kick Return Yards
145
26.4
Yards Per Kick Return
20.7
51
Long Kick Return
31
0
Kick Return Touchdowns
0
19
Punt Returns
7
204
Punt Return Yards
12
10.7
Yards Per Punt Return
1.7
36
Long Punt Return
38
0
Punt Return Touchdowns
1
0
Punt Return Fair Catches
0
0
Kick Return Fumbles Lost
0
0
Punt Return Fumbles Lost
0
9
Team Games Played
9
19-204
Punt: Total
7-12
Kicking
15
Field Goal Made
10
21
Field Goal Attempts
12
71.4
Field Goal Percentage
83.3
54
Long Field Goal Made
55
0
Field Goal Attempts 1-19
0
6
Field Goal Attempts 20-29
2
5
Field Goal Attempts 30-39
2
8
Field Goal Attempts 40-49
6
2
Field Goal Attempts 50+
2
32
Extra Points Made
23
33
Extra Point Attempts
25
97.0
Extra Point Percentage
92.0
0
Field Goals Made 1-19
0
6
Field Goals Made 20-29
2
4
Field Goals Made 30-39
2
4
Field Goals Made 40-49
5
1
Field Goals Made 50+
1
77
Total Kicking Points
53
9
Team Games Played
9
57
Touchback Percentage
83
0.0
Average Kickoff Return Yards
0.0
0
Kickoff Return Yards
0
0
Kickoff Returns
0
0-0
Kickoffs: Total
0-0
15-21
FG: Good-Attempts
10-12
Punting
37
Punts
43
1,781
Punt Yards
1,819
72
Long Punt
69
48.1
Gross Average Punt Yards
42.3
48.1
Net Average Punt Yards
42.3
0
Punts Blocked
0
13
Punts Inside 20
17
8
Touchbacks
1
16
Fair Catches
17
7
Punt Returns
8
0
Punt Return Yards
0
0.0
Average Punt Return Yards
0.0
9
Team Games Played
9
37-1,781
Punt: Total Yards
43-1,819
Scoring
13
Rushing Touchdowns
12
21
Receiving Touchdowns
13
0
Return Touchdowns
1
34
Total Touchdowns
26
15
Field Goals
10
32
Kick Extra Points
23
0
Total Two Point Conversions
1
287
Total Points
219
31.9
Total Points Per Game
24.3