

Bowling Green vs Iowa State Live Score (19 Sep, 2026)
Score by Quarter
| Team | Q1 | Q2 | Q3 | Q4 | Final |
|---|---|---|---|---|---|
 Bowling Green | 7 | 0 | 0 | 0 | 7 |
 Iowa State | 21 | 14 | 10 | 10 | 55 |
Scoring Plays
Q1
5:28
5:28
Jamal Polite Jr. 34 Yd pass from Jaylen Raynor (Kyle Konrardy Kick)
Passing Touchdown
0 – 7
Q1
3:58
3:58
Winn Sharp 59 Yd pass from Jay Kastantin (Travis Kenner Kick)
Passing Touchdown
7 – 7
Q1
3:45
3:45
Cameron Pettaway 100 Yd Kickoff Return (Kyle Konrardy Kick)
Kickoff Return Touchdown
7 – 14
Q1
0:19
0:19
Aiden Flora 61 Yd Run (Kyle Konrardy Kick)
Rushing Touchdown
7 – 21
Q2
9:47
9:47
Arnold Barnes III 3 Yd Run (Kyle Konrardy Kick)
Rushing Touchdown
7 – 28
Q2
5:12
5:12
Aiden Flora 42 Yd Run (Kyle Konrardy Kick)
Rushing Touchdown
7 – 35
Q3
9:16
9:16
Kyle Konrardy 39 Yd Field Goal
Field Goal Good
7 – 38
Q3
8:07
8:07
Aiden Flora 66 Yd Punt Return (Kyle Konrardy Kick)
Punt Return
7 – 45
Q4
8:27
8:27
Arnold Barnes III 8 Yd Run (Kyle Konrardy Kick)
Rushing Touchdown
7 – 52
Q4
2:22
2:22
Kyle Konrardy 40 Yd Field Goal
Field Goal Good
7 – 55
Game Leaders
Bowling GreenIowa State
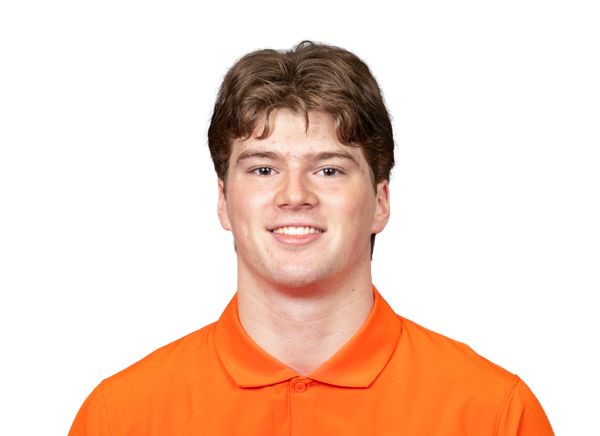 J. Kastantin QB
Passing Yards
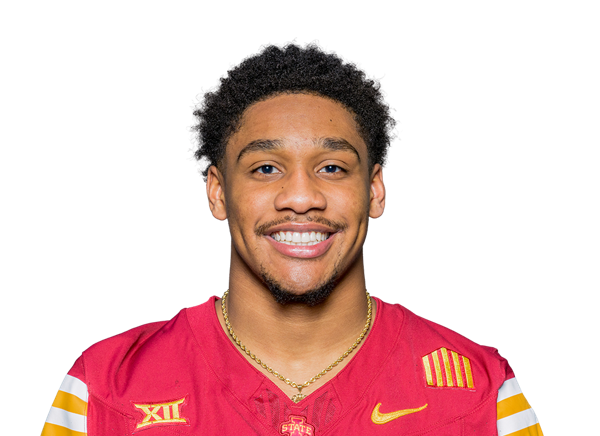 J. Raynor QB
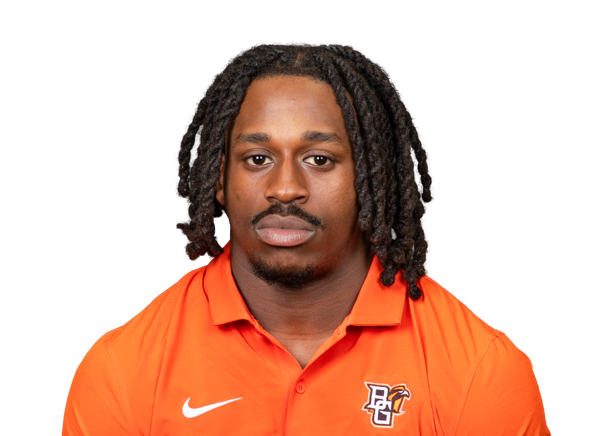 K. Baldwin RB
Rushing Yards
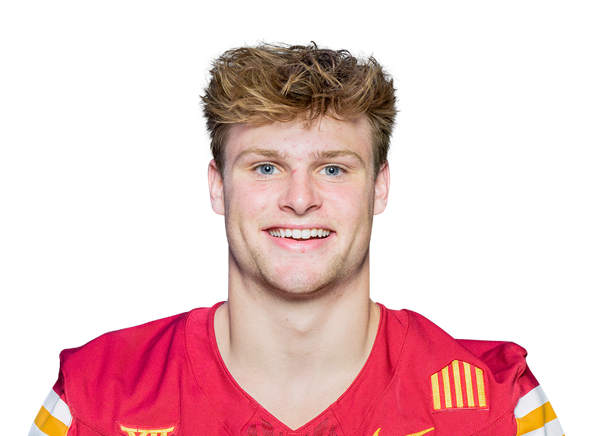 A. Flora RB
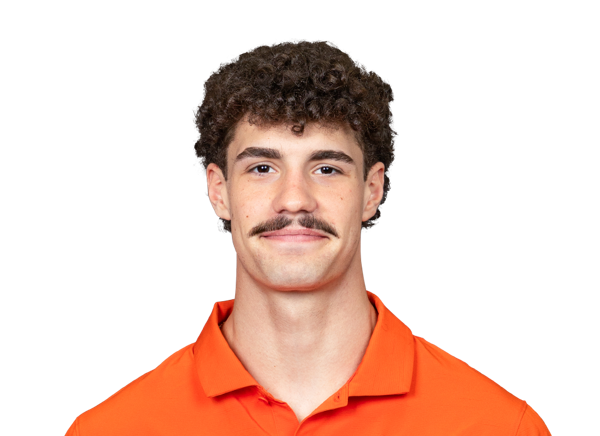 W. Sharp WR
Receiving Yards
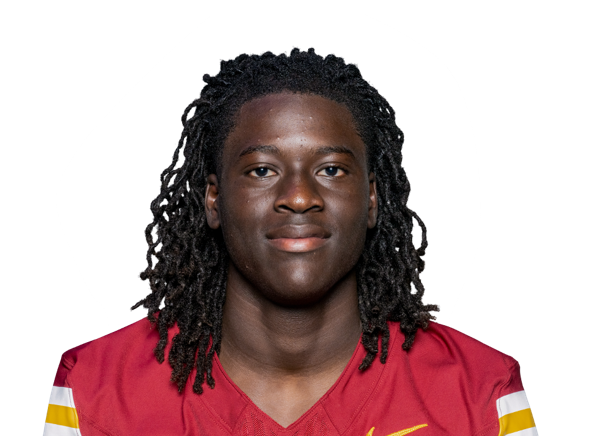 J. Polite Jr. WR
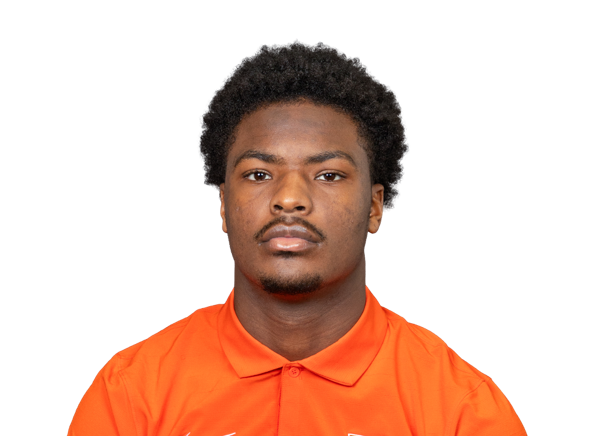 C. Lewis LB
Sacks
—
 D. Pringle LB
Tackles
 C. Willich LB
Player Box Score
Bowling Green| Player | C/ATT | YDS | AVG | TD | INT | QBR |
|---|---|---|---|---|---|---|
| Jay Kastantin#17 | 8/17 | 97 | 5.7 | 1 | 1 | 4.1 |
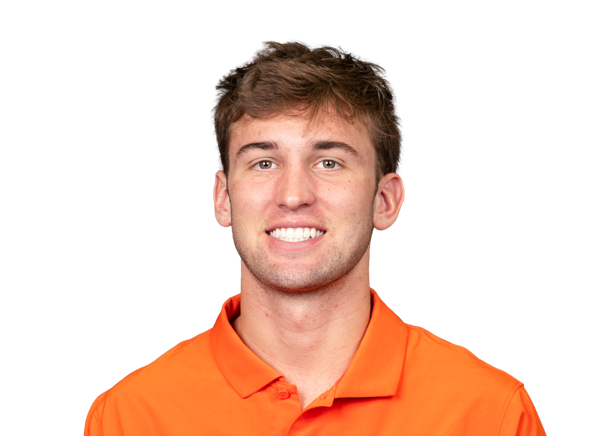 Austin Novosad#16 | 1/5 | -1 | -0.2 | 0 | 0 | 7.6 |
Iowa State| Player | C/ATT | YDS | AVG | TD | INT | QBR |
|---|---|---|---|---|---|---|
| Jaylen Raynor#1 | 11/17 | 133 | 7.8 | 1 | 1 | 44.6 |
 Connor Moberly#5 | 1/1 | 9 | 9.0 | 0 | 0 | -- |
Bowling Green| Player | CAR | YDS | AVG | TD | LONG |
|---|---|---|---|---|---|
| Ke'Marion Baldwin#4 | 6 | 38 | 6.3 | 0 | 17 |
 Austyn Dendy#1 | 11 | 37 | 3.4 | 0 | 14 |
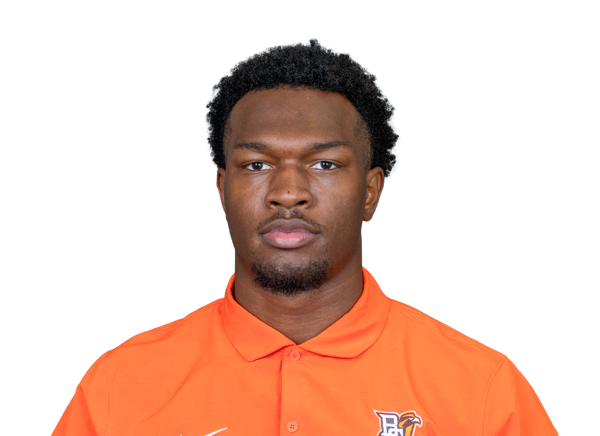 Tristin Blackmon#33 | 3 | 13 | 4.3 | 0 | 6 |
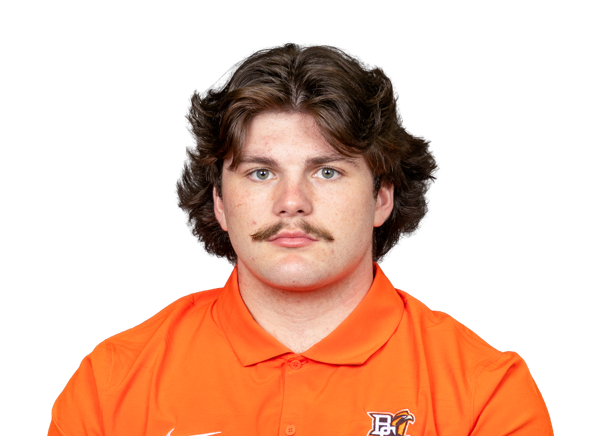 Leo Kemp#44 | 2 | 5 | 2.5 | 0 | 5 |
 Nakai Amachree#2 | 4 | 3 | 0.8 | 0 | 2 |
| Jay Kastantin#17 | 1 | 0 | 0.0 | 0 | 0 |
 Team | 1 | -2 | -2.0 | 0 | 0 |
 Marceles Carey#20 | 2 | -4 | -2.0 | 0 | 0 |
Iowa State| Player | CAR | YDS | AVG | TD | LONG |
|---|---|---|---|---|---|
| Aiden Flora#21 | 12 | 194 | 16.2 | 2 | 61 |
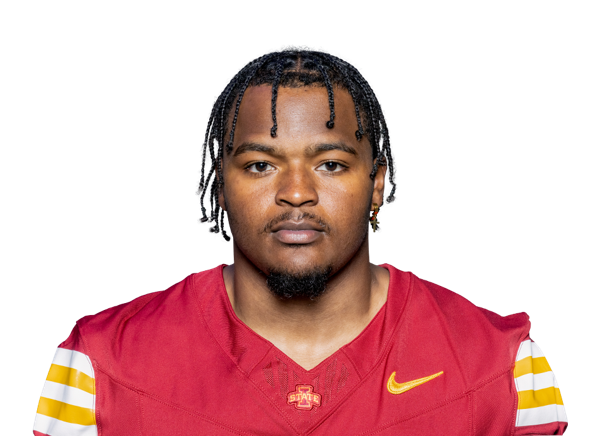 Arnold Barnes III#3 | 13 | 63 | 4.8 | 2 | 10 |
| Jaylen Raynor#1 | 6 | 60 | 10.0 | 0 | 35 |
| Connor Moberly#5 | 5 | 21 | 4.2 | 0 | 14 |
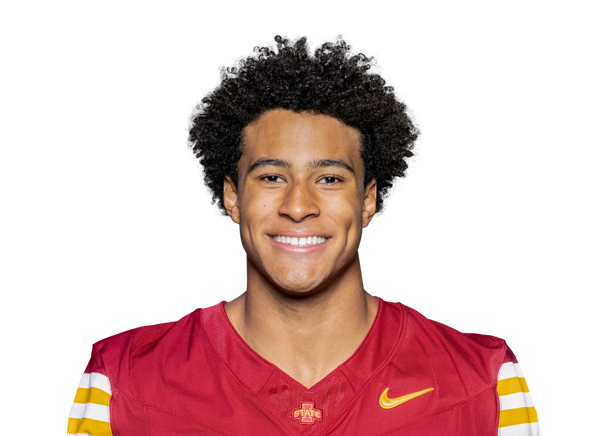 Caleb Francois#20 | 5 | 16 | 3.2 | 0 | 8 |
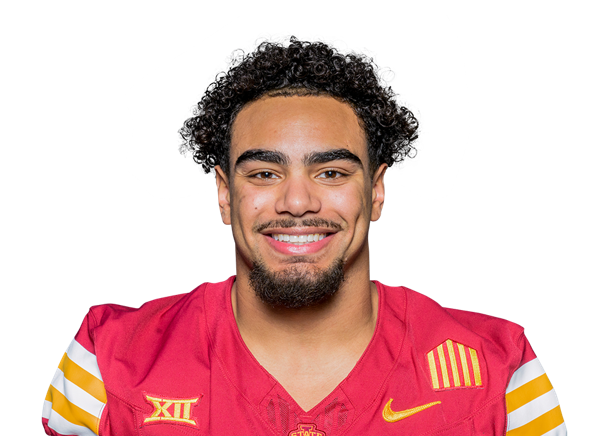 Cameron Pettaway | 4 | 12 | 3.0 | 0 | 4 |
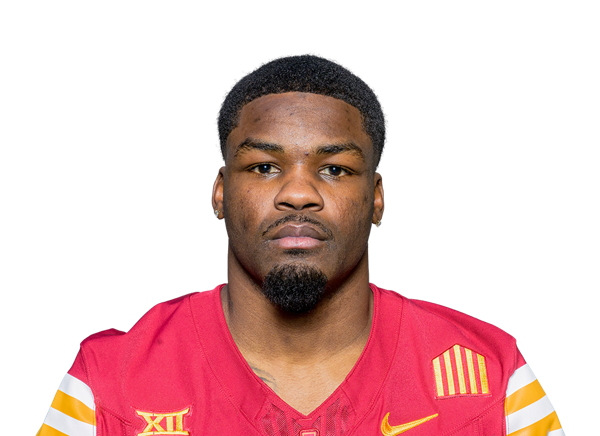 Omari Hayes#9 | 1 | -1 | -1.0 | 0 | 0 |
Bowling Green| Player | REC | YDS | AVG | TD | LONG |
|---|---|---|---|---|---|
| Winn Sharp#18 | 1 | 59 | 59.0 | 1 | 59 |
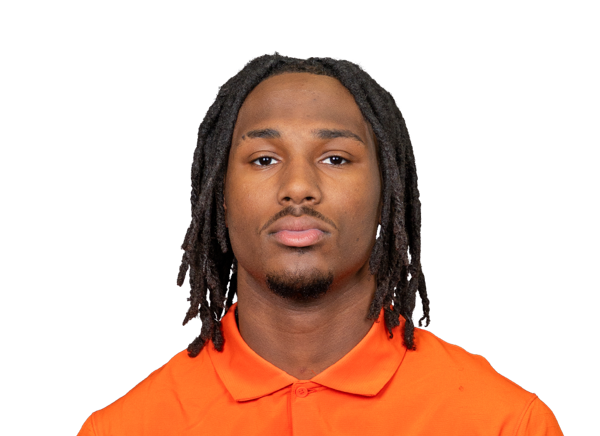 Jeremiah Scoby | 2 | 17 | 8.5 | 0 | 20 |
| Nakai Amachree#2 | 3 | 11 | 3.7 | 0 | 11 |
 Brennan Ridley#5 | 1 | 7 | 7.0 | 0 | 7 |
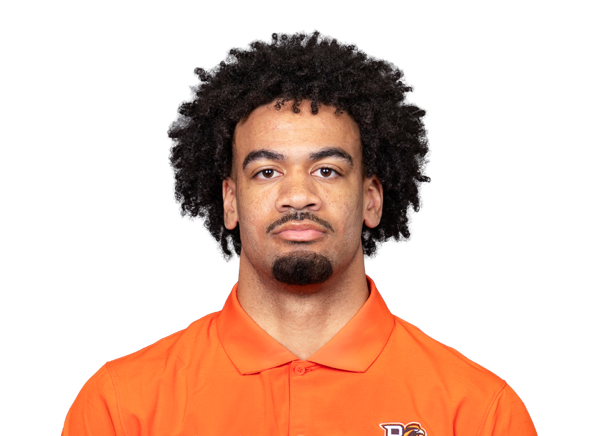 Trey Johnson#3 | 1 | 5 | 5.0 | 0 | 5 |
 Eli Jacon-Duffy#8 | 1 | -3 | -3.0 | 0 | 0 |
Iowa State| Player | REC | YDS | AVG | TD | LONG |
|---|---|---|---|---|---|
| Jamal Polite Jr.#13 | 1 | 34 | 34.0 | 1 | 34 |
 Ty Claiborne#89 | 2 | 28 | 14.0 | 0 | 17 |
| Cameron Pettaway | 3 | 27 | 9.0 | 0 | 12 |
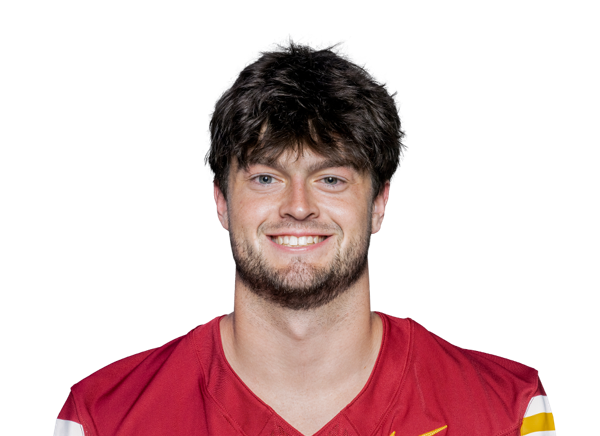 Vince Benetti#37 | 1 | 20 | 20.0 | 0 | 20 |
 Dominic Overby#11 | 2 | 15 | 7.5 | 0 | 11 |
| Aiden Flora#21 | 2 | 10 | 5.0 | 0 | 11 |
| Omari Hayes#9 | 1 | 8 | 8.0 | 0 | 8 |
Bowling Green| Player | TOT | SOLO | SACKS | TFL | PD | QB HUR | TD |
|---|---|---|---|---|---|---|---|
| Dorian Pringle#3 | 9 | 5 | 0 | 0 | 0 | 0 | 0 |
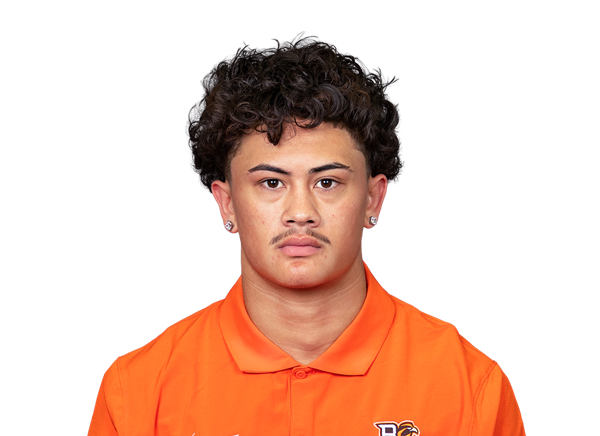 Preston EstoEsta#9 | 8 | 5 | 0 | 0.5 | 0 | 0 | 0 |
| Cashmire Lewis#8 | 7 | 5 | 1 | 1 | 0 | 0 | 0 |
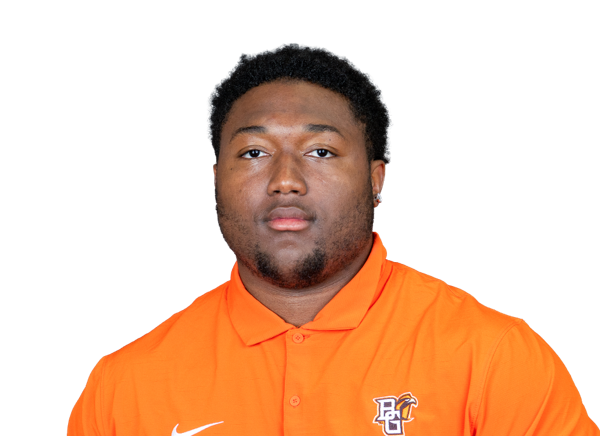 Eriq George#5 | 7 | 2 | 0 | 1 | 0 | 0 | 0 |
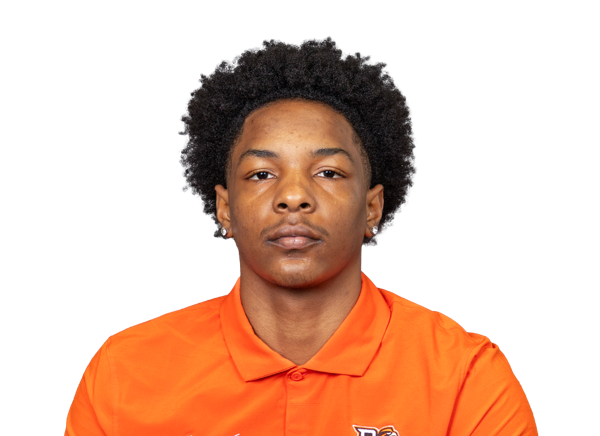 Drey Braxton#1 | 4 | 4 | 0 | 0 | 0 | 0 | 0 |
 Mike Wright III#7 | 4 | 3 | 0 | 0 | 0 | 0 | 0 |
 Selah Brown#88 | 4 | 2 | 0 | 0 | 0 | 0 | 0 |
 Kal-El Pascal | 4 | 2 | 0 | 0.5 | 0 | 0 | 0 |
 Elijah Durham-Smith#52 | 3 | 3 | 0 | 0 | 0 | 0 | 0 |
 AJ Odom#44 | 3 | 2 | 0 | 0 | 0 | 0 | 0 |
 Kade Kostus#4 | 3 | 1 | 0 | 0.5 | 0 | 0 | 0 |
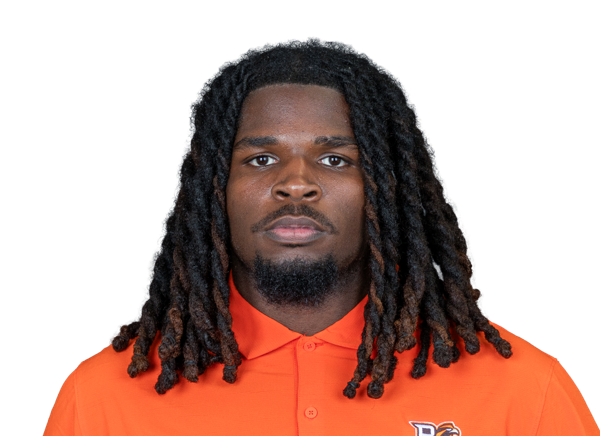 Sanders Ellis#6 | 3 | 0 | 0 | 0.5 | 0 | 0 | 0 |
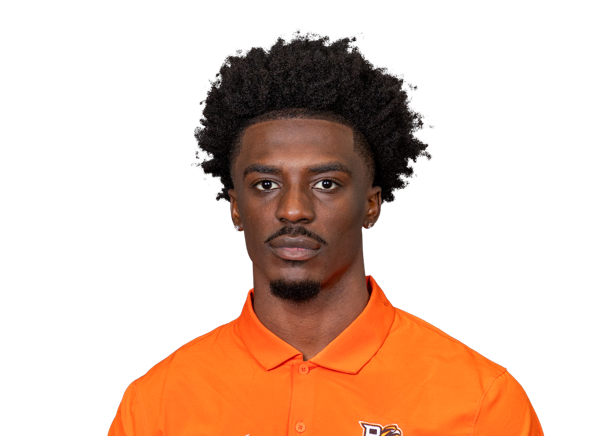 Nick Sawyer#18 | 2 | 2 | 0 | 0 | 0 | 0 | 0 |
 Josira Andrews#26 | 2 | 1 | 0 | 0 | 0 | 0 | 0 |
 Andrew Hines III#10 | 2 | 0 | 0 | 0 | 1 | 0 | 0 |
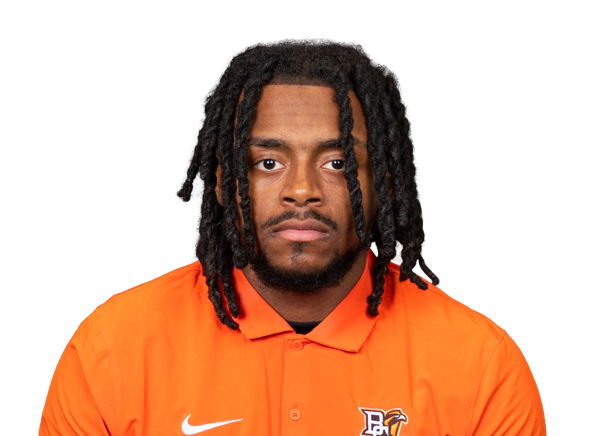 Armhan Hale#11 | 2 | 0 | 0 | 0 | 0 | 0 | 0 |
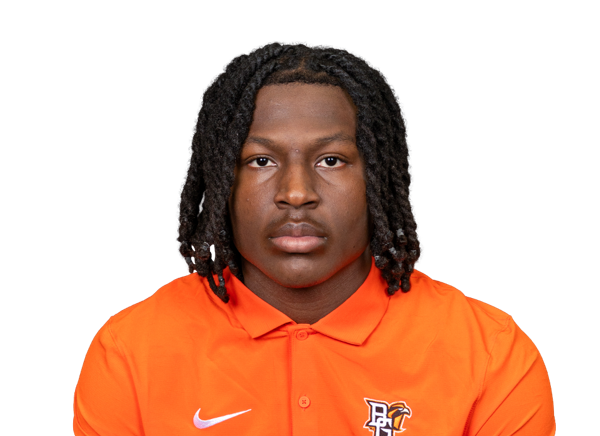 Jahai Johnson#19 | 1 | 1 | 0 | 0 | 0 | 0 | 0 |
 Dior Garner#54 | 1 | 0 | 0 | 0 | 0 | 0 | 0 |
 Kore Thomas#58 | 1 | 0 | 0 | 0 | 0 | 0 | 0 |
Iowa State| Player | TOT | SOLO | SACKS | TFL | PD | QB HUR | TD |
|---|---|---|---|---|---|---|---|
| Carson Willich#10 | 6 | 3 | 0 | 1 | 0 | 1 | 0 |
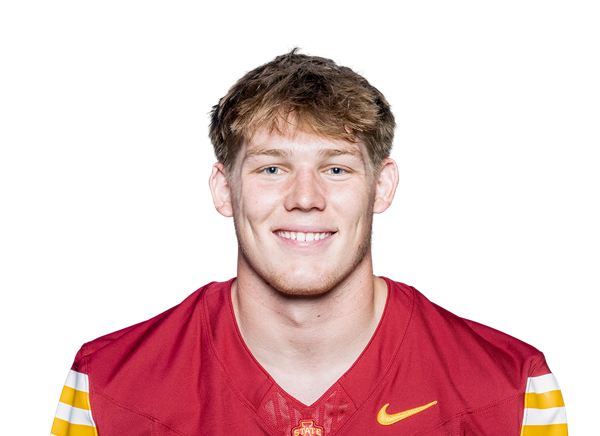 Sullivan Schlimgen#7 | 5 | 2 | 0 | 1 | 0 | 0 | 0 |
 Willie Breland III#11 | 3 | 3 | 0 | 1 | 1 | 0 | 0 |
 Jack Janikowski#93 | 3 | 2 | 0 | 0 | 0 | 0 | 0 |
 Connor Welsch#17 | 2 | 2 | 0 | 0 | 0 | 0 | 0 |
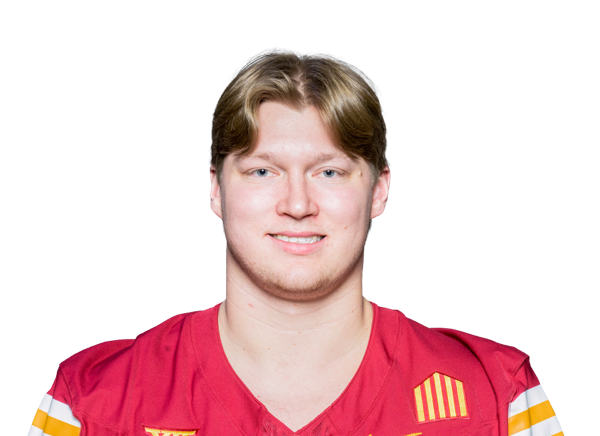 Max Baloun#97 | 2 | 1 | 0 | 0.5 | 0 | 0 | 0 |
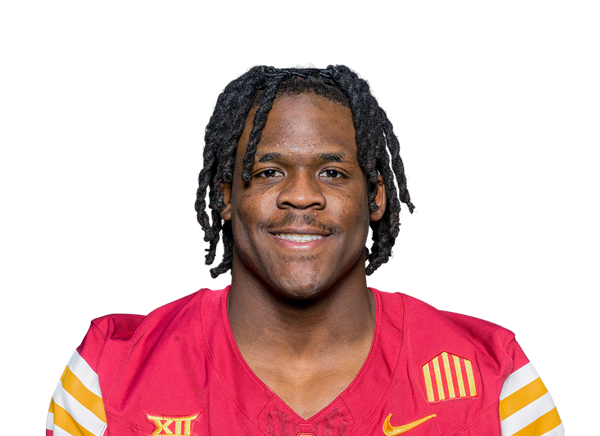 Montreze Smith Jr.#31 | 2 | 1 | 0 | 0 | 0 | 0 | 0 |
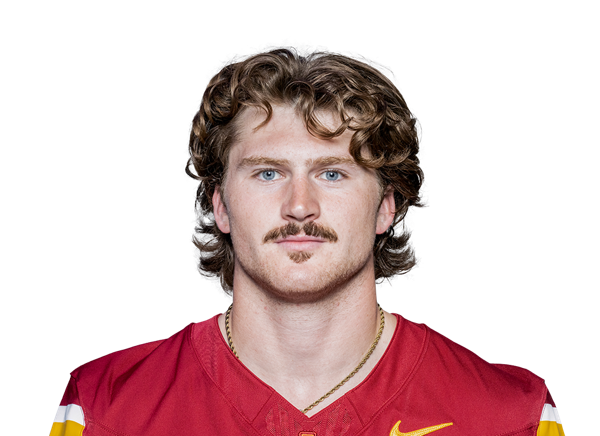 Beau Goodwin#34 | 2 | 1 | 0 | 0 | 1 | 0 | 0 |
 Seth Johnson#3 | 2 | 1 | 0 | 0 | 1 | 0 | 0 |
 Donovan Fitzmaurice#89 | 2 | 1 | 0 | 0 | 0 | 0 | 0 |
 Bryson Lamb#99 | 2 | 0 | 0 | 0.5 | 0 | 0 | 0 |
 Micah Harper#4 | 1 | 1 | 0 | 0 | 0 | 0 | 0 |
 Malcolm Jones#16 | 1 | 1 | 0 | 0 | 0 | 0 | 0 |
 Eddie Lemos#19 | 1 | 1 | 0 | 1 | 0 | 0 | 0 |
 Duhron Goodman#21 | 1 | 1 | 0 | 0 | 0 | 0 | 0 |
 Jareb Ramos#90 | 1 | 1 | 0 | 0 | 0 | 0 | 0 |
 Zaimir Hawk | 1 | 1 | 0 | 0 | 0 | 0 | 0 |
 Rylan Barnes#41 | 1 | 1 | 0 | 0 | 0 | 0 | 0 |
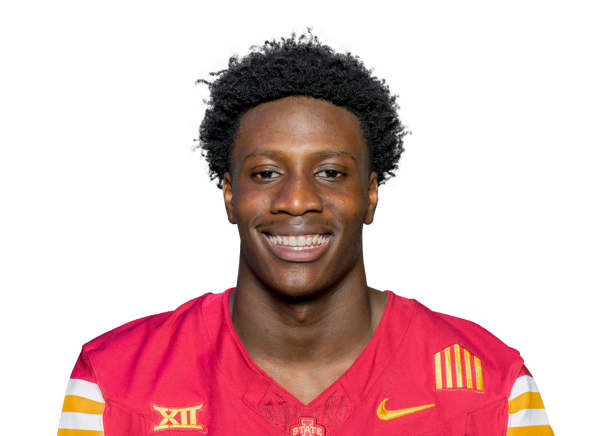 David Coffey#18 | 1 | 1 | 0 | 1 | 0 | 0 | 0 |
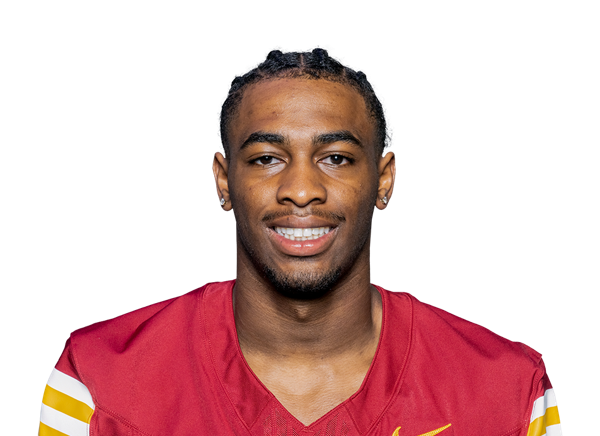 Tyrone Cotton III#26 | 1 | 1 | 0 | 0 | 0 | 0 | 0 |
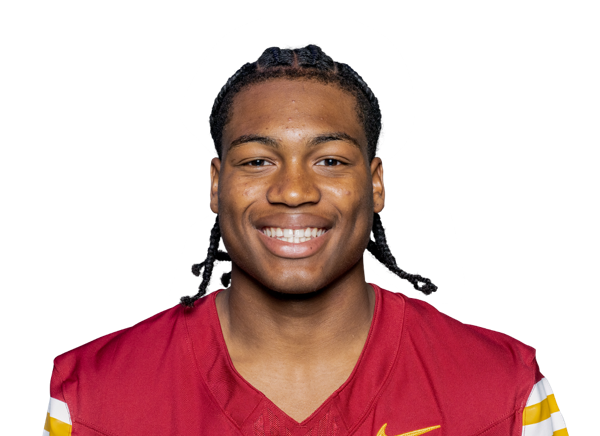 Matthew McClain#42 | 1 | 1 | 0 | 0 | 0 | 0 | 0 |
 Tristan Exline#8 | 1 | 1 | 0 | 0 | 0 | 0 | 0 |
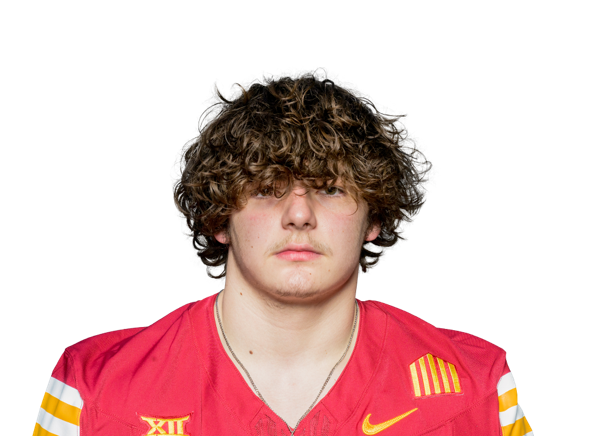 Blake Hawkins#91 | 1 | 1 | 0 | 0 | 0 | 1 | 0 |
 Jace Gilbert#55 | 1 | 0 | 0 | 0 | 1 | 2 | 0 |
 Brody Miller#24 | 1 | 0 | 0 | 0 | 0 | 0 | 0 |
| Cameron Pettaway | 0 | 0 | 0 | 0 | 0 | 0 | 1 |
| Aiden Flora#21 | 0 | 0 | 0 | 0 | 0 | 0 | 1 |
Bowling Green| Player | FUM | LOST | REC |
|---|---|---|---|
| Jay Kastantin#17 | 1 | 1 | 0 |
Iowa State| Player | FUM | LOST | REC |
|---|---|---|---|
| Vince Benetti#37 | 1 | 0 | 0 |
| Sullivan Schlimgen#7 | 0 | 0 | 1 |
Bowling Green| Player | FG | PCT | LONG | XP | PTS |
|---|---|---|---|---|---|
 Travis Kenner#12 | 0/0 | 0.0 | 0 | 1/1 | 1 |
Iowa State| Player | FG | PCT | LONG | XP | PTS |
|---|---|---|---|---|---|
 Kyle Konrardy#97 | 2/3 | 67.0 | 40 | 7/7 | 13 |
Bowling Green| Player | NO | YDS | AVG | TB | In 20 | LONG |
|---|---|---|---|---|---|---|
 Ryan Kingston#30 | 9 | 389 | 43.2 | 1 | 2 | 62 |
Iowa State| Player | NO | YDS | AVG | TB | In 20 | LONG |
|---|---|---|---|---|---|---|
 Ethan Gurney#95 | 1 | 38 | 38.0 | 0 | 0 | 38 |
Bowling Green| Player | NO | YDS | AVG | LONG | TD |
|---|---|---|---|---|---|
| Nakai Amachree#2 | 2 | 39 | 19.5 | 23 | 0 |
Iowa State| Player | NO | YDS | AVG | LONG | TD |
|---|---|---|---|---|---|
| Cameron Pettaway | 1 | 100 | 100.0 | 100 | 1 |
 Carter Pabst#4 | 1 | 14 | 14.0 | 14 | 0 |
Iowa State| Player | NO | YDS | AVG | LONG | TD |
|---|---|---|---|---|---|
| Aiden Flora#21 | 3 | 92 | 30.7 | 66 | 1 |
 Carson Robbins#23 | 1 | 9 | 9.0 | 9 | 0 |
| Omari Hayes#9 | 1 | 1 | 1.0 | 1 | 0 |
Bowling Green| Player | INT | YDS | TD |
|---|---|---|---|
| Drey Braxton#1 | 1 | 0 | 0 |
Iowa State| Player | INT | YDS | TD |
|---|---|---|---|
| Beau Goodwin#34 | 1 | 7 | 0 |
Drive Summary
BGSU
Punt
21
ISU
Missed FG
38
BGSU
Punt
2
ISU
Touchdown
80
BGSU
Touchdown
75
ISU
Touchdown
0
BGSU
Punt
15
ISU
Interception
17
BGSU
Punt
1
ISU
Touchdown
61
BGSU
Fumble
31
ISU
Touchdown
56
BGSU
Punt
0
ISU
Touchdown
58
BGSU
Interception
0
ISU
Downs
38
BGSU
End of Half
-2
ISU
Field Goal
46
BGSU
Punt Touchdown
-7
BGSU
Punt
23
ISU
Punt
7
BGSU
Punt
15
ISU
Touchdown
92
BGSU
Punt
-13
ISU
Field Goal
19
BGSU
End of Game
13
Injury Report
No current injury report is available for this matchup.
Head-to-Head
Historical meetings are not available for this matchup.
Game Information
StageWeek 3
Season2026
KickoffSat, Sep 19, 12:00 pm
VenueJack Trice Stadium
LocationAmes, IA
SurfaceGrass
BroadcastESPNU
Attendance50,395
Division Standings
FBS — Mid-American Conference
| Team | W | L | T | Pct | PF | PA | Home | Away | Strk |
|---|---|---|---|---|---|---|---|---|---|
 Eastern Michigan | 4 | 5 | 0 | 0.444 | 192 | 231 | 2-2 | 2-3 | L2 |
 Massachusetts | 4 | 4 | 0 | 0.500 | 212 | 169 | 2-2 | 2-2 | L4 |
 Central Michigan | 3 | 5 | 0 | 0.375 | 143 | 207 | 3-2 | 0-3 | L3 |
 Toledo | 6 | 2 | 0 | 0.750 | 299 | 203 | 4-1 | 2-1 | W2 |
 Ohio | 6 | 2 | 0 | 0.750 | 237 | 175 | 4-0 | 2-2 | W5 |
 Western Michigan | 6 | 3 | 0 | 0.667 | 236 | 173 | 3-1 | 3-2 | W1 |
 Akron | 1 | 7 | 0 | 0.125 | 152 | 262 | 1-2 | 0-5 | L6 |
 Ball State | 3 | 5 | 0 | 0.375 | 176 | 282 | 2-1 | 1-4 | W2 |
 Buffalo | 5 | 3 | 0 | 0.625 | 181 | 203 | 4-1 | 1-2 | W3 |
 Kent State | 3 | 6 | 0 | 0.333 | 129 | 275 | 3-1 | 0-5 | L1 |
 Miami (OH) | 5 | 3 | 0 | 0.625 | 216 | 206 | 3-1 | 2-2 | W3 |
| Bowling Green | 2 | 7 | 0 | 0.222 | 160 | 261 | 1-3 | 1-4 | L3 |
 Sacramento State | 2 | 7 | 0 | 0.222 | 153 | 273 | 2-3 | 0-4 | W1 |
FBS — Big 12 Conference
| Team | W | L | T | Pct | PF | PA | Home | Away | Strk |
|---|---|---|---|---|---|---|---|---|---|
 Texas Tech | 7 | 1 | 0 | 0.875 | 285 | 169 | 5-0 | 2-1 | W1 |
 BYU | 7 | 1 | 0 | 0.875 | 259 | 150 | 5-0 | 2-1 | W1 |
 Arizona State | 4 | 4 | 0 | 0.500 | 236 | 236 | 3-1 | 1-3 | L1 |
 Cincinnati | 5 | 3 | 0 | 0.625 | 273 | 234 | 5-1 | 0-2 | L1 |
 Kansas State | 4 | 4 | 0 | 0.500 | 254 | 175 | 4-1 | 0-3 | L2 |
 Utah | 8 | 0 | 0 | 1.000 | 311 | 127 | 5-0 | 3-0 | W8 |
 Colorado | 3 | 5 | 0 | 0.375 | 168 | 235 | 2-2 | 1-3 | W1 |
 West Virginia | 5 | 3 | 0 | 0.625 | 287 | 258 | 3-2 | 2-1 | W2 |
| Iowa State | 4 | 4 | 0 | 0.500 | 232 | 218 | 4-1 | 0-3 | W1 |
 Baylor | 5 | 3 | 0 | 0.625 | 245 | 122 | 3-1 | 2-2 | W1 |
 Oklahoma State | 5 | 3 | 0 | 0.625 | 329 | 217 | 4-0 | 1-3 | L1 |
 TCU | 4 | 4 | 0 | 0.500 | 186 | 113 | 3-3 | 1-1 | W1 |
 UCF | 4 | 4 | 0 | 0.500 | 238 | 202 | 4-1 | 0-3 | L1 |
 Houston | 6 | 2 | 0 | 0.750 | 288 | 168 | 4-0 | 2-2 | L1 |
 Arizona | 6 | 2 | 0 | 0.750 | 279 | 151 | 4-0 | 2-2 | L1 |
 Kansas | 3 | 5 | 0 | 0.375 | 233 | 190 | 3-2 | 0-3 | L1 |
Bowling Green
9th in MAC
VS
Iowa State
9th in Big 12
Quarterbacks & Specialists
#17
Jay Kastantin
#30
Ryan Kingston
#16
Austin Novosad
Receivers & Backs
#2
Nakai Amachree
#4
Ke'Marion Baldwin
#33
Tristin Blackmon
#20
Marceles Carey
#1
Austyn Dendy
#8
Eli Jacon-Duffy
#3
Trey Johnson
#44
Leo Kemp
#5
Brennan Ridley
Jeremiah Scoby
#18
Winn Sharp
Defensive Line & Linebackers
#88
Selah Brown
#52
Elijah Durham-Smith
#6
Sanders Ellis
#54
Dior Garner
#5
Eriq George
#10
Andrew Hines III
#4
Kade Kostus
#8
Cashmire Lewis
#44
AJ Odom
#3
Dorian Pringle
#58
Kore Thomas
Defensive Backs
#26
Josira Andrews
#1
Drey Braxton
#9
Preston EstoEsta
#11
Armahn Hale
#19
Jahai Johnson
Kal-El Pascal
#18
Nick Sawyer
#7
Mike Wright III
Other
#12
Travis Kenner
Quarterbacks & Specialists
#95
Ethan Gurney
#5
Connor Moberly
#1
Jaylen Raynor
Receivers & Backs
#41
Rylan Barnes
#3
Arnold Barnes III
#37
Vince Benetti
#89
Ty Claiborne
#21
Aiden Flora
#20
Caleb Francois
#9
Omari Hayes
#11
Dominic Overby
#4
Carter Pabst
Cameron Pettaway
#13
Jamal Polite Jr.
#23
Carson Robbins
Defensive Line & Linebackers
#97
Max Baloun
#11
Willie Breland III
#8
Tristan Exline
#89
Donovan Fitzmaurice
#55
Jace Gilbert
#34
Beau Goodwin
Zaimir Hawk
#91
Blake Hawkins
#93
Jack Janikowski
#16
Malcolm Jones
#99
Bryson Lamb
#90
Jareb Ramos
#7
Sullivan Schlimgen
#31
Montreze Smith Jr.
#17
Connor Welsch
#10
Carson Willich
Defensive Backs
#18
David Coffey
#26
Tyrone Cotton III
#21
Duhron Goodman
#4
Micah Harper
#3
Seth Johnson
#19
Eddie Lemos
#42
Matthew McClain
#24
Brody Miller
Other
#97
Kyle Konrardy
Bowling Green
8th in MAC
VS
Iowa State
8th in Big 12
Passing
65.7
Completion Percentage
58.9
153
Completions
122
3.90
Interception Percentage
2.40
9
Interceptions
5
77
Longest Pass
53
1,587
Net Passing Yards
1,547
176.3
Net Passing Yards Per Game
193.4
233
Passing Attempts
207
4.70
Passing Touchdown %
5.80
11
Passing Touchdowns
12
130.6
Passer Rating
136.2
18
Total Sacks
15
87
Sack Yards Lost
87
6.8
Yards Per Pass Attempt
7.5
1,587
Passing Yards
1,547
0
Passing Fumbles Lost
0
9
Team Games Played
8
286.2
Yards Per Game
370.0
17.8
Total Points Per Game
29.0
160
Total Points
232
19
Total Touchdowns
28
176.3
Passing Yards Per Game
193.4
153-233
Comp-Att
122-207
18-87
Sacks-Yards Lost
15-87
Rushing
297
Rushing Attempts
293
989
Rushing Yards
1,413
3.3
Yards Per Rush Attempt
4.8
30
Long Rushing
75
0
20+ Yard Rushing Plays
0
6
Rushing Touchdowns
14
109.9
Rushing Yards Per Game
176.6
0
Rushing Fumbles
0
0
Rushing Fumbles Lost
0
55
Rushing 1st downs
73
9
Team Games Played
8
2,576
Total Yards
2,960
548
Total Offensive Plays
515
17.8
Total Points Per Game
29.0
160
Total Points
232
19
Total Touchdowns
28
Receiving
153
Receptions
122
0
Receiving Targets
0
1,587
Receiving Yards
1,547
1,587
Receiving Yards
1,547
11
Receiving Touchdowns
12
77
Long Reception
53
0
20+ Yard Receiving Plays
0
176.3
Receiving Yards Per Game
193.4
0
Receiving Fumbles
0
0
Receiving Fumbles Lost
0
755
Receiving Yards After Catch
573
76
Receiving First Downs
63
9
Team Games Played
8
10.4
Yards Per Reception
12.7
17.8
Total Points Per Game
29.0
160
Total Points
232
19
Total Touchdowns
28
Miscellaneous
149
Total 1st downs
153
55
Rushing 1st downs
73
76
Passing 1st downs
63
18
1st downs by penalty
17
46
Third Down Conversions
33
115
Third Down Attempts
100
40.00
3rd down %
33.00
4
Fourth Down Conversions
6
9
First Downs Attempts
13
44.44
4th down %
46.15
48
Total Penalties
45
429
Total Penalty Yards
387
16702
Possession Time Seconds
14598
0.00
Red Zone Field Goal Percentage
0.00
0.00
Red Zone Scoring Percentage
0.00
0.00
Red Zone Efficiency Percentage
0.00
0.00
Red Zone Touchdown Percentage
0.00
19
Total Takeaways
12
13
Total Giveaways
7
6
Turnover Ratio
5
0
Fumbles Lost
0
46-115
3rd down efficiency
33-100
4-9
4th down efficiency
6-13
48-429
Total-Yards
45-387
Defense
292
Solo Tackles
273
298
Assist Tackles
244
590
Total Tackles
517
22
Sacks
10
135
Sack Yards
78
71
Stuffs
51
22
Passes Defended
28
0.0
Average Interception Yards
4.3
0
Long Interception
7
0
Miscellaneous Touchdowns
0
0
Kicks Blocked
0
35
Tackles For Loss
28
9
Team Games Played
8
Defensive Interceptions
2
Interceptions
3
0
Interception Yards
13
0
Interception Touchdowns
0
2-0
INT: Total
3-13
General
10
Fumbles
5
9
Forced Fumbles
7
10
Fumbles Recovered
7
2
Fumbles Touchdowns
0
9
Games Played
8
10-0
Fumbles-Lost
5-0
Returning
21
Kick Returns
10
378
Kick Return Yards
281
18.0
Yards Per Kick Return
28.1
27
Long Kick Return
100
0
Kick Return Touchdowns
1
3
Punt Returns
9
17
Punt Return Yards
135
5.7
Yards Per Punt Return
15.0
10
Long Punt Return
66
0
Punt Return Touchdowns
1
0
Punt Return Fair Catches
0
0
Kick Return Fumbles Lost
0
0
Punt Return Fumbles Lost
0
9
Team Games Played
8
3-17
Punt: Total
9-135
Kicking
9
Field Goal Made
12
11
Field Goal Attempts
14
81.8
Field Goal Percentage
85.7
49
Long Field Goal Made
51
0
Field Goal Attempts 1-19
0
2
Field Goal Attempts 20-29
2
4
Field Goal Attempts 30-39
5
4
Field Goal Attempts 40-49
5
1
Field Goal Attempts 50+
2
19
Extra Points Made
28
19
Extra Point Attempts
28
100.0
Extra Point Percentage
100.0
0
Field Goals Made 1-19
0
2
Field Goals Made 20-29
2
3
Field Goals Made 30-39
5
4
Field Goals Made 40-49
4
0
Field Goals Made 50+
1
46
Total Kicking Points
64
9
Team Games Played
8
29
Touchback Percentage
89
0.0
Average Kickoff Return Yards
0.0
0
Kickoff Return Yards
0
0
Kickoff Returns
0
0-0
Kickoffs: Total
0-0
9-11
FG: Good-Attempts
12-14
Punting
45
Punts
39
1,775
Punt Yards
1,663
62
Long Punt
60
39.4
Gross Average Punt Yards
42.6
39.4
Net Average Punt Yards
42.6
0
Punts Blocked
0
13
Punts Inside 20
11
2
Touchbacks
1
8
Fair Catches
16
16
Punt Returns
14
0
Punt Return Yards
0
0.0
Average Punt Return Yards
0.0
9
Team Games Played
8
45-1,775
Punt: Total Yards
39-1,663
Scoring
6
Rushing Touchdowns
14
11
Receiving Touchdowns
12
0
Return Touchdowns
2
19
Total Touchdowns
28
9
Field Goals
12
19
Kick Extra Points
28
0
Total Two Point Conversions
0
160
Total Points
232
17.8
Total Points Per Game
29.0