

California vs Syracuse Live Score (12 Sep, 2026)
Score by Quarter
| Team | Q1 | Q2 | Q3 | Q4 | Final |
|---|---|---|---|---|---|
 California |
0 | 7 | 7 | 7 | 21 |
 Syracuse |
3 | 9 | 6 | 0 | 18 |
Scoring Plays
Q1
12:37
12:37
T. Woody 25 yd FG GOOD
Field Goal Good
0 – 3
Q2
14:44
14:44
T. Woody 33 yd FG GOOD
Field Goal Good
0 – 6
Q2
8:50
8:50
S. Angeli pass to D. Bacheyie for 23 yds, for a TD (Two-Point Conversion failed)
Passing Touchdown
0 – 12
Q2
7:15
7:15
J. Sagapolutele pass to C. Hendricks for 14 yds, for a TD (T. McGough KICK)
Passing Touchdown
7 – 12
Q3
7:15
7:15
J. Sagapolutele pass to J. King for 2 yds, for a TD (T. McGough KICK)
Passing Touchdown
14 – 12
Q3
1:38
1:38
J. Johnson run for 2 yds, for a TD (Two-Point Conversion failed)
Rushing Touchdown
14 – 18
Q4
4:51
4:51
S. Angeli pass intercepted, for a TD (T. McGough KICK)
Interception
21 – 18
Game Leaders
CaliforniaSyracuse
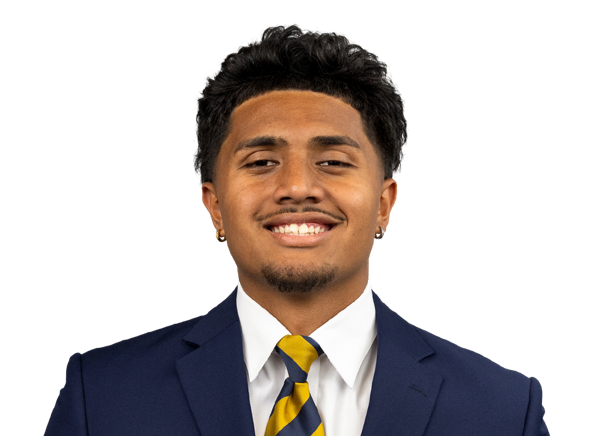 J. Sagapolutele QB
Passing Yards
 S. Angeli QB
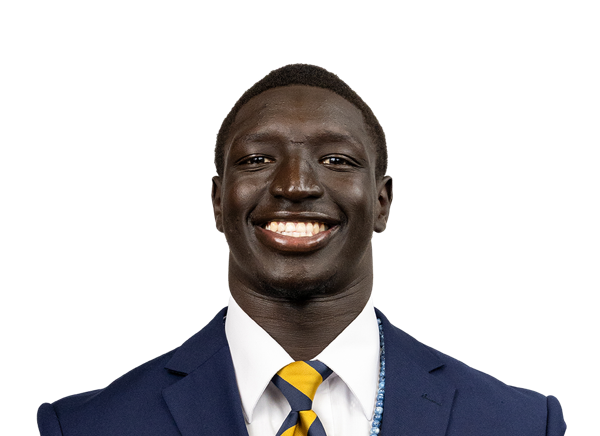 A. Mohammed RB
Rushing Yards
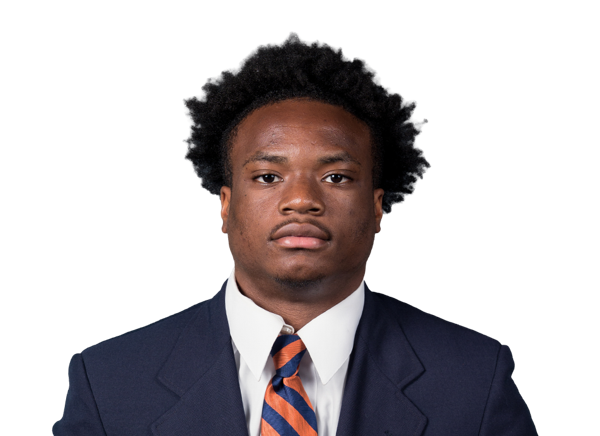 T. Hill RB
 I. Strong WR
Receiving Yards
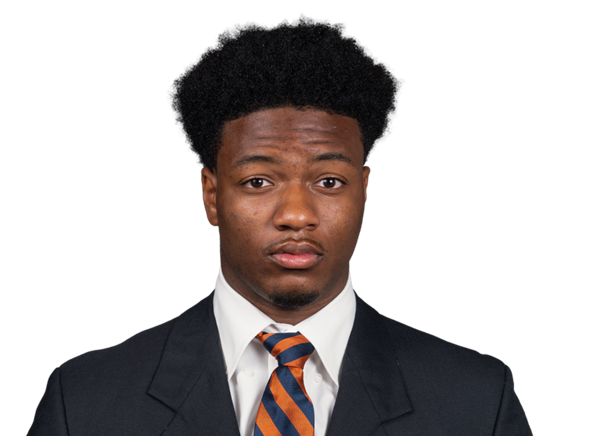 J. Ross-Simmons WR
 J. Wayne LB
Sacks
 C. D'Appolonia LB
 D. Harris DB
Tackles
C. D'Appolonia LBPlayer Box Score
California| Player | C/ATT | YDS | AVG | TD | INT |
|---|---|---|---|---|---|
| Jaron-Keawe Sagapolutele#3 | 21/34 | 182 | 5.4 | 2 | 0 |
Syracuse| Player | C/ATT | YDS | AVG | TD | INT |
|---|---|---|---|---|---|
| Steve Angeli#9 | 24/49 | 306 | 6.2 | 1 | 3 |
 Jimmy Gregg#41 | 1/1 | 12 | 12.0 | 0 | 0 |
California| Player | CAR | YDS | AVG | TD | LONG |
|---|---|---|---|---|---|
| Adam Mohammed#24 | 19 | 74 | 3.9 | 0 | 13 |
 Ashten Emory#20 | 2 | 1 | 0.5 | 0 | 1 |
 Chase Hendricks#7 | 1 | -1 | -1.0 | 0 | 0 |
 Team | 2 | -2 | -1.0 | 0 | 2 |
| Jaron-Keawe Sagapolutele#3 | 2 | -5 | -2.5 | 0 | 4 |
Syracuse| Player | CAR | YDS | AVG | TD | LONG |
|---|---|---|---|---|---|
| Tylik Hill#20 | 2 | 56 | 28.0 | 0 | 55 |
 Ju'Juan Johnson#4 | 15 | 46 | 3.1 | 1 | 10 |
| Shavane Anderson Jr.#23 | 9 | 18 | 2.0 | 0 | 8 |
 Demetres Samuel Jr.#1 | 1 | 2 | 2.0 | 0 | 2 |
 Ahmad Miller#22 | 2 | 2 | 1.0 | 0 | 1 |
| Team | 1 | -2 | -2.0 | 0 | 2 |
| Steve Angeli#9 | 6 | -4 | -0.7 | 0 | 6 |
California| Player | REC | YDS | AVG | TD | LONG |
|---|---|---|---|---|---|
| Ian Strong#9 | 3 | 64 | 21.3 | 0 | 43 |
 Mason Mini#85 | 2 | 38 | 19.0 | 0 | 38 |
| Chase Hendricks#7 | 5 | 31 | 6.2 | 1 | 14 |
 Taimane Purcell#22 | 2 | 14 | 7.0 | 0 | 8 |
| Adam Mohammed#24 | 5 | 14 | 2.8 | 0 | 6 |
 Cooper Perry#10 | 1 | 12 | 12.0 | 0 | 12 |
 Jordan King#4 | 2 | 6 | 3.0 | 1 | 4 |
 Kyion Grayes#6 | 1 | 3 | 3.0 | 0 | 3 |
Syracuse| Player | REC | YDS | AVG | TD | LONG |
|---|---|---|---|---|---|
| Justus Ross-Simmons#86 | 5 | 82 | 16.4 | 0 | 25 |
 Umari Hatcher#2 | 6 | 77 | 12.8 | 0 | 23 |
 Daunte Bacheyie#19 | 4 | 73 | 18.3 | 1 | 38 |
 Darien Williams#7 | 3 | 28 | 9.3 | 0 | 19 |
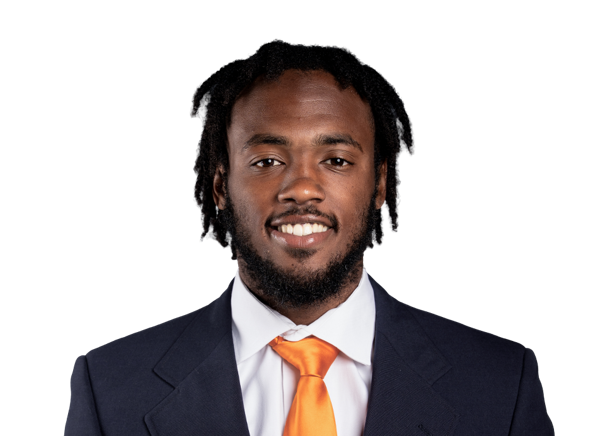 Jai Eugene Jr.#9 | 1 | 23 | 23.0 | 0 | 23 |
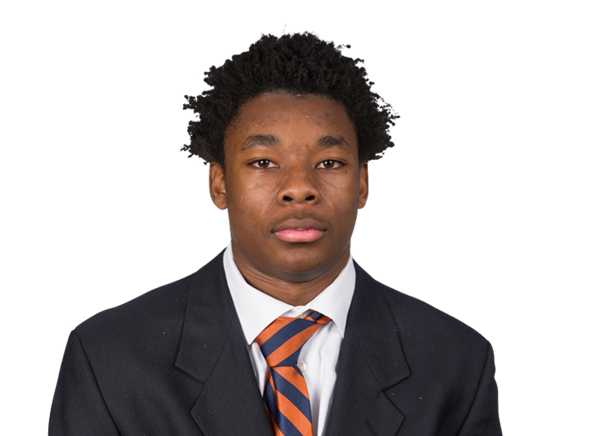 Darius Johnson#6 | 3 | 20 | 6.7 | 0 | 9 |
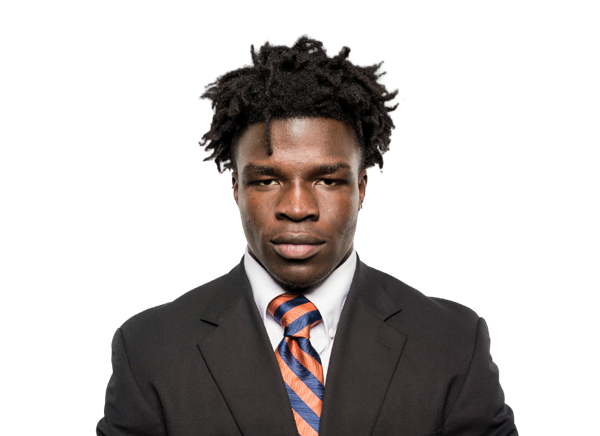 David Omopariola#18 | 1 | 12 | 12.0 | 0 | 12 |
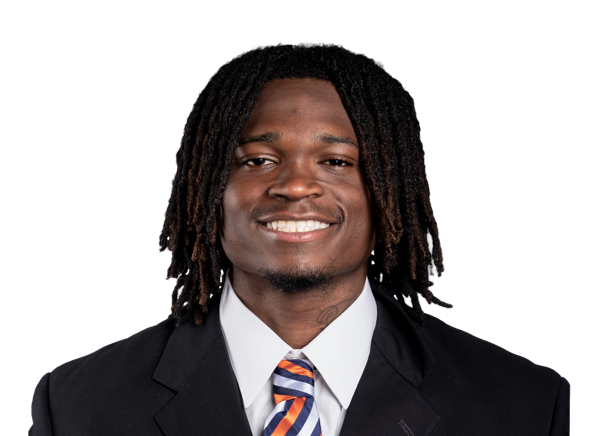 Zamondre Merriweather#14 | 1 | 2 | 2.0 | 0 | 2 |
| Ju'Juan Johnson#4 | 1 | 1 | 1.0 | 0 | 1 |
California| Player | TOT | SOLO | SACKS | TFL | PD | QB HUR | TD |
|---|---|---|---|---|---|---|---|
| Daniel Harris#7 | 7 | 5 | 1 | 1 | 1 | 0 | 0 |
 AJ Tuitele#9 | 6 | 3 | 0 | 0 | 0 | 1 | 0 |
 Kingston Lopa#2 | 5 | 4 | 0 | 0 | 0 | 0 | 1 |
 JD McKinley#33 | 5 | 2 | 0 | 0 | 0 | 0 | 0 |
 Jae'on Young#13 | 4 | 4 | 0 | 0 | 0 | 0 | 0 |
 Kamar Mothudi#3 | 4 | 2 | 0 | 0 | 0 | 0 | 0 |
 Jericho Johnson#44 | 4 | 2 | 0.5 | 0.5 | 0 | 0 | 0 |
 Khamani Hudson#25 | 4 | 2 | 0 | 0 | 1 | 0 | 0 |
 Cam Sidney#20 | 4 | 1 | 0 | 0 | 0 | 0 | 0 |
 Nate Burrell#98 | 3 | 2 | 0 | 0 | 0 | 2 | 0 |
 Solomon Williams | 3 | 2 | 0 | 1 | 0 | 0 | 0 |
 Ashun Shepphard#99 | 3 | 2 | 0 | 0 | 0 | 0 | 0 |
| Jayden Wayne#10 | 3 | 1 | 1.5 | 1.5 | 0 | 0 | 0 |
 Tristan Jernigan#32 | 3 | 1 | 0 | 0 | 0 | 0 | 0 |
 Isaiah Crosby#23 | 2 | 2 | 0 | 1 | 0 | 0 | 0 |
 Derek Wilkins#96 | 2 | 0 | 0 | 0 | 0 | 0 | 0 |
 Michael Hurst Jr.#16 | 2 | 0 | 0 | 0 | 0 | 0 | 0 |
 Aaron Hampton#21 | 2 | 0 | 0 | 0 | 0 | 0 | 0 |
| Jordan King#4 | 1 | 1 | 0 | 0 | 0 | 0 | 0 |
 Quimari Shemwell#24 | 1 | 1 | 0 | 0 | 1 | 0 | 0 |
 Jayden Williams#51 | 1 | 1 | 0 | 0 | 0 | 0 | 0 |
 Odera Okaka#19 | 1 | 1 | 0 | 0 | 0 | 0 | 0 |
 Joshua Pierce#15 | 1 | 0 | 0 | 0 | 0 | 0 | 0 |
Syracuse| Player | TOT | SOLO | SACKS | TFL | PD | QB HUR | TD |
|---|---|---|---|---|---|---|---|
| Chris D'Appolonia#6 | 11 | 8 | 1 | 2 | 0 | 0 | 0 |
 Antoine Deslauriers#5 | 9 | 7 | 0 | 3 | 0 | 0 | 0 |
| Demetres Samuel Jr.#1 | 5 | 5 | 0 | 0 | 0 | 0 | 0 |
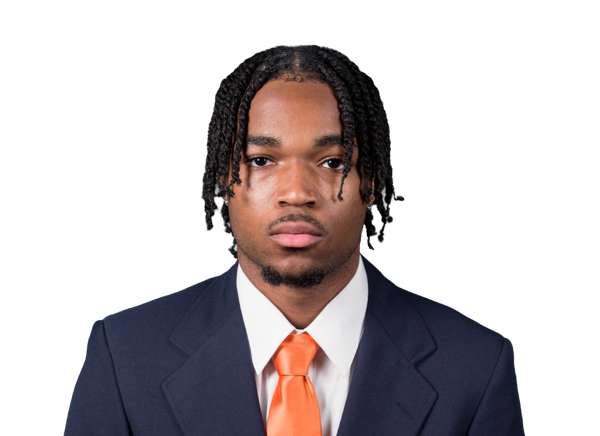 Chris Peal#12 | 4 | 4 | 0 | 0 | 0 | 0 | 0 |
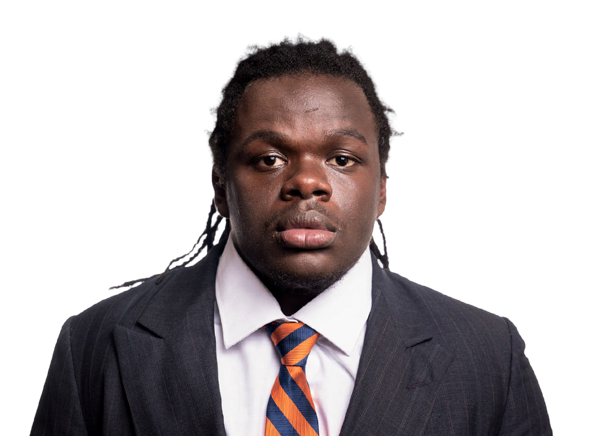 Rashard Perry#92 | 4 | 1 | 0 | 0 | 0 | 0 | 0 |
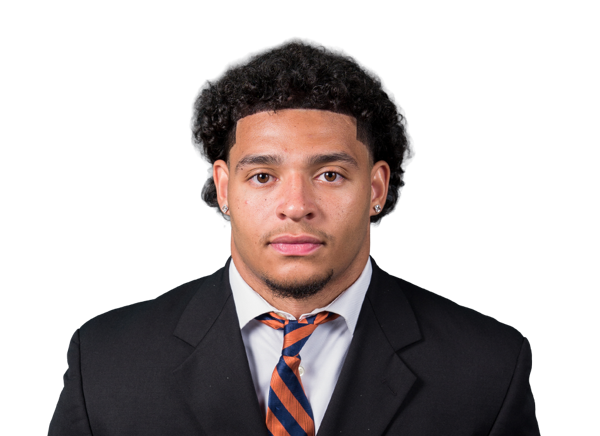 Gary Bryant III#10 | 4 | 1 | 0 | 0 | 0 | 0 | 0 |
 Dillan Fontus#95 | 3 | 2 | 0 | 0 | 0 | 0 | 0 |
 Braheem Long Jr. | 3 | 1 | 0 | 0.5 | 0 | 0 | 0 |
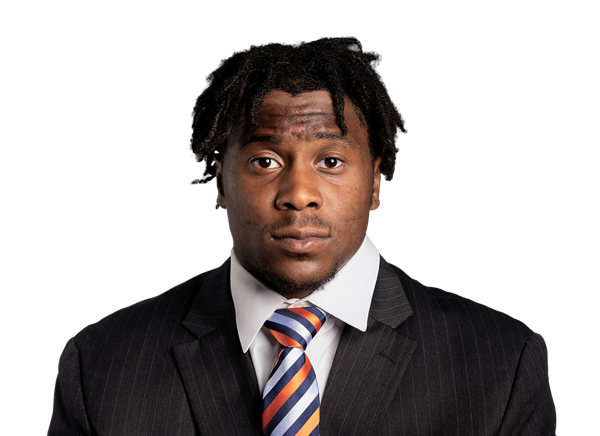 Keyshawn Johnson#14 | 3 | 1 | 0 | 0 | 0 | 1 | 0 |
| David Omopariola#18 | 2 | 1 | 0 | 0 | 0 | 0 | 0 |
 Jamie Tremble#82 | 2 | 0 | 0 | 0 | 0 | 0 | 0 |
 Nissi Ogbebor#11 | 2 | 0 | 0 | 0.5 | 0 | 0 | 0 |
 Trevion Mack#75 | 1 | 1 | 0 | 0 | 0 | 0 | 0 |
 Nazir Ward#7 | 1 | 1 | 0 | 1 | 1 | 0 | 0 |
 Tunmise Adeleye#30 | 1 | 0 | 0 | 0 | 1 | 0 | 0 |
 Zyian Moultrie-Goddard#2 | 1 | 0 | 0 | 0 | 0 | 0 | 0 |
 Fran Brown Jr.#21 | 1 | 0 | 0 | 0 | 0 | 0 | 0 |
Syracuse| Player | FUM | LOST | REC |
|---|---|---|---|
| Steve Angeli#9 | 1 | 0 | 0 |
California| Player | FG | PCT | LONG | XP | PTS |
|---|---|---|---|---|---|
 Towns McGough#33 | 0/1 | 0.0 | 0 | 3/3 | 3 |
Syracuse| Player | FG | PCT | LONG | XP | PTS |
|---|---|---|---|---|---|
 Tripp Woody#47 | 2/4 | 50.0 | 33 | 0/0 | 6 |
California| Player | NO | YDS | AVG | TB | In 20 | LONG |
|---|---|---|---|---|---|---|
 Angus Davies#29 | 7 | 238 | 34.0 | 0 | 3 | 52 |
Syracuse| Player | NO | YDS | AVG | TB | In 20 | LONG |
|---|---|---|---|---|---|---|
| Jimmy Gregg#41 | 3 | 115 | 38.3 | 0 | 1 | 48 |
Syracuse| Player | NO | YDS | AVG | LONG | TD |
|---|---|---|---|---|---|
| Darien Williams#7 | 1 | 29 | 29.0 | 29 | 0 |
California| Player | NO | YDS | AVG | LONG | TD |
|---|---|---|---|---|---|
| Isaiah Crosby#23 | 1 | 2 | 2.0 | 2 | 0 |
Syracuse| Player | NO | YDS | AVG | LONG | TD |
|---|---|---|---|---|---|
 Davien Kerr#3 | 1 | 27 | 27.0 | 27 | 0 |
| Demetres Samuel Jr.#1 | 2 | 19 | 9.5 | 13 | 0 |
California| Player | INT | YDS | TD |
|---|---|---|---|
| Kingston Lopa#2 | 3 | 53 | 1 |
Drive Summary
SYR
Field Goal
57
CAL
Punt
14
SYR
Punt
40
CAL
Punt
16
SYR
Field Goal
45
CAL
Missed FG
35
SYR
Touchdown
49
CAL
Touchdown
75
SYR
Punt
9
CAL
Punt
36
SYR
Punt
4
CAL
Punt
4
SYR
End Of Half
-2
CAL
Downs
23
SYR
Interception
18
CAL
Touchdown
29
SYR
Touchdown
74
CAL
Punt
10
SYR
Missed FG
78
CAL
Punt
39
SYR
Interception Touchdown
1
SYR
Missed FG
47
CAL
Punt
4
SYR
Interception
23
CAL
End Of Quarter
-2
Injury Report
No current injury report is available for this matchup.
Head-to-Head
Historical meetings are not available for this matchup.
Game Information
StageWeek 2
Season2026
KickoffSat, Sep 12, 3:30 pm
VenueJMA Wireless Dome
LocationSyracuse, NY
SurfaceArtificial Turf
BroadcastACC Network
Division Standings
FBS — Atlantic Coast Conference
| Team | W | L | T | Pct | PF | PA | Home | Away | Strk |
|---|---|---|---|---|---|---|---|---|---|
 Miami | 9 | 1 | 0 | 0.900 | 441 | 198 | 5-0 | 4-1 | W1 |
 SMU | 7 | 3 | 0 | 0.700 | 340 | 255 | 6-1 | 1-2 | L1 |
 Virginia | 5 | 5 | 0 | 0.500 | 269 | 215 | 5-2 | 0-3 | W1 |
| California | 3 | 7 | 0 | 0.300 | 204 | 320 | 2-3 | 1-4 | L4 |
 Duke | 7 | 3 | 0 | 0.700 | 322 | 153 | 4-1 | 3-2 | L1 |
 North Carolina | 5 | 5 | 0 | 0.500 | 258 | 221 | 1-4 | 4-1 | L1 |
 Virginia Tech | 6 | 4 | 0 | 0.600 | 330 | 255 | 3-2 | 3-2 | L2 |
 Wake Forest | 9 | 1 | 0 | 0.900 | 439 | 150 | 4-1 | 5-0 | W7 |
 Pittsburgh | 6 | 4 | 0 | 0.600 | 297 | 194 | 5-2 | 1-2 | L1 |
 Boston College | 4 | 6 | 0 | 0.400 | 204 | 284 | 3-2 | 1-4 | L3 |
 Louisville | 7 | 3 | 0 | 0.700 | 383 | 247 | 4-1 | 3-2 | W5 |
 Clemson | 6 | 4 | 0 | 0.600 | 210 | 206 | 3-3 | 3-1 | L1 |
 Georgia Tech | 3 | 7 | 0 | 0.300 | 235 | 296 | 2-4 | 1-3 | W1 |
 Florida State | 5 | 5 | 0 | 0.500 | 292 | 265 | 3-2 | 2-3 | W2 |
 NC State | 4 | 6 | 0 | 0.400 | 291 | 282 | 4-3 | 0-3 | L2 |
 Stanford | 5 | 5 | 0 | 0.500 | 223 | 358 | 4-1 | 1-4 | W1 |
| Syracuse | 5 | 5 | 0 | 0.500 | 298 | 260 | 2-3 | 3-2 | W1 |
California
16th in ACC
VS
Syracuse
11th in ACC
Quarterbacks & Specialists
#29
Angus Davies
#3
Jaron-Keawe Sagapolutele
Receivers & Backs
#20
Ashten Emory
#6
Kyion Grayes
#7
Chase Hendricks
#4
Jordan King
#85
Mason Mini
#24
Adam Mohammed
#10
Cooper Perry
#22
Taimane Purcell
#9
Ian Strong
Defensive Line & Linebackers
#98
Nate Burrell
#21
Aaron Hampton
#32
Tristan Jernigan
#44
Jericho Johnson
#33
JD McKinley
#3
Kamar Mothudi
#19
Odera Okaka
#15
Joshua Pierce
#99
Ashun Shepphard
#9
AJ Tuitele
#10
Jayden Wayne
#96
Derek Wilkins
#51
Jayden Williams
Solomon Williams
Defensive Backs
#23
Isaiah Crosby
#7
Daniel Harris
#25
Khamani Hudson
#16
Michael Hurst Jr.
#2
Kingston Lopa
#24
Quimari Shemwell
#20
Cam Sidney
#13
Jae'on Young
Other
#33
Towns McGough
Quarterbacks & Specialists
#9
Steve Angeli
#21
Fran Brown Jr.
#41
Jimmy Gregg
Offensive Line
#75
Trevion Mack
Receivers & Backs
#23
Shavane Anderson Jr.
#19
Daunte Bacheyie
#2
Umari Hatcher
#20
Tylik Hill
#6
Darius Johnson
#4
Ju'Juan Johnson
#14
Zamondre Merriweather
#22
Ahmad Miller
#86
Justus Ross-Simmons
#7
Darien Williams
Defensive Line & Linebackers
#30
Tunmise Adeleye
#10
Gary Bryant III
#6
Chris D'Appolonia
#5
Antoine Deslauriers
#95
Dillan Fontus
#14
Keyshawn Johnson
#2
Zyian Moultrie-Goddard
#11
Nissi Ogbebor
#18
David Omopariola
#92
Rashard Perry
#82
Jamie Tremble
Defensive Backs
#9
Jai Eugene Jr.
#3
Davien Kerr
Braheem Long Jr.
#12
Chris Peal
#1
Demetres Samuel Jr.
#7
Nazir Ward
Other
#47
Tripp Woody
California
15th in ACC
VS
Syracuse
12th in ACC
Passing
64.8
Completion Percentage
59.2
273
Completions
228
2.10
Interception Percentage
2.60
9
Interceptions
10
91
Longest Pass
76
2,637
Net Passing Yards
2,738
263.7
Net Passing Yards Per Game
273.8
421
Passing Attempts
385
3.30
Passing Touchdown %
5.20
14
Passing Touchdowns
20
124.5
Passer Rating
130.8
22
Total Sacks
22
154
Sack Yards Lost
151
6.3
Yards Per Pass Attempt
7.1
2,637
Passing Yards
2,738
0
Passing Fumbles Lost
0
10
Team Games Played
10
342.4
Yards Per Game
428.2
20.4
Total Points Per Game
29.8
204
Total Points
298
25
Total Touchdowns
36
263.7
Passing Yards Per Game
273.8
273-421
Comp-Att
228-385
22-154
Sacks-Yards Lost
22-151
Rushing
272
Rushing Attempts
404
787
Rushing Yards
1,544
2.9
Yards Per Rush Attempt
3.8
29
Long Rushing
55
0
20+ Yard Rushing Plays
0
9
Rushing Touchdowns
14
78.7
Rushing Yards Per Game
154.4
0
Rushing Fumbles
0
0
Rushing Fumbles Lost
0
47
Rushing 1st downs
101
10
Team Games Played
10
3,424
Total Yards
4,282
715
Total Offensive Plays
811
20.4
Total Points Per Game
29.8
204
Total Points
298
25
Total Touchdowns
36
Receiving
273
Receptions
228
0
Receiving Targets
0
2,637
Receiving Yards
2,738
2,637
Receiving Yards
2,738
14
Receiving Touchdowns
20
91
Long Reception
76
0
20+ Yard Receiving Plays
0
263.7
Receiving Yards Per Game
273.8
0
Receiving Fumbles
0
0
Receiving Fumbles Lost
0
1525
Receiving Yards After Catch
1192
115
Receiving First Downs
120
10
Team Games Played
10
9.7
Yards Per Reception
12.0
20.4
Total Points Per Game
29.8
204
Total Points
298
25
Total Touchdowns
36
Miscellaneous
193
Total 1st downs
249
47
Rushing 1st downs
101
115
Passing 1st downs
120
30
1st downs by penalty
28
55
Third Down Conversions
65
153
Third Down Attempts
162
35.95
3rd down %
40.12
7
Fourth Down Conversions
18
25
First Downs Attempts
29
28.00
4th down %
62.07
85
Total Penalties
88
796
Total Penalty Yards
817
17866
Possession Time Seconds
19512
0.00
Red Zone Field Goal Percentage
0.00
0.00
Red Zone Scoring Percentage
0.00
0.00
Red Zone Efficiency Percentage
0.00
0.00
Red Zone Touchdown Percentage
0.00
14
Total Takeaways
18
12
Total Giveaways
12
2
Turnover Ratio
6
0
Fumbles Lost
0
55-153
3rd down efficiency
65-162
7-25
4th down efficiency
18-29
85-796
Total-Yards
88-817
Defense
325
Solo Tackles
285
322
Assist Tackles
382
647
Total Tackles
667
15
Sacks
29
100
Sack Yards
226
61
Stuffs
87
32
Passes Defended
37
14.9
Average Interception Yards
8.3
53
Long Interception
18
0
Miscellaneous Touchdowns
0
2
Kicks Blocked
1
33
Tackles For Loss
51
10
Team Games Played
10
Defensive Interceptions
7
Interceptions
6
104
Interception Yards
50
1
Interception Touchdowns
1
7-104
INT: Total
6-50
General
8
Fumbles
6
4
Forced Fumbles
8
5
Fumbles Recovered
8
1
Fumbles Touchdowns
1
10
Games Played
10
8-0
Fumbles-Lost
6-0
Returning
17
Kick Returns
16
337
Kick Return Yards
300
19.8
Yards Per Kick Return
18.8
46
Long Kick Return
42
0
Kick Return Touchdowns
0
14
Punt Returns
25
79
Punt Return Yards
313
5.6
Yards Per Punt Return
12.5
24
Long Punt Return
38
0
Punt Return Touchdowns
0
0
Punt Return Fair Catches
0
0
Kick Return Fumbles Lost
0
0
Punt Return Fumbles Lost
0
10
Team Games Played
10
14-79
Punt: Total
25-313
Kicking
10
Field Goal Made
16
15
Field Goal Attempts
24
66.7
Field Goal Percentage
66.7
41
Long Field Goal Made
46
0
Field Goal Attempts 1-19
0
2
Field Goal Attempts 20-29
9
8
Field Goal Attempts 30-39
8
3
Field Goal Attempts 40-49
7
2
Field Goal Attempts 50+
0
20
Extra Points Made
24
20
Extra Point Attempts
29
100.0
Extra Point Percentage
82.8
0
Field Goals Made 1-19
0
2
Field Goals Made 20-29
8
7
Field Goals Made 30-39
6
1
Field Goals Made 40-49
2
0
Field Goals Made 50+
0
50
Total Kicking Points
72
10
Team Games Played
10
40
Touchback Percentage
54
0.0
Average Kickoff Return Yards
0.0
0
Kickoff Return Yards
0
0
Kickoff Returns
0
0-0
Kickoffs: Total
0-0
10-15
FG: Good-Attempts
16-24
Punting
53
Punts
36
2,284
Punt Yards
1,540
66
Long Punt
58
43.1
Gross Average Punt Yards
42.8
43.1
Net Average Punt Yards
42.8
0
Punts Blocked
0
15
Punts Inside 20
13
1
Touchbacks
2
15
Fair Catches
18
18
Punt Returns
10
0
Punt Return Yards
0
0.0
Average Punt Return Yards
0.0
10
Team Games Played
10
53-2,284
Punt: Total Yards
36-1,540
Scoring
9
Rushing Touchdowns
14
14
Receiving Touchdowns
20
0
Return Touchdowns
0
24
Total Touchdowns
35
10
Field Goals
16
20
Kick Extra Points
24
2
Total Two Point Conversions
4
204
Total Points
298
20.4
Total Points Per Game
29.8