

California vs UNLV Live Score (3 Oct, 2026)
Score by Quarter
| Team | Q1 | Q2 | Q3 | Q4 | Final |
|---|---|---|---|---|---|
 California | 7 | 0 | 11 | 13 | 31 |
 UNLV | 7 | 17 | 0 | 15 | 39 |
Scoring Plays
Q1
11:30
11:30
Taimane Purcell 91 Yd pass from Jaron-Keawe Sagapolutele (Chase Meyer Kick)
Passing Touchdown
7 – 0
Q1
5:31
5:31
Kayden McGee 70 Yd pass from Jackson Arnold (Ramon Villela Kick)
Passing Touchdown
7 – 7
Q2
11:18
11:18
Jackson Arnold 55 Yd Run (Ramon Villela Kick)
Rushing Touchdown
7 – 14
Q2
1:52
1:52
Ramon Villela 31 Yd Field Goal
Field Goal Good
7 – 17
Q2
0:51
0:51
Taz Reddicks 36 Yd pass from Jackson Arnold (Ramon Villela Kick)
Passing Touchdown
7 – 24
Q3
4:40
4:40
Carson Perry-Smith 53 Yd pass from Jackson Brousseau (Jackson Brousseau Pass to Cooper Perry for Two-Point Conversion)
Passing Touchdown
15 – 24
Q3
3:36
3:36
Towns McGough 38 Yd Field Goal
Field Goal Good
18 – 24
Q4
11:38
11:38
Ashten Emory 7 Yd Run (Chase Meyer Kick)
Rushing Touchdown
25 – 24
Q4
9:32
9:32
Keyan Burnett 10 Yd pass from Jackson Arnold (Jackson Arnold Run for Two-Point Conversion)
Penalty
25 – 32
Q4
3:25
3:25
Jackson Arnold 2 Yd Run (Ramon Villela Kick)
Rushing Touchdown
25 – 39
Q4
0:28
0:28
Ian Strong 10 Yd pass from Jackson Brousseau
Pass Reception
31 – 39
Game Leaders
CaliforniaUNLV
 J. Brousseau QB
Passing Yards
 J. Arnold QB
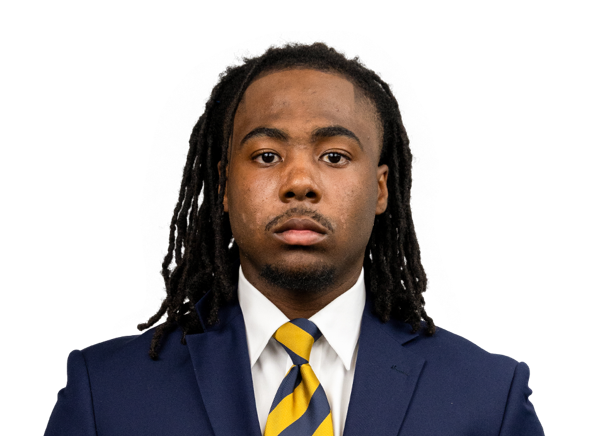 A. Emory RB
Rushing Yards
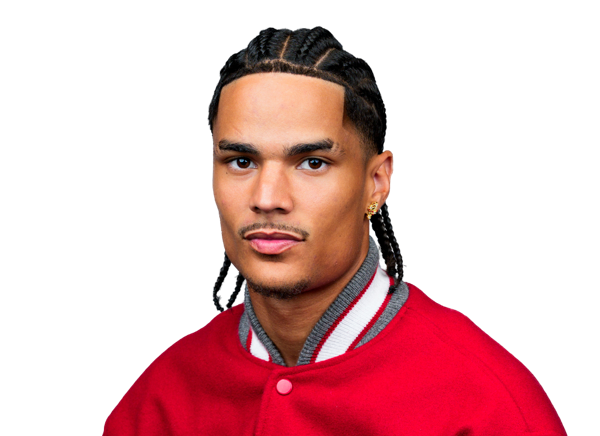
J. Arnold QB T. Purcell TE
Receiving Yards
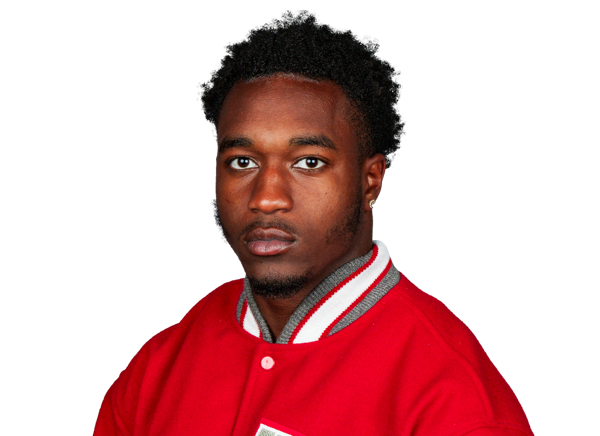
 K. McGee WR
 A. Tuitele LB
Sacks
 M. Bin-Wahad DBA. Tuitele LB
Tackles
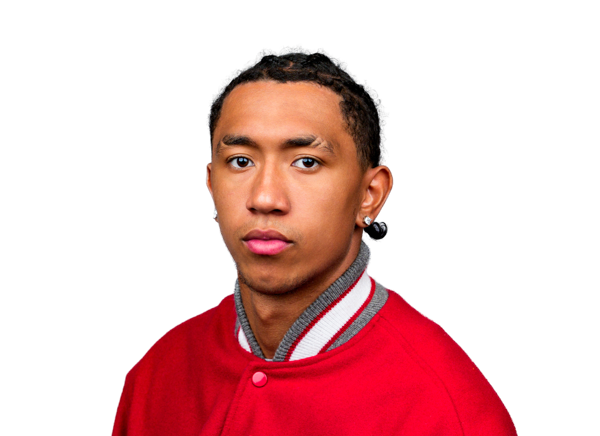 T. Fulton DB
Player Box Score
California| Player | C/ATT | YDS | AVG | TD | INT |
|---|---|---|---|---|---|
| Jackson Brousseau#11 | 19/32 | 200 | 6.3 | 2 | 0 |
 Jaron-Keawe Sagapolutele#3 | 19/27 | 195 | 7.2 | 1 | 1 |
UNLV| Player | C/ATT | YDS | AVG | TD | INT |
|---|---|---|---|---|---|
| Jackson Arnold#11 | 11/22 | 177 | 8.0 | 3 | 0 |
 Matt Byrnes#85 | 0/1 | 0 | 0.0 | 0 | 1 |
California| Player | CAR | YDS | AVG | TD | LONG |
|---|---|---|---|---|---|
| Ashten Emory#20 | 12 | 48 | 4.0 | 1 | 20 |
 Tyree Sams#81 | 3 | 28 | 9.3 | 0 | 21 |
 Anthony League#25 | 1 | 2 | 2.0 | 0 | 2 |
 Carson Perry-Smith#21 | 1 | 2 | 2.0 | 0 | 2 |
| Jackson Brousseau#11 | 3 | 1 | 0.3 | 0 | 14 |
| Jaron-Keawe Sagapolutele#3 | 4 | -12 | -3.0 | 0 | 3 |
UNLV| Player | CAR | YDS | AVG | TD | LONG |
|---|---|---|---|---|---|
| Jackson Arnold#11 | 15 | 110 | 7.3 | 2 | 55 |
 Jai'Den Thomas#9 | 16 | 46 | 2.9 | 0 | 10 |
 Matt Choules#26 | 1 | 13 | 13.0 | 0 | 13 |
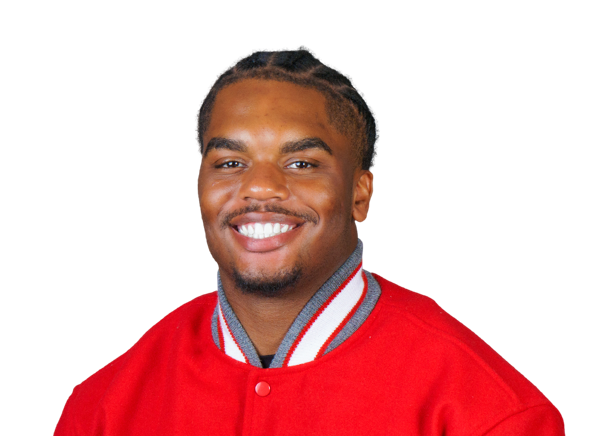 Darrien Jones#24 | 2 | 5 | 2.5 | 0 | 3 |
| Kayden McGee#6 | 2 | 3 | 1.5 | 0 | 3 |
 Team | 2 | -4 | -2.0 | 0 | 0 |
California| Player | REC | YDS | AVG | TD | LONG |
|---|---|---|---|---|---|
| Taimane Purcell#22 | 3 | 102 | 34.0 | 1 | 91 |
| Carson Perry-Smith#21 | 1 | 53 | 53.0 | 1 | 53 |
 Ian Strong#9 | 6 | 49 | 8.2 | 1 | 20 |
 Mason Mini#85 | 3 | 42 | 14.0 | 0 | 24 |
 Cooper Perry#10 | 3 | 35 | 11.7 | 0 | 21 |
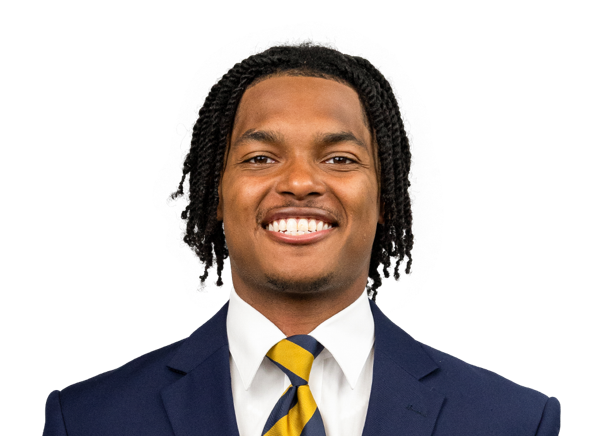 Chase Hendricks#7 | 8 | 35 | 4.4 | 0 | 8 |
| Tyree Sams#81 | 5 | 24 | 4.8 | 0 | 13 |
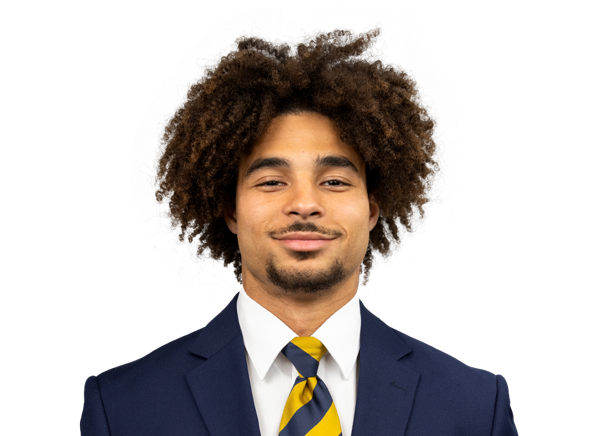 Kyion Grayes#6 | 5 | 22 | 4.4 | 0 | 14 |
 Mark Hamper#15 | 1 | 21 | 21.0 | 0 | 21 |
| Ashten Emory#20 | 2 | 11 | 5.5 | 0 | 8 |
| Anthony League#25 | 1 | 1 | 1.0 | 0 | 1 |
UNLV| Player | REC | YDS | AVG | TD | LONG |
|---|---|---|---|---|---|
| Kayden McGee#6 | 3 | 85 | 28.3 | 1 | 70 |
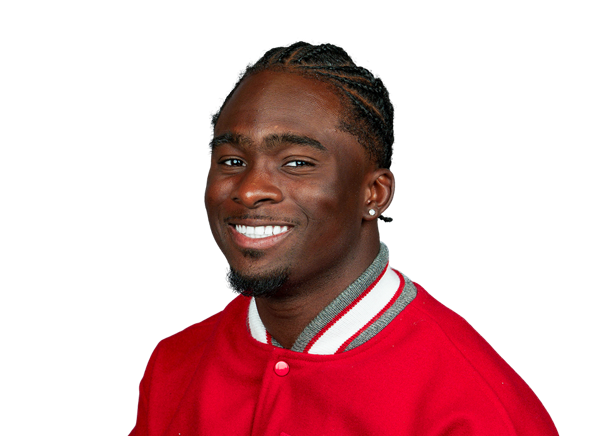 Taz Reddicks#2 | 2 | 36 | 18.0 | 1 | 36 |
 Keyan Burnett#84 | 2 | 24 | 12.0 | 1 | 14 |
 Troy Stellato#10 | 1 | 16 | 16.0 | 0 | 16 |
 Vincent Carner#81 | 1 | 9 | 9.0 | 0 | 9 |
| Jai'Den Thomas#9 | 2 | 2 | 1.0 | 0 | 4 |
California| Player | TOT | SOLO | SACKS | TFL | PD | QB HUR | TD |
|---|---|---|---|---|---|---|---|
| AJ Tuitele#9 | 7 | 4 | 2 | 2 | 0 | 0 | 0 |
 Daniel Harris#7 | 5 | 3 | 0 | 0 | 0 | 0 | 0 |
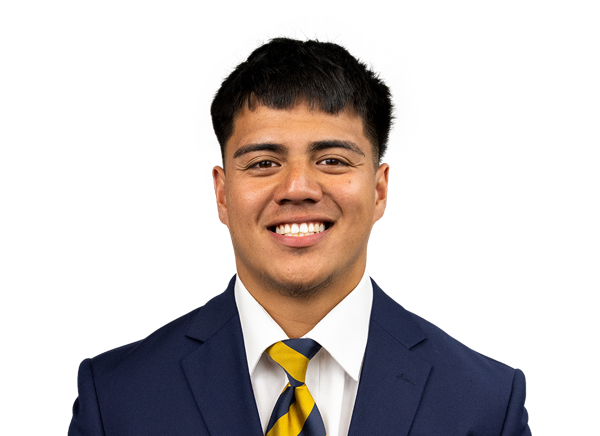 Aiden Manutai#14 | 5 | 3 | 0 | 0 | 0 | 0 | 0 |
 Isaiah Crosby#23 | 4 | 4 | 0 | 0 | 1 | 0 | 0 |
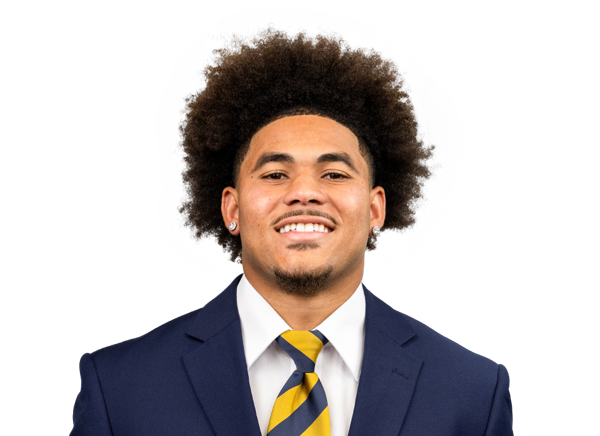 Michael Hurst Jr.#16 | 4 | 2 | 0 | 0 | 0 | 0 | 0 |
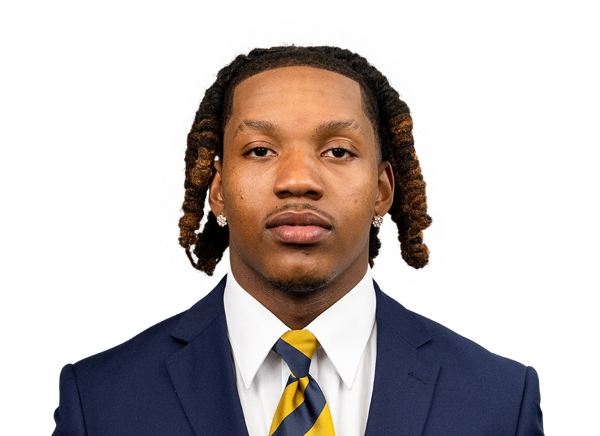 Tristan Jernigan#32 | 4 | 1 | 0 | 0 | 0 | 0 | 0 |
 Solomon Williams | 3 | 2 | 0 | 0 | 0 | 0 | 0 |
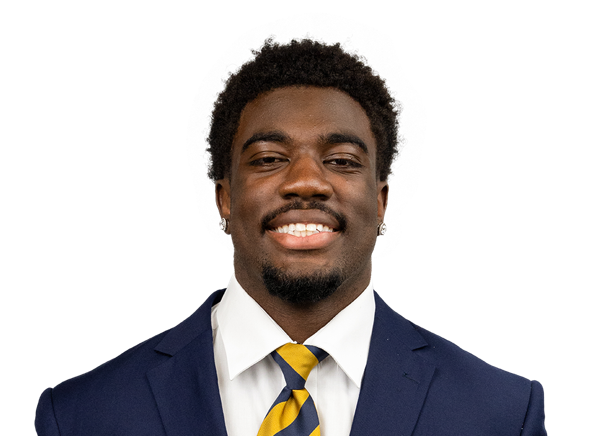 JD McKinley#33 | 3 | 1 | 1 | 1 | 0 | 1 | 0 |
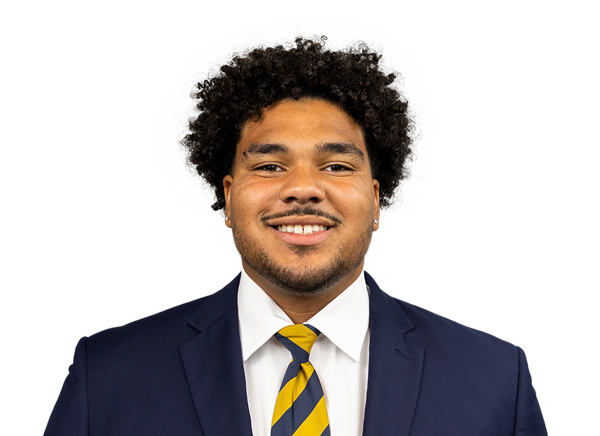 Jericho Johnson#44 | 3 | 1 | 0 | 0 | 0 | 0 | 0 |
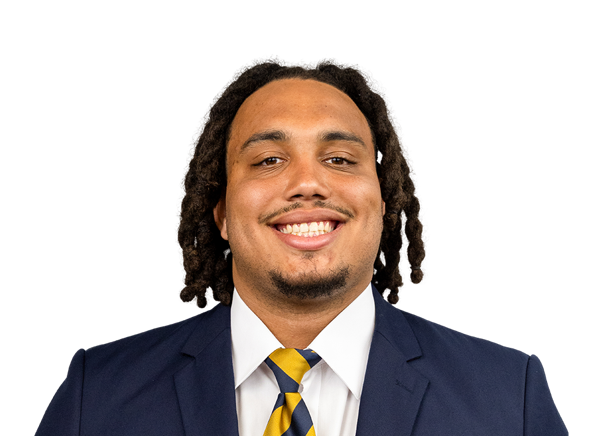 Derek Wilkins#96 | 3 | 0 | 0 | 0.5 | 0 | 0 | 0 |
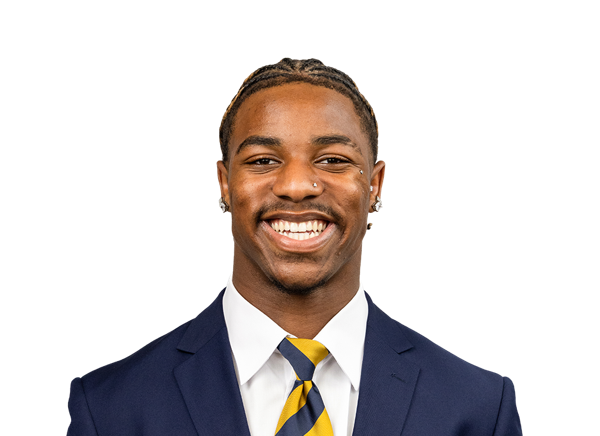 Kamar Mothudi#3 | 3 | 0 | 0 | 0 | 0 | 0 | 0 |
 Jordan Sanford#17 | 2 | 1 | 0 | 0 | 0 | 0 | 0 |
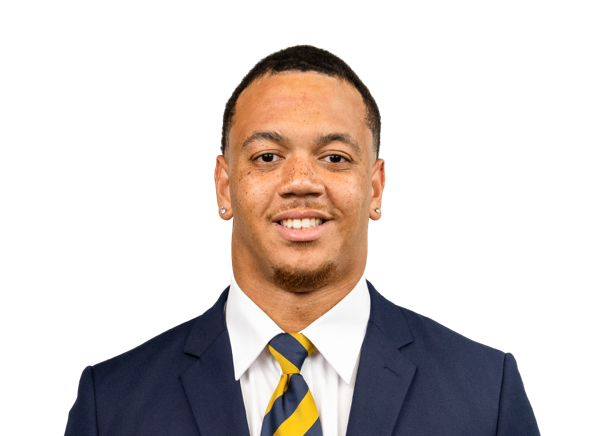 Justin Beadles#4 | 2 | 0 | 0 | 0.5 | 0 | 0 | 0 |
 Ashun Shepphard#99 | 2 | 0 | 0 | 0 | 0 | 0 | 0 |
| Kyion Grayes#6 | 1 | 1 | 0 | 0 | 0 | 0 | 0 |
 Ricky Fletcher#1 | 1 | 1 | 0 | 1 | 0 | 0 | 0 |
 Khamani Hudson#25 | 1 | 1 | 0 | 1 | 0 | 0 | 0 |
| Tyree Sams#81 | 1 | 1 | 0 | 0 | 0 | 0 | 0 |
 Roger Vanderhoef#60 | 1 | 1 | 0 | 0 | 0 | 0 | 0 |
 Cam Sidney#20 | 1 | 0 | 0 | 0 | 0 | 0 | 0 |
 Jayden Williams#51 | 1 | 0 | 0 | 0 | 0 | 0 | 0 |
 Odera Okaka#19 | 1 | 0 | 0 | 0 | 0 | 0 | 0 |
| Niles Davis#26 | 1 | 0 | 0 | 0 | 0 | 0 | 0 |
 Quimari Shemwell#24 | 0 | 0 | 0 | 0 | 1 | 0 | 0 |
UNLV| Player | TOT | SOLO | SACKS | TFL | PD | QB HUR | TD |
|---|---|---|---|---|---|---|---|
| Tre Fulton#10 | 10 | 6 | 0.5 | 0.5 | 0 | 0 | 0 |
 Jake Pope#7 | 8 | 3 | 0 | 1 | 0 | 1 | 0 |
 Cam Santee#23 | 7 | 4 | 0 | 0 | 0 | 0 | 0 |
| Mumu Bin-Wahad#1 | 6 | 4 | 1 | 1 | 0 | 1 | 0 |
 Denver Harris#2 | 4 | 4 | 0 | 1 | 1 | 0 | 0 |
 Andre Porter#42 | 4 | 2 | 1 | 2 | 1 | 0 | 0 |
 Kal-El Togafau#44 | 4 | 2 | 1 | 1.5 | 0 | 0 | 0 |
 Elias Rudolph#91 | 3 | 3 | 0 | 0 | 0 | 1 | 0 |
 Tony-Louis Nkuba#4 | 3 | 3 | 0 | 0 | 0 | 0 | 0 |
 Jaylen Allen#13 | 3 | 3 | 0 | 1 | 0 | 0 | 0 |
 Avery Helm#24 | 3 | 2 | 0 | 0 | 0 | 0 | 0 |
 Kamuela Ka'aihue#8 | 3 | 1 | 0 | 0 | 1 | 0 | 0 |
 Justin Flowe#36 | 2 | 1 | 0 | 1 | 0 | 0 | 0 |
 Jordan Njoku#30 | 2 | 1 | 0 | 0 | 0 | 0 | 0 |
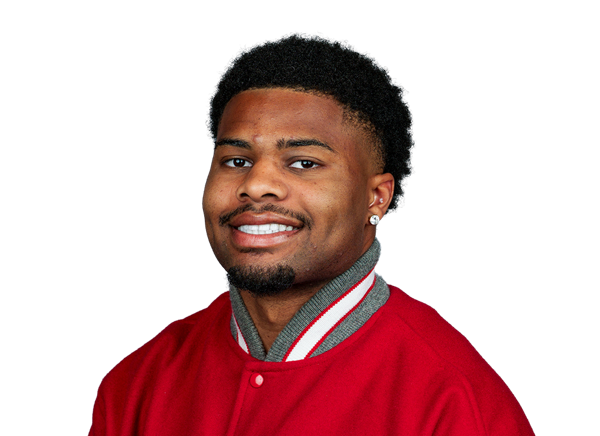 Dee Crayton#3 | 2 | 0 | 0.5 | 0.5 | 0 | 0 | 0 |
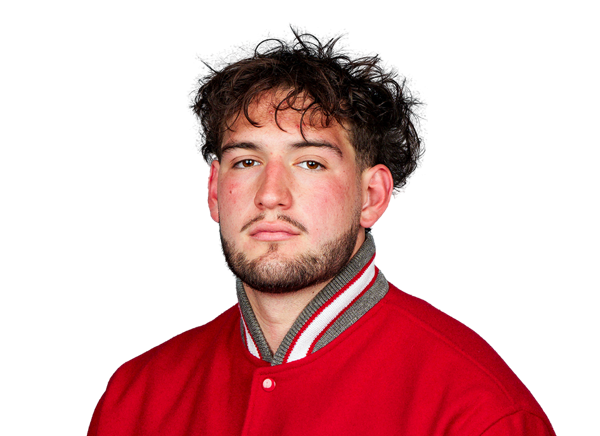 Lucas Conti#94 | 2 | 0 | 0 | 0.5 | 0 | 0 | 0 |
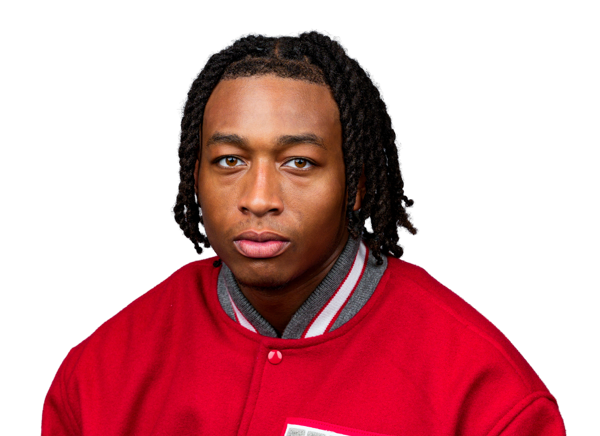 Landen Thomas#9 | 2 | 0 | 0 | 0 | 0 | 0 | 0 |
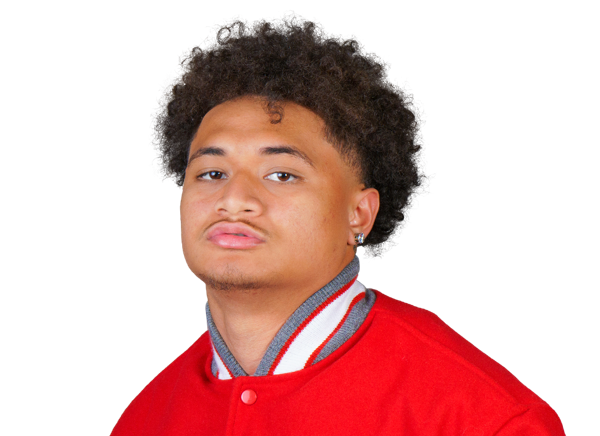 Blesyng Alualu-Tuiolemotu#15 | 2 | 0 | 0 | 0 | 0 | 0 | 0 |
 Mark Iheanachor#11 | 1 | 0 | 0 | 0 | 0 | 0 | 0 |
 Jae Beasley II#43 | 1 | 0 | 0 | 0 | 0 | 0 | 0 |
 Joshua Tuchek#21 | 1 | 0 | 0 | 0 | 0 | 0 | 0 |
 Poe Purcell#54 | 1 | 0 | 0 | 0 | 0 | 0 | 0 |
 Mohamed Altayeb#16 | 1 | 0 | 0 | 0 | 0 | 0 | 0 |
 Herb Gray#92 | 0 | 0 | 0 | 0 | 0 | 1 | 0 |
California| Player | FUM | LOST | REC |
|---|---|---|---|
| Niles Davis#26 | 0 | 0 | 1 |
UNLV| Player | FUM | LOST | REC |
|---|---|---|---|
 Peyton Zachary#82 | 1 | 1 | 0 |
California| Player | FG | PCT | LONG | XP | PTS |
|---|---|---|---|---|---|
 Towns McGough#33 | 1/2 | 50.0 | 38 | 0/0 | 3 |
 Chase Meyer#91 | 0/0 | 0.0 | 0 | 2/2 | 2 |
UNLV| Player | FG | PCT | LONG | XP | PTS |
|---|---|---|---|---|---|
 Ramon Villela#32 | 1/1 | 100.0 | 31 | 4/4 | 7 |
California| Player | NO | YDS | AVG | TB | In 20 | LONG |
|---|---|---|---|---|---|---|
 Angus Davies#29 | 7 | 326 | 46.6 | 0 | 0 | 53 |
UNLV| Player | NO | YDS | AVG | TB | In 20 | LONG |
|---|---|---|---|---|---|---|
| Matt Choules#26 | 6 | 245 | 40.8 | 0 | 2 | 55 |
| Team | 1 | 16 | 16.0 | 0 | 0 | 16 |
California| Player | NO | YDS | AVG | LONG | TD |
|---|---|---|---|---|---|
| Niles Davis#26 | 5 | 108 | 21.6 | 46 | 0 |
| Tyree Sams#81 | 0 | 7 | 0.0 | 7 | 0 |
UNLV| Player | NO | YDS | AVG | LONG | TD |
|---|---|---|---|---|---|
| Peyton Zachary#82 | 3 | 53 | 17.7 | 27 | 0 |
California| Player | NO | YDS | AVG | LONG | TD |
|---|---|---|---|---|---|
| Tyree Sams#81 | 2 | 19 | 9.5 | 10 | 0 |
UNLV| Player | NO | YDS | AVG | LONG | TD |
|---|---|---|---|---|---|
| Peyton Zachary#82 | 2 | 21 | 10.5 | 12 | 0 |
California| Player | INT | YDS | TD |
|---|---|---|---|
| Aiden Manutai#14 | 1 | 0 | 0 |
UNLV| Player | INT | YDS | TD |
|---|---|---|---|
 Quandarius Keyes#5 | 1 | 44 | 0 |
Drive Summary
CAL
Downs
35
UNLV
Punt
0
CAL
Touchdown
91
UNLV
Punt
1
CAL
Punt
7
UNLV
Touchdown
72
CAL
Punt
16
UNLV
Punt
-6
CAL
Interception
3
UNLV
End Of Quarter
3
CAL
Punt
-2
UNLV
Touchdown
62
CAL
Missed FG
42
UNLV
Field Goal
53
CAL
Punt
6
UNLV
Touchdown
65
CAL
Punt
19
UNLV
End Of Half
-2
CAL
Downs
27
UNLV
Punt
21
CAL
Punt
4
UNLV
Punt
-9
CAL
Touchdown
58
CAL
Field Goal
-4
UNLV
Punt
-2
CAL
Punt
13
UNLV
Punt
-3
CAL
Touchdown
46
UNLV
Touchdown
79
CAL
Downs
5
UNLV
Touchdown
52
CAL
Touchdown
85
UNLV
End Of Quarter
-2
Injury Report
No current injury report is available for this matchup.
Head-to-Head
Historical meetings are not available for this matchup.
Game Information
StageWeek 5
Season2026
KickoffSat, Oct 3, 3:30 pm
VenueAllegiant Stadium
LocationLas Vegas, NV
SurfaceGrass
BroadcastCBSSN
Division Standings
FBS — Atlantic Coast Conference
| Team | W | L | T | Pct | PF | PA | Home | Away | Strk |
|---|---|---|---|---|---|---|---|---|---|
 Pittsburgh | 6 | 3 | 0 | 0.667 | 287 | 178 | 5-1 | 1-2 | W1 |
 Miami | 8 | 1 | 0 | 0.889 | 405 | 173 | 4-0 | 4-1 | L1 |
 Clemson | 6 | 3 | 0 | 0.667 | 204 | 186 | 3-2 | 3-1 | W2 |
 Duke | 7 | 2 | 0 | 0.778 | 297 | 117 | 4-1 | 3-1 | W3 |
 SMU | 7 | 2 | 0 | 0.778 | 333 | 206 | 6-0 | 1-2 | W1 |
 Wake Forest | 8 | 1 | 0 | 0.889 | 390 | 143 | 4-1 | 4-0 | W6 |
 Florida State | 4 | 5 | 0 | 0.444 | 276 | 255 | 3-2 | 1-3 | W1 |
 Virginia | 4 | 5 | 0 | 0.444 | 233 | 208 | 4-2 | 0-3 | L3 |
 Virginia Tech | 6 | 3 | 0 | 0.667 | 308 | 215 | 3-1 | 3-2 | L1 |
 NC State | 4 | 5 | 0 | 0.444 | 260 | 248 | 4-2 | 0-3 | L1 |
| California | 3 | 6 | 0 | 0.333 | 197 | 284 | 2-3 | 1-3 | L3 |
 Louisville | 6 | 3 | 0 | 0.667 | 367 | 233 | 4-1 | 2-2 | W4 |
 Stanford | 4 | 5 | 0 | 0.444 | 183 | 336 | 4-1 | 0-4 | L1 |
 North Carolina | 5 | 4 | 0 | 0.556 | 244 | 205 | 1-3 | 4-1 | W1 |
 Georgia Tech | 2 | 7 | 0 | 0.222 | 215 | 290 | 2-4 | 0-3 | L4 |
 Syracuse | 4 | 5 | 0 | 0.444 | 264 | 229 | 2-3 | 2-2 | L1 |
 Boston College | 4 | 5 | 0 | 0.444 | 197 | 243 | 3-2 | 1-3 | L2 |
FBS — Mountain West Conference
| Team | W | L | T | Pct | PF | PA | Home | Away | Strk |
|---|---|---|---|---|---|---|---|---|---|
 North Dakota State | 7 | 2 | 0 | 0.778 | 253 | 107 | 5-0 | 2-2 | W1 |
 New Mexico | 8 | 1 | 0 | 0.889 | 311 | 98 | 4-0 | 4-1 | W6 |
| UNLV | 5 | 4 | 0 | 0.556 | 235 | 231 | 3-2 | 2-2 | L1 |
 Air Force | 7 | 2 | 0 | 0.778 | 258 | 193 | 4-1 | 3-1 | W2 |
 Wyoming | 6 | 3 | 0 | 0.667 | 197 | 195 | 4-0 | 2-3 | W4 |
 San José State | 5 | 5 | 0 | 0.500 | 209 | 220 | 2-3 | 3-2 | W1 |
 Northern Illinois | 0 | 9 | 0 | 0.000 | 149 | 331 | 0-3 | 0-6 | L9 |
 Nevada | 3 | 6 | 0 | 0.333 | 187 | 212 | 2-3 | 1-3 | L2 |
 UTEP | 1 | 8 | 0 | 0.111 | 127 | 309 | 1-4 | 0-4 | L7 |
 Hawai'i | 3 | 6 | 0 | 0.333 | 183 | 210 | 1-3 | 2-3 | W2 |
California
13th in ACC
VS
UNLV
3rd in Mountain West
Quarterbacks & Specialists
#11
Jackson Brousseau
#29
Angus Davies
#3
Jaron-Keawe Sagapolutele
Offensive Line
#60
Roger Vanderhoef
Receivers & Backs
#20
Ashten Emory
#6
Kyion Grayes
#15
Mark Hamper
#7
Chase Hendricks
#25
Anthony League
#85
Mason Mini
#10
Cooper Perry
#21
Carson Perry-Smith
#22
Taimane Purcell
#81
Tyree Sams
#9
Ian Strong
Defensive Line & Linebackers
#4
Justin Beadles
#32
Tristan Jernigan
#44
Jericho Johnson
#33
JD McKinley
#3
Kamar Mothudi
#19
Odera Okaka
#99
Ashun Shepphard
#9
AJ Tuitele
#96
Derek Wilkins
#51
Jayden Williams
Solomon Williams
Defensive Backs
#23
Isaiah Crosby
#26
Niles Davis
#1
Ricky Fletcher
#7
Daniel Harris
#25
Khamani Hudson
#16
Michael Hurst Jr.
#14
Aiden Manutai
#17
Jordan Sanford
#24
Quimari Shemwell
#20
Cam Sidney
Other
#33
Towns McGough
#91
Chase Meyer
Quarterbacks & Specialists
#11
Jackson Arnold
#26
Matt Choules
Receivers & Backs
#43
Jae Beasley II
#84
Keyan Burnett
#85
Matt Byrnes
#81
Vincent Carner
#24
Darrien Jones
#6
Kayden McGee
#2
Taz Reddicks
#10
Troy Stellato
#9
Jai'Den Thomas
#82
Peyton Zachary
Defensive Line & Linebackers
#16
Mohamed Altayeb
#15
Blesyng Alualu-Tuiolemotu
#94
Lucas Conti
#3
Dee Crayton
#36
Justin Flowe
#92
Herb Gray
#11
Mark Iheanachor
#8
Kamuela Ka'aihue
#30
Jordan Njoku
#42
Andre Porter
#54
Poe Purcell
#91
Elias Rudolph
#23
Cam Santee
#9
Landen Thomas
#44
Kal-El Togafau
Defensive Backs
#13
Jaylen Allen
#1
Mumu Bin-Wahad
#10
Tre Fulton
#2
Denver Harris
#24
Avery Helm
#5
Quandarius Keyes
#4
Tony-Louis Nkuba
#7
Jake Pope
#21
Joshua Tuchek
Other
#32
Ramon Villela
California
10th in ACC
VS
UNLV
3rd in Mountain West
Passing
66.0
Completion Percentage
57.4
225
Completions
109
1.50
Interception Percentage
2.10
5
Interceptions
4
91
Longest Pass
70
2,282
Net Passing Yards
1,395
285.3
Net Passing Yards Per Game
199.3
341
Passing Attempts
190
3.80
Passing Touchdown %
5.30
13
Passing Touchdowns
10
131.9
Passer Rating
131.9
15
Total Sacks
17
108
Sack Yards Lost
138
6.7
Yards Per Pass Attempt
7.3
2,282
Passing Yards
1,395
0
Passing Fumbles Lost
0
8
Team Games Played
7
369.3
Yards Per Game
370.6
23.4
Total Points Per Game
24.1
187
Total Points
169
23
Total Touchdowns
21
285.3
Passing Yards Per Game
199.3
225-341
Comp-Att
109-190
15-108
Sacks-Yards Lost
17-138
Rushing
220
Rushing Attempts
275
672
Rushing Yards
1,199
3.1
Yards Per Rush Attempt
4.4
29
Long Rushing
55
0
20+ Yard Rushing Plays
0
8
Rushing Touchdowns
9
84.0
Rushing Yards Per Game
171.3
0
Rushing Fumbles
0
0
Rushing Fumbles Lost
0
39
Rushing 1st downs
59
8
Team Games Played
7
2,954
Total Yards
2,594
576
Total Offensive Plays
482
23.4
Total Points Per Game
24.1
187
Total Points
169
23
Total Touchdowns
21
Receiving
225
Receptions
109
0
Receiving Targets
0
2,282
Receiving Yards
1,395
2,282
Receiving Yards
1,395
13
Receiving Touchdowns
10
91
Long Reception
70
0
20+ Yard Receiving Plays
0
285.3
Receiving Yards Per Game
199.3
0
Receiving Fumbles
0
0
Receiving Fumbles Lost
0
1367
Receiving Yards After Catch
415
97
Receiving First Downs
62
8
Team Games Played
7
10.1
Yards Per Reception
12.8
23.4
Total Points Per Game
24.1
187
Total Points
169
23
Total Touchdowns
21
Miscellaneous
161
Total 1st downs
137
39
Rushing 1st downs
59
97
Passing 1st downs
62
24
1st downs by penalty
16
44
Third Down Conversions
43
121
Third Down Attempts
104
36.36
3rd down %
41.35
6
Fourth Down Conversions
6
21
First Downs Attempts
14
28.57
4th down %
42.86
73
Total Penalties
46
682
Total Penalty Yards
459
14490
Possession Time Seconds
12394
0.00
Red Zone Field Goal Percentage
0.00
0.00
Red Zone Scoring Percentage
0.00
0.00
Red Zone Efficiency Percentage
0.00
0.00
Red Zone Touchdown Percentage
0.00
10
Total Takeaways
5
8
Total Giveaways
9
2
Turnover Ratio
-4
0
Fumbles Lost
0
44-121
3rd down efficiency
43-104
6-21
4th down efficiency
6-14
73-682
Total-Yards
46-459
Defense
264
Solo Tackles
223
242
Assist Tackles
260
506
Total Tackles
483
15
Sacks
16
102
Sack Yards
111
52
Stuffs
49
26
Passes Defended
28
14.9
Average Interception Yards
14.5
53
Long Interception
44
0
Miscellaneous Touchdowns
0
2
Kicks Blocked
0
30
Tackles For Loss
28
8
Team Games Played
7
Defensive Interceptions
7
Interceptions
8
104
Interception Yards
116
1
Interception Touchdowns
2
7-104
INT: Total
8-116
General
8
Fumbles
10
4
Forced Fumbles
4
5
Fumbles Recovered
1
1
Fumbles Touchdowns
0
8
Games Played
7
8-0
Fumbles-Lost
10-0
Returning
13
Kick Returns
6
244
Kick Return Yards
100
18.8
Yards Per Kick Return
16.7
46
Long Kick Return
27
0
Kick Return Touchdowns
0
11
Punt Returns
6
66
Punt Return Yards
53
6.0
Yards Per Punt Return
8.8
24
Long Punt Return
27
0
Punt Return Touchdowns
0
0
Punt Return Fair Catches
0
0
Kick Return Fumbles Lost
0
0
Punt Return Fumbles Lost
0
8
Team Games Played
7
11-66
Punt: Total
6-53
Kicking
9
Field Goal Made
7
13
Field Goal Attempts
9
69.2
Field Goal Percentage
77.8
41
Long Field Goal Made
60
0
Field Goal Attempts 1-19
0
2
Field Goal Attempts 20-29
2
7
Field Goal Attempts 30-39
5
2
Field Goal Attempts 40-49
1
2
Field Goal Attempts 50+
1
18
Extra Points Made
20
18
Extra Point Attempts
20
100.0
Extra Point Percentage
100.0
0
Field Goals Made 1-19
0
2
Field Goals Made 20-29
2
6
Field Goals Made 30-39
4
1
Field Goals Made 40-49
0
0
Field Goals Made 50+
1
45
Total Kicking Points
41
8
Team Games Played
7
42
Touchback Percentage
42
0.0
Average Kickoff Return Yards
0.0
0
Kickoff Return Yards
0
0
Kickoff Returns
0
0-0
Kickoffs: Total
0-0
9-13
FG: Good-Attempts
7-9
Punting
39
Punts
34
1,670
Punt Yards
1,430
66
Long Punt
64
42.8
Gross Average Punt Yards
42.1
42.8
Net Average Punt Yards
42.1
0
Punts Blocked
0
9
Punts Inside 20
16
1
Touchbacks
3
14
Fair Catches
15
13
Punt Returns
8
0
Punt Return Yards
0
0.0
Average Punt Return Yards
0.0
8
Team Games Played
7
39-1,670
Punt: Total Yards
34-1,430
Scoring
8
Rushing Touchdowns
9
13
Receiving Touchdowns
10
0
Return Touchdowns
0
22
Total Touchdowns
19
9
Field Goals
7
18
Kick Extra Points
20
2
Total Two Point Conversions
1
187
Total Points
169
23.4
Total Points Per Game
24.1