

Central Connecticut vs Toledo Live Score (12 Sep, 2026)
Score by Quarter
| Team | Q1 | Q2 | Q3 | Q4 | Final |
|---|---|---|---|---|---|
 Central Connecticut |
3 | 0 | 0 | 7 | 10 |
 Toledo |
14 | 21 | 21 | 7 | 63 |
Scoring Plays
Q1
14:36
14:36
J. Hennessey 25 yd FG GOOD
Field Goal Good
3 – 0
Q1
10:57
10:57
J. Richter pass to C. Walendzak for 4 yds, for a TD (R. Griffith KICK)
Passing Touchdown
3 – 8
Q1
1:01
1:01
J. Richter pass to R. Bond for 85 yds, for a TD (R. Griffith KICK)
Passing Touchdown
3 – 8
Q2
12:07
12:07
A. Ison run for 3 yds, for a TD (R. Griffith KICK)
Rush
3 – 21
Q2
8:35
8:35
CJ Miller run for 14 yds, for a TD (R. Griffith KICK)
Rushing Touchdown
3 – 28
Q2
1:23
1:23
punt blocked by H. Roy (R. Griffith KICK)
Punt
3 – 35
Q3
9:49
9:49
J. Richter pass to A. Dabbs for 4 yds, for a TD (R. Griffith KICK)
Passing Touchdown
3 – 42
Q3
5:16
5:16
C. Walendzak run for 1 yd, for a TD (R. Griffith KICK)
Rushing Touchdown
3 – 49
Q3
1:00
1:00
K. Robinson run for 38 yds, for a TD (R. Griffith KICK)
Rushing Touchdown
3 – 56
Q4
12:40
12:40
K. Robinson pass intercepted, for a TD (J. Hennessey KICK)
Interception
10 – 56
Q4
3:42
3:42
W. Moses pass to C. Rusk for 40 yds, for a TD (R. Griffith KICK)
Passing Touchdown
10 – 63
Game Leaders
Central ConnecticutToledo
 C. Kenyon QB
Passing Yards
 J. Richter QB
 B. Griffis QB
Rushing Yards
 C. Miller RB
 D. Williams WR
Receiving Yards
 R. Bond WR
 J. Staton LB
Tackles
 J. Fox LB
—
Sacks
 A. Zock DE
Player Box Score
Central Connecticut| Player | C/ATT | YDS | AVG | TD | INT |
|---|---|---|---|---|---|
| Conner Kenyon#16 | 8/15 | 40 | 2.7 | 0 | 0 |
| Brett Griffis#10 | 5/18 | 26 | 1.4 | 0 | 1 |
Toledo| Player | C/ATT | YDS | AVG | TD | INT |
|---|---|---|---|---|---|
| John Alan Richter#6 | 15/24 | 252 | 10.5 | 3 | 0 |
 Walter Moses#11 | 1/1 | 40 | 40.0 | 1 | 0 |
 Khamoni Robinson#7 | 2/6 | 21 | 3.5 | 0 | 1 |
Central Connecticut| Player | CAR | YDS | AVG | TD | LONG |
|---|---|---|---|---|---|
| Brett Griffis#10 | 5 | 31 | 6.2 | 0 | 25 |
 Isaac Stopke#4 | 8 | 25 | 3.1 | 0 | 11 |
 Davon Smith Jr.#25 | 7 | 21 | 3.0 | 0 | 12 |
| Jeff Logan | 2 | 4 | 2.0 | 0 | 5 |
 John Manning IV#21 | 2 | -1 | -0.5 | 0 | 1 |
| Conner Kenyon#16 | 1 | -7 | -7.0 | 0 | 0 |
Toledo| Player | CAR | YDS | AVG | TD | LONG |
|---|---|---|---|---|---|
| CJ Miller#22 | 9 | 56 | 6.2 | 1 | 14 |
| Khamoni Robinson#7 | 3 | 49 | 16.3 | 1 | 38 |
 Connor Walendzak#8 | 6 | 34 | 5.7 | 1 | 23 |
 Autavius Ison#4 | 7 | 33 | 4.7 | 1 | 9 |
 Corey Smith#20 | 7 | 30 | 4.3 | 0 | 12 |
 Noah Sanders#23 | 4 | 26 | 6.5 | 0 | 23 |
 Terrell Crosby Jr.#5 | 1 | 18 | 18.0 | 0 | 18 |
| Walter Moses#11 | 2 | 8 | 4.0 | 0 | 5 |
 Dane Nauman#27 | 1 | 2 | 2.0 | 0 | 2 |
| John Alan Richter#6 | 1 | 1 | 1.0 | 0 | 1 |
| Kadale Williams#28 | 2 | 1 | 0.5 | 0 | 3 |
| Team | 2 | -2 | -1.0 | 0 | 2 |
Central Connecticut| Player | REC | YDS | AVG | TD | LONG |
|---|---|---|---|---|---|
| Damani Williams#2 | 4 | 21 | 5.3 | 0 | 8 |
 Arturo Johnson Jr.#87 | 2 | 19 | 9.5 | 0 | 17 |
| Austyn Howe#8 | 1 | 8 | 8.0 | 0 | 8 |
 Amarri Pitts#85 | 1 | 6 | 6.0 | 0 | 6 |
| Isaac Stopke#4 | 2 | 6 | 3.0 | 0 | 6 |
| Sean O'Brien#88 | 2 | 6 | 3.0 | 0 | 6 |
| Gabriel Wiggins#29 | 1 | 0 | 0.0 | 0 | 0 |
Toledo| Player | REC | YDS | AVG | TD | LONG |
|---|---|---|---|---|---|
| Rico Bond#1 | 4 | 135 | 33.8 | 1 | 85 |
 Bryson Hammer#12 | 3 | 57 | 19.0 | 0 | 23 |
 Cooper Rusk#13 | 1 | 40 | 40.0 | 1 | 40 |
 Adjatay Dabbs#3 | 4 | 34 | 8.5 | 1 | 14 |
| Terrell Crosby Jr.#5 | 2 | 22 | 11.0 | 0 | 13 |
 Tashi Braceful#14 | 1 | 11 | 11.0 | 0 | 11 |
 Anthony Simpson#85 | 1 | 10 | 10.0 | 0 | 10 |
| Connor Walendzak#8 | 1 | 4 | 4.0 | 1 | 4 |
 Daryl Barnett Jr.#19 | 1 | 0 | 0.0 | 0 | 0 |
Central Connecticut| Player | TOT | SOLO | SACKS | TFL | PD | QB HUR | TD |
|---|---|---|---|---|---|---|---|
| Jacob Staton#23 | 8 | 4 | 0 | 0 | 0 | 1 | 0 |
| Deonte Douglas#38 | 7 | 6 | 0 | 0 | 0 | 0 | 0 |
 Daren Omoregie | 7 | 1 | 0 | 0.5 | 0 | 0 | 0 |
 Eric Jackson#2 | 6 | 3 | 0 | 0.5 | 2 | 0 | 0 |
 Keith Moko#3 | 4 | 3 | 0 | 0 | 1 | 0 | 0 |
 Braswell Thomas#13 | 4 | 2 | 0 | 0 | 0 | 0 | 0 |
 Shae Terry#27 | 3 | 3 | 0 | 0 | 0 | 0 | 0 |
 Navon Mitchell#4 | 3 | 2 | 0 | 0 | 1 | 0 | 0 |
 Amir Proctor#26 | 3 | 1 | 0 | 0 | 0 | 0 | 0 |
 Malachai Mapp#47 | 3 | 1 | 0 | 0 | 0 | 0 | 0 |
 Mykhi Davis#18 | 3 | 1 | 0 | 0 | 0 | 0 | 0 |
 LaZaryus Toombs#5 | 3 | 0 | 0 | 0.5 | 0 | 0 | 0 |
 Marcus Simmons Jr.#99 | 2 | 2 | 0 | 1 | 0 | 0 | 0 |
| James Mankaka#28 | 2 | 2 | 0 | 0 | 0 | 0 | 0 |
 Jaden Sasu#10 | 2 | 2 | 0 | 0 | 0 | 0 | 0 |
 Davion Jennings#6 | 2 | 1 | 0 | 0 | 1 | 0 | 0 |
 Wayne Coleman Jr.#1 | 2 | 1 | 0 | 0 | 0 | 0 | 0 |
| JJ Gibson#50 | 2 | 1 | 0 | 0.5 | 0 | 0 | 0 |
| Javez Caldwell#94 | 2 | 1 | 0 | 1 | 0 | 0 | 0 |
| Tymaine Smith#24 | 1 | 1 | 0 | 0 | 0 | 0 | 0 |
 Kyle Greene#35 | 1 | 1 | 0 | 0 | 0 | 0 | 0 |
 Jeremiah Tucker#54 | 1 | 0 | 0 | 0 | 0 | 0 | 0 |
Toledo| Player | TOT | SOLO | SACKS | TFL | PD | QB HUR | TD |
|---|---|---|---|---|---|---|---|
| Julian Fox#10 | 8 | 4 | 0 | 0 | 0 | 1 | 0 |
 Isaac Zay#44 | 7 | 2 | 0 | 0 | 1 | 0 | 0 |
 Armorion Smith#7 | 4 | 2 | 0 | 0 | 1 | 0 | 0 |
| Andrew Zock | 4 | 1 | 0.5 | 0.5 | 0 | 3 | 0 |
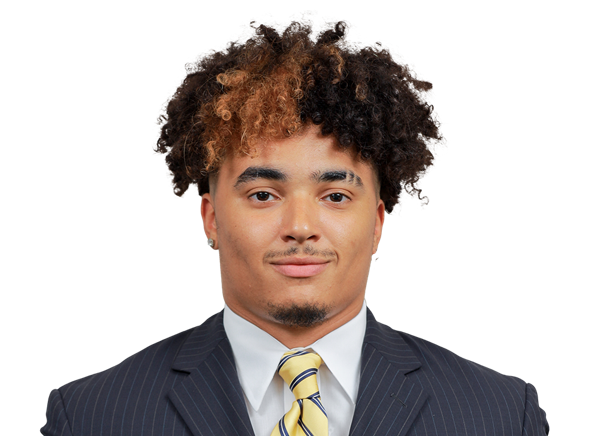 Damon Ollison II#5 | 3 | 3 | 0 | 1 | 0 | 0 | 0 |
| Mo Conteh#12 | 3 | 3 | 0 | 0 | 0 | 0 | 0 |
 Hyajah Miller#11 | 2 | 2 | 0 | 0 | 0 | 0 | 0 |
 Ezra Odinjor#2 | 2 | 1 | 0 | 1 | 1 | 0 | 0 |
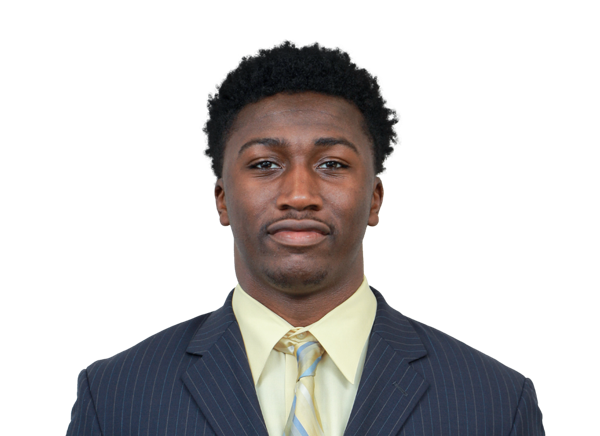 Nicholas Thompson#22 | 2 | 1 | 0 | 0 | 0 | 0 | 0 |
 Isaac Prince#19 | 2 | 1 | 0 | 0 | 1 | 0 | 0 |
 Cam Jones#1 | 2 | 1 | 0 | 0 | 0 | 0 | 0 |
 Nathan Gersh#36 | 2 | 1 | 0 | 0 | 0 | 0 | 0 |
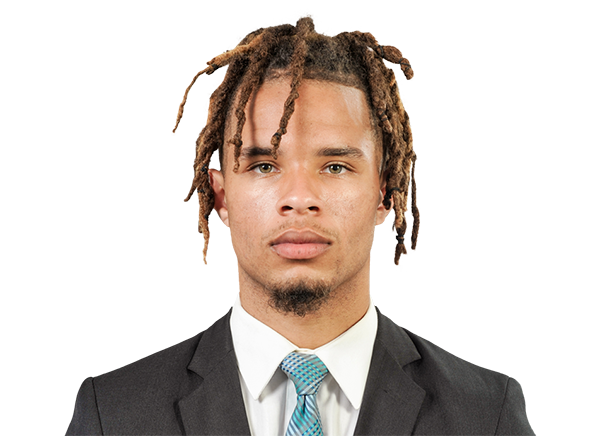 Kaleb Hutchinson#17 | 2 | 0 | 0 | 0 | 0 | 0 | 0 |
 Wayne Peart II#95 | 2 | 0 | 0 | 0 | 0 | 0 | 0 |
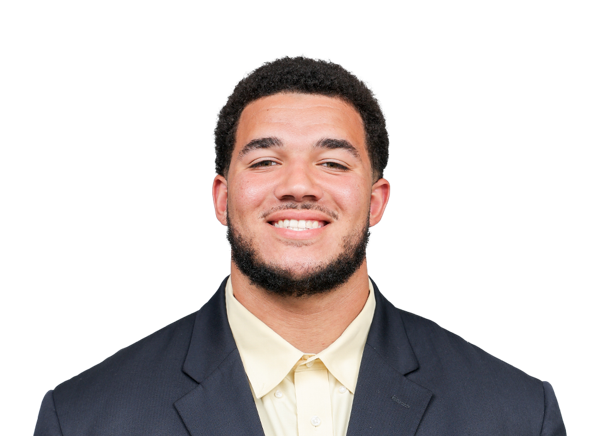 Lucas Lambert-Pipkin#52 | 1 | 1 | 0 | 1 | 0 | 0 | 0 |
 Dylan Hohler#39 | 1 | 1 | 0 | 0 | 0 | 0 | 0 |
| Sharard Vaughn III#3 | 1 | 1 | 0 | 0 | 0 | 0 | 0 |
 KJ Thomas#8 | 1 | 1 | 0 | 0 | 0 | 0 | 0 |
| Hayden Roy#30 | 1 | 1 | 0 | 0 | 0 | 0 | 1 |
 Adrian Love Jr.#94 | 1 | 1 | 0 | 1 | 0 | 0 | 0 |
| Connor Walendzak#8 | 1 | 0 | 0 | 0 | 0 | 0 | 0 |
 Donovan Watkins#4 | 1 | 0 | 0 | 0 | 1 | 0 | 0 |
 Nathaniel Chandler#96 | 1 | 0 | 0 | 0 | 1 | 0 | 0 |
 Tyler Hackenbracht#26 | 1 | 0 | 0 | 0 | 0 | 0 | 0 |
| Zach Johnson#90 | 1 | 0 | 0.5 | 0.5 | 0 | 0 | 0 |
 Andrew Fineske#33 | 1 | 0 | 0 | 0 | 0 | 0 | 0 |
| Micah Fils-Aime#98 | 1 | 0 | 0 | 0 | 0 | 0 | 0 |
 Tommy Huss#92 | 0 | 0 | 0 | 0 | 0 | 1 | 0 |
 Tyrell Russell#25 | 0 | 0 | 0 | 0 | 1 | 0 | 0 |
Central Connecticut| Player | FUM | LOST | REC |
|---|---|---|---|
 Jaden Langford#37 | 0 | 0 | 1 |
Toledo| Player | FUM | LOST | REC |
|---|---|---|---|
| Bryson Hammer#12 | 1 | 1 | 0 |
Central Connecticut| Player | FG | PCT | LONG | XP | PTS |
|---|---|---|---|---|---|
 Jack Hennessey#42 | 1/2 | 50.0 | 25 | 1/1 | 4 |
Toledo| Player | FG | PCT | LONG | XP | PTS |
|---|---|---|---|---|---|
 Reice Griffith#93 | 0/0 | 0.0 | 0 | 9/9 | 9 |
Central Connecticut| Player | NO | YDS | AVG | TB | In 20 | LONG |
|---|---|---|---|---|---|---|
| Sammy Johnson#95 | 9 | 338 | 37.6 | 0 | 3 | 41 |
| Team | 1 | 0 | 0.0 | 0 | 0 | 0 |
Toledo| Player | NO | YDS | AVG | TB | In 20 | LONG |
|---|---|---|---|---|---|---|
| Markus Meincke#47 | 2 | 76 | 38.0 | 0 | 2 | 43 |
Central Connecticut| Player | NO | YDS | AVG | LONG | TD |
|---|---|---|---|---|---|
| Gabriel Wiggins#29 | 5 | 84 | 16.8 | 20 | 0 |
| Navon Mitchell#4 | 1 | 25 | 25.0 | 25 | 0 |
Toledo| Player | NO | YDS | AVG | LONG | TD |
|---|---|---|---|---|---|
| Bryson Hammer#12 | 2 | 44 | 22.0 | 36 | 0 |
Toledo| Player | NO | YDS | AVG | LONG | TD |
|---|---|---|---|---|---|
| Bryson Hammer#12 | 1 | 5 | 5.0 | 5 | 0 |
| Hayden Roy#30 | 1 | 0 | 0.0 | 0 | 1 |
Central Connecticut| Player | INT | YDS | TD |
|---|---|---|---|
 Mel Jacobs#12 | 1 | 0 | 0 |
Toledo| Player | INT | YDS | TD |
|---|---|---|---|
| Isaac Zay#44 | 1 | 0 | 0 |
Drive Summary
CCSU
Field Goal
0
TOL
Touchdown
64
CCSU
Punt
27
TOL
Downs
62
CCSU
Punt
26
TOL
Touchdown
85
CCSU
Interception
8
TOL
Touchdown
27
CCSU
Punt
-5
TOL
Touchdown
53
CCSU
Missed FG
43
TOL
Punt
12
CCSU
Punt Return Touchdown
1
CCSU
End Of Half
1
CCSU
Punt
-3
TOL
Touchdown
58
CCSU
Punt
9
TOL
Touchdown
50
CCSU
Punt
0
TOL
Touchdown
63
CCSU
Punt
23
TOL
Interception Touchdown
-1
TOL
Punt
27
CCSU
Punt
0
TOL
Touchdown
56
CCSU
Punt
4
TOL
End Of Quarter
-16
Injury Report
No current injury report is available for this matchup.
Head-to-Head
Historical meetings are not available for this matchup.
Game Information
StageWeek 2
Season2026
KickoffSat, Sep 12, 3:30 pm
VenueGlass Bowl
LocationToledo, OH
SurfaceArtificial Turf
BroadcastESPN+
Division Standings
FCS — Northeast Conference
| Team | W | L | T | Pct | PF | PA | Home | Away | Strk |
|---|---|---|---|---|---|---|---|---|---|
 Robert Morris | 0 | 2 | 0 | 0.000 | 38 | 76 | 0-0 | 0-2 | L2 |
 Stonehill | 0 | 2 | 0 | 0.000 | 21 | 71 | 0-0 | 0-2 | L2 |
| Central Connecticut | 0 | 1 | 0 | 0.000 | 10 | 63 | 0-0 | 0-1 | L1 |
 Duquesne | 0 | 2 | 0 | 0.000 | 7 | 82 | 0-0 | 0-2 | L2 |
 Mercyhurst | 0 | 3 | 0 | 0.000 | 28 | 173 | 0-0 | 0-3 | L3 |
 Long Island University | 0 | 2 | 0 | 0.000 | 9 | 71 | 0-0 | 0-2 | L2 |
 New Haven | 0 | 0 | 0 | .000 | 0 | 0 | — | — | — |
 Wagner | 0 | 2 | 0 | 0.000 | 10 | 136 | 0-0 | 0-2 | L2 |
FBS — Mid-American Conference
| Team | W | L | T | Pct | PF | PA | Home | Away | Strk |
|---|---|---|---|---|---|---|---|---|---|
 Eastern Michigan | 4 | 7 | 0 | 0.364 | 226 | 300 | 2-3 | 2-4 | L4 |
 Massachusetts | 5 | 6 | 0 | 0.455 | 276 | 257 | 3-3 | 2-3 | L2 |
 Buffalo | 8 | 3 | 0 | 0.727 | 283 | 262 | 5-1 | 3-2 | W6 |
 Akron | 2 | 9 | 0 | 0.182 | 220 | 365 | 1-4 | 1-5 | W1 |
 Ball State | 3 | 8 | 0 | 0.273 | 241 | 376 | 2-2 | 1-6 | L3 |
 Central Michigan | 5 | 6 | 0 | 0.455 | 227 | 261 | 4-2 | 1-4 | L1 |
 Kent State | 3 | 8 | 0 | 0.273 | 160 | 328 | 3-2 | 0-6 | L3 |
 Miami (OH) | 7 | 4 | 0 | 0.636 | 301 | 260 | 4-2 | 3-2 | W2 |
| Toledo | 8 | 2 | 0 | 0.800 | 343 | 220 | 5-1 | 3-1 | W4 |
 Bowling Green | 3 | 7 | 0 | 0.300 | 193 | 289 | 2-3 | 1-4 | W1 |
 Ohio | 8 | 3 | 0 | 0.727 | 317 | 257 | 5-0 | 3-3 | W1 |
 Western Michigan | 8 | 3 | 0 | 0.727 | 312 | 214 | 4-1 | 4-2 | W3 |
 Sacramento State | 2 | 9 | 0 | 0.182 | 177 | 321 | 2-4 | 0-5 | L2 |
Central Connecticut
1st in NEC
VS
Toledo
1st in MAC
Quarterbacks & Specialists
#10
Brett Griffis
#95
Sammy Johnson
#16
Conner Kenyon
Receivers & Backs
#8
Austyn Howe
#87
Arturo Johnson Jr.
#40
Jeff Logan
#21
John Manning IV
#88
Sean O'Brien
#85
Amarri Pitts
#25
Davon Smith Jr.
#4
Isaac Stopke
#29
Gabriel Wiggins
#2
Damani Williams
Defensive Line & Linebackers
#94
Javez Caldwell
#1
Wayne Coleman Jr.
#50
JJ Gibson
#37
Jaden Langford
#47
Malachai Mapp
Daren Omoregie
#99
Marcus Simmons Jr.
#24
Tymaine Smith
#23
Jacob Staton
#13
Braswell Thomas
#5
LaZaryus Toombs
#54
Jeremiah Tucker
Defensive Backs
#18
Mykhi Davis
#38
Deonte Douglas
#35
Kyle Greene
#2
Eric Jackson
#12
Mel Jacobs
#6
Davion Jennings
#28
James Mankaka
#4
Navon Mitchell
#3
Keith Moko
#26
Amir Proctor
#10
Jaden Sasu
#27
Shae Terry
Other
#42
Jack Hennessey
Quarterbacks & Specialists
#47
Markus Meincke
#11
Walter Moses
#6
John Alan Richter
#7
Khamoni Robinson
Receivers & Backs
#19
Daryl Barnett Jr.
#1
Rico Bond
#14
Tashi Braceful
#5
Terrell Crosby Jr.
#3
Adjatay Dabbs
#12
Bryson Hammer
#4
Autavius Ison
#22
CJ Miller
#27
Dane Nauman
#13
Cooper Rusk
#23
Noah Sanders
#85
Anthony Simpson
#20
Corey Smith
#8
Connor Walendzak
#28
Kadale Williams
Defensive Line & Linebackers
#96
Nathaniel Chandler
#98
Micah Fils-Aime
#10
Julian Fox
#36
Nathan Gersh
#92
Tommy Huss
#90
Zach Johnson
#52
Lucas Lambert-Pipkin
#94
Adrian Love Jr.
#2
Ezra Odinjor
#5
Damon Ollison II
#95
Wayne Peart II
#19
Isaac Prince
#30
Hayden Roy
#44
Isaac Zay
Andrew Zock
Defensive Backs
#12
Mo Conteh
#33
Andrew Fineske
#26
Tyler Hackenbracht
#39
Dylan Hohler
#17
Kaleb Hutchinson
#1
Cam Jones
#11
Hyajah Miller
#25
Tyrell Russell
#7
Armorion Smith
#8
KJ Thomas
#22
Nicholas Thompson
#3
Sharard Vaughn III
#4
Donovan Watkins
Other
#93
Reice Griffith
Central Connecticut
1st in NEC
VS
Toledo
1st in MAC
Passing
56.3
Completion Percentage
64.9
139
Completions
198
2.80
Interception Percentage
1.30
7
Interceptions
4
58
Longest Pass
85
1,783
Net Passing Yards
2,562
178.3
Net Passing Yards Per Game
256.2
247
Passing Attempts
305
8.10
Passing Touchdown %
6.60
20
Passing Touchdowns
20
137.9
Passer Rating
154.5
14
Total Sacks
11
101
Sack Yards Lost
63
7.2
Yards Per Pass Attempt
8.4
1,783
Passing Yards
2,562
0
Passing Fumbles Lost
0
10
Team Games Played
10
371.7
Yards Per Game
453.0
33.5
Total Points Per Game
34.3
335
Total Points
343
45
Total Touchdowns
44
178.3
Passing Yards Per Game
256.2
139-247
Comp-Att
198-305
14-101
Sacks-Yards Lost
11-63
Rushing
363
Rushing Attempts
396
1,934
Rushing Yards
1,968
5.3
Yards Per Rush Attempt
5.0
85
Long Rushing
71
0
20+ Yard Rushing Plays
0
21
Rushing Touchdowns
21
193.4
Rushing Yards Per Game
196.8
0
Rushing Fumbles
0
0
Rushing Fumbles Lost
0
91
Rushing 1st downs
87
10
Team Games Played
10
3,717
Total Yards
4,530
624
Total Offensive Plays
712
33.5
Total Points Per Game
34.3
335
Total Points
343
45
Total Touchdowns
44
Receiving
139
Receptions
198
0
Receiving Targets
0
1,783
Receiving Yards
2,562
1,783
Receiving Yards
2,562
20
Receiving Touchdowns
20
58
Long Reception
85
0
20+ Yard Receiving Plays
0
178.3
Receiving Yards Per Game
256.2
0
Receiving Fumbles
0
0
Receiving Fumbles Lost
0
30
Receiving Yards After Catch
1255
80
Receiving First Downs
115
10
Team Games Played
10
12.8
Yards Per Reception
12.9
33.5
Total Points Per Game
34.3
335
Total Points
343
45
Total Touchdowns
44
Miscellaneous
188
Total 1st downs
214
91
Rushing 1st downs
87
82
Passing 1st downs
115
14
1st downs by penalty
12
50
Third Down Conversions
58
118
Third Down Attempts
137
42.37
3rd down %
42.34
5
Fourth Down Conversions
9
7
First Downs Attempts
24
71.43
4th down %
37.50
72
Total Penalties
83
556
Total Penalty Yards
717
19298
Possession Time Seconds
17808
0.00
Red Zone Field Goal Percentage
0.00
0.00
Red Zone Scoring Percentage
0.00
0.00
Red Zone Efficiency Percentage
0.00
0.00
Red Zone Touchdown Percentage
0.00
14
Total Takeaways
13
11
Total Giveaways
11
3
Turnover Ratio
2
0
Fumbles Lost
0
50-118
3rd down efficiency
58-137
5-7
4th down efficiency
9-24
72-556
Total-Yards
83-717
Defense
318
Solo Tackles
331
224
Assist Tackles
344
542
Total Tackles
675
17
Sacks
31
138
Sack Yards
236
76
Stuffs
101
45
Passes Defended
43
9.4
Average Interception Yards
24.0
27
Long Interception
67
0
Miscellaneous Touchdowns
0
4
Kicks Blocked
2
35
Tackles For Loss
58
10
Team Games Played
10
Defensive Interceptions
9
Interceptions
6
85
Interception Yards
144
2
Interception Touchdowns
2
9-85
INT: Total
6-144
General
10
Fumbles
11
9
Forced Fumbles
8
7
Fumbles Recovered
9
1
Fumbles Touchdowns
0
10
Games Played
10
10-0
Fumbles-Lost
11-0
Returning
40
Kick Returns
17
864
Kick Return Yards
263
21.6
Yards Per Kick Return
15.5
97
Long Kick Return
36
1
Kick Return Touchdowns
0
7
Punt Returns
10
60
Punt Return Yards
102
8.6
Yards Per Punt Return
10.2
19
Long Punt Return
22
0
Punt Return Touchdowns
1
0
Punt Return Fair Catches
0
0
Kick Return Fumbles Lost
0
0
Punt Return Fumbles Lost
0
10
Team Games Played
10
7-60
Punt: Total
10-102
Kicking
7
Field Goal Made
11
12
Field Goal Attempts
15
58.3
Field Goal Percentage
73.3
50
Long Field Goal Made
49
0
Field Goal Attempts 1-19
0
3
Field Goal Attempts 20-29
5
3
Field Goal Attempts 30-39
4
3
Field Goal Attempts 40-49
6
3
Field Goal Attempts 50+
0
42
Extra Points Made
42
43
Extra Point Attempts
42
97.7
Extra Point Percentage
100.0
0
Field Goals Made 1-19
0
2
Field Goals Made 20-29
5
2
Field Goals Made 30-39
3
2
Field Goals Made 40-49
3
1
Field Goals Made 50+
0
63
Total Kicking Points
75
10
Team Games Played
10
22
Touchback Percentage
35
0.0
Average Kickoff Return Yards
0.0
0
Kickoff Return Yards
0
0
Kickoff Returns
0
0-0
Kickoffs: Total
0-0
7-12
FG: Good-Attempts
11-15
Punting
42
Punts
36
1,598
Punt Yards
1,508
70
Long Punt
62
38.0
Gross Average Punt Yards
41.9
38.0
Net Average Punt Yards
41.9
0
Punts Blocked
0
9
Punts Inside 20
16
1
Touchbacks
2
23
Fair Catches
16
9
Punt Returns
8
0
Punt Return Yards
0
0.0
Average Punt Return Yards
0.0
10
Team Games Played
10
42-1,598
Punt: Total Yards
36-1,508
Scoring
21
Rushing Touchdowns
21
20
Receiving Touchdowns
20
1
Return Touchdowns
1
43
Total Touchdowns
42
7
Field Goals
11
42
Kick Extra Points
42
1
Total Two Point Conversions
1
335
Total Points
343
33.5
Total Points Per Game
34.3