

Central Michigan vs Miami Live Score (26 Sep, 2026)
Score by Quarter
| Team | Q1 | Q2 | Q3 | Q4 | Final |
|---|---|---|---|---|---|
 Central Michigan |
3 | 0 | 0 | 0 | 3 |
 Miami |
7 | 28 | 7 | 10 | 52 |
Scoring Plays
Q1
5:56
5:56
Caden VanHuis 49 Yd Field Goal
Field Goal Good
3 – 0
Q1
1:58
1:58
Javian Mallory 4 Yd Run (Jake Weinberg Kick)
Rushing Touchdown
3 – 7
Q2
12:47
12:47
Daylyn Upshaw 11 Yd pass from Darian Mensah (Jake Weinberg Kick)
Passing Touchdown
3 – 14
Q2
9:45
9:45
Malachi Toney 8 Yd pass from Darian Mensah (Jake Weinberg Kick)
Passing Touchdown
3 – 21
Q2
3:22
3:22
Cooper Barkate 13 Yd pass from Darian Mensah (Jake Weinberg Kick)
Passing Touchdown
3 – 28
Q2
0:06
0:06
Darian Mensah 5 Yd Run (Jake Weinberg Kick)
Rushing Touchdown
3 – 35
Q3
6:00
6:00
Jamal Meriweather 0 Yd Fumble Recovery (Jake Weinberg Kick)
Fumble Return Touchdown
3 – 42
Q4
13:17
13:17
Jake Weinberg 33 Yd Field Goal
Field Goal Good
3 – 45
Q4
10:29
10:29
Chris Wheatley-Humphrey 35 Yd Run (Jack Olsen Kick)
Rushing Touchdown
3 – 52
Game Leaders
Central MichiganMiami
 J. Glasser QB
Passing Yards
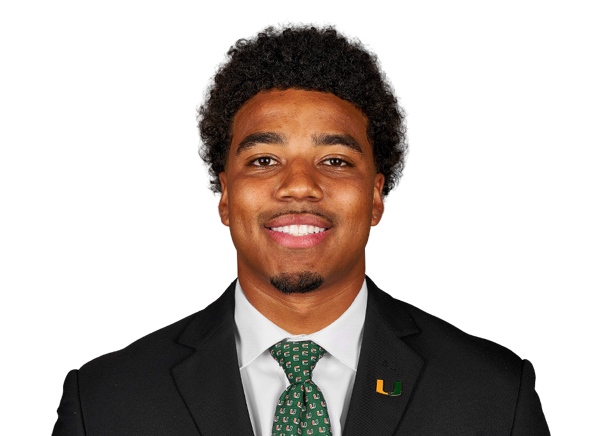 D. Mensah QB
 N. Woodford RB
Rushing Yards
 C. Wheatley-Humphrey RB
 T. Vanderleest WR
Receiving Yards
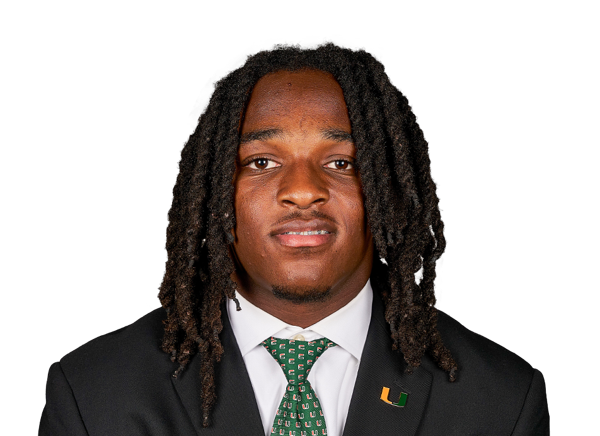 M. Toney WR
 N. VanTimmeren DL
Sacks
 M. Lightfoot DL
 D. Bryant Jr. DB
Tackles
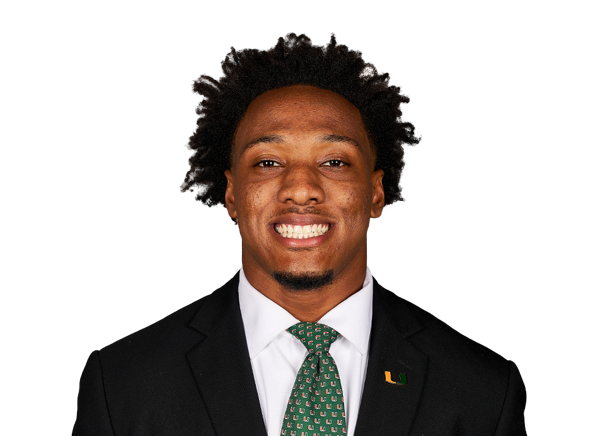 C. Pruitt LB
Player Box Score
Central Michigan| Player | C/ATT | YDS | AVG | TD | INT | QBR |
|---|---|---|---|---|---|---|
| Jadyn Glasser#5 | 13/15 | 88 | 5.9 | 0 | 1 | 47.5 |
 Marcus Beamon#10 | 3/4 | 29 | 7.3 | 0 | 0 | 43.8 |
 Angel Flores#7 | 5/7 | 20 | 2.9 | 0 | 0 | 78.1 |
Miami| Player | C/ATT | YDS | AVG | TD | INT | QBR |
|---|---|---|---|---|---|---|
| Darian Mensah#10 | 23/27 | 338 | 12.5 | 3 | 0 | 90.9 |
 Luke Nickel#5 | 4/7 | 33 | 4.7 | 0 | 0 | 28.0 |
Central Michigan| Player | CAR | YDS | AVG | TD | LONG |
|---|---|---|---|---|---|
| Nick Woodford#43 | 6 | 21 | 3.5 | 0 | 10 |
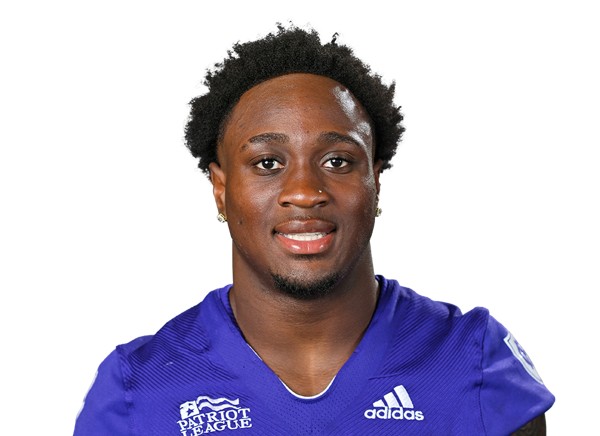 Jayden Clerveaux#31 | 6 | 13 | 2.2 | 0 | 4 |
| Angel Flores#7 | 3 | 8 | 2.7 | 0 | 9 |
 Brock Townsend#2 | 2 | 4 | 2.0 | 0 | 5 |
 Trav Moore#22 | 1 | 1 | 1.0 | 0 | 1 |
| Team | 1 | -4 | -4.0 | 0 | 0 |
 Langston Lewis#20 | 1 | -4 | -4.0 | 0 | 0 |
| Marcus Beamon#10 | 2 | -5 | -2.5 | 0 | 0 |
| Jadyn Glasser#5 | 3 | -13 | -4.3 | 0 | 0 |
Miami| Player | CAR | YDS | AVG | TD | LONG |
|---|---|---|---|---|---|
| Chris Wheatley-Humphrey#25 | 11 | 104 | 9.5 | 1 | 35 |
 Girard Pringle Jr. | 7 | 38 | 5.4 | 0 | 9 |
 Javian Mallory#21 | 5 | 30 | 6.0 | 1 | 11 |
| Darian Mensah#10 | 4 | 21 | 5.3 | 1 | 19 |
 Jordan Lyle#2 | 6 | 16 | 2.7 | 0 | 11 |
 Jamal Meriweather#71 | 0 | 0 | 0.0 | 1 | 0 |
| Luke Nickel#5 | 1 | -8 | -8.0 | 0 | 0 |
Central Michigan| Player | REC | YDS | AVG | TD | LONG |
|---|---|---|---|---|---|
| Tayte Vanderleest#81 | 1 | 24 | 24.0 | 0 | 24 |
| Langston Lewis#20 | 2 | 22 | 11.0 | 0 | 18 |
 Justin Ruffin Jr.#9 | 3 | 19 | 6.3 | 0 | 10 |
| Nick Woodford#43 | 5 | 15 | 3.0 | 0 | 5 |
 Myles Peters#85 | 2 | 11 | 5.5 | 0 | 8 |
 Nasir Williams#3 | 2 | 9 | 4.5 | 0 | 6 |
| Jayden Clerveaux#31 | 1 | 8 | 8.0 | 0 | 8 |
 Gavin Spillers#87 | 1 | 8 | 8.0 | 0 | 8 |
 Shawn Foster II#16 | 2 | 8 | 4.0 | 0 | 7 |
 Braylen Naves#17 | 1 | 7 | 7.0 | 0 | 7 |
 Collin Payne#6 | 1 | 6 | 6.0 | 0 | 6 |
Miami| Player | REC | YDS | AVG | TD | LONG |
|---|---|---|---|---|---|
| Malachi Toney#1 | 6 | 120 | 20.0 | 1 | 37 |
 Cooper Barkate#18 | 4 | 47 | 11.8 | 1 | 14 |
 Vandrevius Jacobs#8 | 3 | 43 | 14.3 | 0 | 21 |
 Elija Lofton#9 | 2 | 38 | 19.0 | 0 | 31 |
 Daylyn Upshaw#7 | 2 | 31 | 15.5 | 1 | 20 |
 Somourian Wingo#12 | 2 | 28 | 14.0 | 0 | 20 |
| Javian Mallory#21 | 2 | 26 | 13.0 | 0 | 20 |
 Vance Spafford#13 | 2 | 18 | 9.0 | 0 | 11 |
| Jordan Lyle#2 | 2 | 15 | 7.5 | 0 | 9 |
| Chris Wheatley-Humphrey#25 | 1 | 7 | 7.0 | 0 | 7 |
| Girard Pringle Jr. | 1 | -2 | -2.0 | 0 | 0 |
Central Michigan| Player | TOT | SOLO | SACKS | TFL | PD | QB HUR | TD |
|---|---|---|---|---|---|---|---|
| Darrell Bryant Jr.#19 | 7 | 4 | 0 | 0 | 0 | 0 | 0 |
 Jaxon Cherry#92 | 6 | 3 | 1 | 1 | 0 | 0 | 0 |
| Brett McCalla#40 | 6 | 2 | 0 | 0 | 0 | 0 | 0 |
 Justin Taylor#14 | 5 | 3 | 0 | 0 | 1 | 0 | 0 |
 Xavier White#11 | 5 | 3 | 0 | 0 | 0 | 0 | 0 |
 Coen Ali#17 | 5 | 3 | 0 | 1.5 | 0 | 0 | 0 |
 Mayson Hitchens#35 | 5 | 2 | 0 | 0 | 0 | 0 | 0 |
 JJ Douglas#1 | 5 | 1 | 0 | 0.5 | 0 | 0 | 0 |
 Donavan Philord#12 | 3 | 2 | 0 | 0 | 0 | 0 | 0 |
 Jeremiah Alston#10 | 3 | 1 | 0 | 0 | 0 | 0 | 0 |
 Antonio Cherry Jr.#30 | 3 | 0 | 0 | 0 | 0 | 0 | 0 |
 Max Van Fleet#97 | 2 | 2 | 0 | 0 | 0 | 0 | 0 |
 Matthew McKenzie#26 | 2 | 2 | 0 | 1 | 0 | 0 | 0 |
 James Reinbold#32 | 2 | 0 | 0 | 0 | 0 | 0 | 0 |
 Jajuan Jones#20 | 2 | 0 | 0 | 0 | 0 | 0 | 0 |
| Nathan VanTimmeren#48 | 1 | 1 | 1 | 1 | 0 | 0 | 0 |
 Tysen Campbell#27 | 1 | 1 | 0 | 0 | 0 | 0 | 0 |
 Declan Duley#18 | 1 | 1 | 0 | 0 | 0 | 0 | 0 |
 Ty Williams#24 | 1 | 1 | 0 | 0 | 0 | 0 | 0 |
 Jamari Allen#21 | 1 | 0 | 0 | 0 | 0 | 0 | 0 |
 Kyle Krebs#23 | 1 | 0 | 0 | 0 | 0 | 0 | 0 |
 Jaion Jackson#4 | 1 | 0 | 0 | 0 | 0 | 0 | 0 |
 Korver Demma#5 | 1 | 0 | 0 | 0 | 0 | 0 | 0 |
 Landon Swanson#42 | 1 | 0 | 0 | 0 | 0 | 0 | 0 |
 Nolan Anderson#22 | 1 | 0 | 0 | 0 | 0 | 0 | 0 |
 Zach Curtis#51 | 1 | 0 | 0 | 0 | 0 | 0 | 0 |
 D.J. Bennett | 0 | 0 | 0 | 0 | 1 | 0 | 0 |
 Kameran Hayward#43 | 0 | 0 | 0 | 0 | 1 | 0 | 0 |
Miami| Player | TOT | SOLO | SACKS | TFL | PD | QB HUR | TD |
|---|---|---|---|---|---|---|---|
| Cam Pruitt#4 | 6 | 2 | 0 | 0 | 0 | 0 | 0 |
 Omar Thornton | 5 | 4 | 1 | 2 | 0 | 0 | 0 |
 Ryan Mack#27 | 4 | 3 | 1 | 1 | 0 | 0 | 0 |
| Marquise Lightfoot#8 | 4 | 2 | 2 | 2.5 | 0 | 0 | 0 |
 Mohamed Toure#1 | 3 | 2 | 0 | 0 | 0 | 0 | 0 |
 Isaiah Taylor#28 | 3 | 2 | 0 | 0 | 0 | 0 | 0 |
 Ethan O'Connor#24 | 3 | 2 | 0 | 0 | 1 | 0 | 0 |
 Chase Smith#9 | 3 | 1 | 0 | 0 | 0 | 0 | 0 |
 Kamal Bonner#11 | 3 | 1 | 0 | 0 | 0 | 0 | 0 |
 Brody Jennings#15 | 3 | 1 | 0 | 0 | 0 | 0 | 0 |
 Justin Scott#5 | 2 | 2 | 0 | 1 | 0 | 0 | 0 |
 Booker Pickett Jr.#33 | 1 | 1 | 0 | 0 | 0 | 0 | 0 |
 Armondo Blount#18 | 1 | 1 | 0 | 1 | 0 | 0 | 0 |
 Zechariah Poyser#7 | 1 | 1 | 0 | 0 | 0 | 0 | 0 |
 JJ Dunnigan#25 | 1 | 1 | 0 | 0 | 0 | 0 | 0 |
 Chris Ewald Jr.#20 | 1 | 1 | 0 | 0 | 0 | 0 | 0 |
 Ezekiel Marcelin Jr.#17 | 1 | 0 | 0 | 0 | 0 | 0 | 0 |
 Keshawn Stancil#40 | 1 | 0 | 0 | 0 | 0 | 0 | 0 |
 Herbert Scroggins III#31 | 1 | 0 | 0 | 0 | 0 | 0 | 0 |
 Keona Davis#97 | 1 | 0 | 0 | 0.5 | 0 | 0 | 0 |
 DeAnthony Lafayette#88 | 1 | 0 | 0 | 0 | 0 | 0 | 0 |
 Samuel Coufal#92 | 0 | 0 | 0 | 0 | 0 | 1 | 0 |
Central Michigan| Player | FUM | LOST | REC |
|---|---|---|---|
| Team | 1 | 1 | 0 |
| Jadyn Glasser#5 | 1 | 1 | 0 |
Miami| Player | FUM | LOST | REC |
|---|---|---|---|
| Jordan Lyle#2 | 1 | 0 | 0 |
 Damon Wilson II#10 | 0 | 0 | 1 |
| JJ Dunnigan#25 | 0 | 0 | 1 |
Central Michigan| Player | FG | PCT | LONG | XP | PTS |
|---|---|---|---|---|---|
 Caden VanHuis#38 | 1/1 | 100.0 | 49 | 0/0 | 3 |
Miami| Player | FG | PCT | LONG | XP | PTS |
|---|---|---|---|---|---|
 Jake Weinberg#22 | 1/1 | 100.0 | 33 | 6/6 | 9 |
 Jack Olsen#82 | 0/0 | 0.0 | 0 | 1/1 | 1 |
Central Michigan| Player | NO | YDS | AVG | TB | In 20 | LONG |
|---|---|---|---|---|---|---|
| Declan Duley#18 | 5 | 231 | 46.2 | 0 | 1 | 63 |
Miami| Player | NO | YDS | AVG | TB | In 20 | LONG |
|---|---|---|---|---|---|---|
 Dylan Joyce#94 | 1 | 36 | 36.0 | 0 | 0 | 36 |
Miami| Player | NO | YDS | AVG | LONG | TD |
|---|---|---|---|---|---|
| Somourian Wingo#12 | 1 | 22 | 22.0 | 22 | 0 |
Miami| Player | NO | YDS | AVG | LONG | TD |
|---|---|---|---|---|---|
| Somourian Wingo#12 | 2 | 50 | 25.0 | 42 | 0 |
| Malachi Toney#1 | 1 | 0 | 0.0 | 0 | 0 |
Miami| Player | INT | YDS | TD |
|---|---|---|---|
| Brody Jennings#15 | 1 | 24 | 0 |
Drive Summary
MIA
Punt
10
CMU
Field Goal
40
MIA
Touchdown
71
CMU
Punt
5
MIA
Touchdown
69
CMU
Fumble
2
MIA
Touchdown
27
CMU
Punt
-5
MIA
Touchdown
66
CMU
Punt
25
MIA
Touchdown
97
CMU
End of Half
3
CMU
Fumble
38
MIA
Fumble Return Touchdown
65
CMU
Punt
3
MIA
Field Goal
34
CMU
Punt
2
MIA
Touchdown
58
CMU
Interception
45
MIA
End of Game
22
Injury Report
No current injury report is available for this matchup.
Head-to-Head
Historical meetings are not available for this matchup.
Game Information
StageWeek 4
Season2026
KickoffSat, Sep 26, 6:30 pm
VenueHard Rock Stadium
LocationMiami Gardens, FL
SurfaceGrass
BroadcastCW
Attendance65,338
Division Standings
FBS — Mid-American Conference
| Team | W | L | T | Pct | PF | PA | Home | Away | Strk |
|---|---|---|---|---|---|---|---|---|---|
 Massachusetts | 5 | 6 | 0 | 0.455 | 276 | 257 | 3-3 | 2-3 | L2 |
 Kent State | 3 | 8 | 0 | 0.273 | 160 | 328 | 3-2 | 0-6 | L3 |
 Eastern Michigan | 4 | 7 | 0 | 0.364 | 226 | 300 | 2-3 | 2-4 | L4 |
 Toledo | 8 | 2 | 0 | 0.800 | 343 | 220 | 5-1 | 3-1 | W4 |
 Buffalo | 8 | 3 | 0 | 0.727 | 283 | 262 | 5-1 | 3-2 | W6 |
| Central Michigan | 5 | 6 | 0 | 0.455 | 227 | 261 | 4-2 | 1-4 | L1 |
 Miami (OH) | 7 | 4 | 0 | 0.636 | 301 | 260 | 4-2 | 3-2 | W2 |
 Ohio | 8 | 3 | 0 | 0.727 | 317 | 257 | 5-0 | 3-3 | W1 |
 Western Michigan | 8 | 3 | 0 | 0.727 | 312 | 214 | 4-1 | 4-2 | W3 |
 Akron | 2 | 9 | 0 | 0.182 | 220 | 365 | 1-4 | 1-5 | W1 |
 Bowling Green | 3 | 7 | 0 | 0.300 | 193 | 289 | 2-3 | 1-4 | W1 |
 Ball State | 3 | 8 | 0 | 0.273 | 241 | 376 | 2-2 | 1-6 | L3 |
 Sacramento State | 2 | 9 | 0 | 0.182 | 177 | 321 | 2-4 | 0-5 | L2 |
FBS — Atlantic Coast Conference
| Team | W | L | T | Pct | PF | PA | Home | Away | Strk |
|---|---|---|---|---|---|---|---|---|---|
| Miami | 9 | 1 | 0 | 0.900 | 441 | 198 | 5-0 | 4-1 | W1 |
 Clemson | 6 | 4 | 0 | 0.600 | 210 | 206 | 3-3 | 3-1 | L1 |
 Duke | 7 | 3 | 0 | 0.700 | 322 | 153 | 4-1 | 3-2 | L1 |
 Pittsburgh | 6 | 4 | 0 | 0.600 | 297 | 194 | 5-2 | 1-2 | L1 |
 Virginia Tech | 6 | 4 | 0 | 0.600 | 330 | 255 | 3-2 | 3-2 | L2 |
 Virginia | 5 | 5 | 0 | 0.500 | 269 | 215 | 5-2 | 0-3 | W1 |
 Wake Forest | 9 | 1 | 0 | 0.900 | 439 | 150 | 4-1 | 5-0 | W7 |
 Louisville | 7 | 3 | 0 | 0.700 | 383 | 247 | 4-1 | 3-2 | W5 |
 SMU | 7 | 3 | 0 | 0.700 | 340 | 255 | 6-1 | 1-2 | L1 |
 California | 3 | 7 | 0 | 0.300 | 204 | 320 | 2-3 | 1-4 | L4 |
 Stanford | 5 | 5 | 0 | 0.500 | 223 | 358 | 4-1 | 1-4 | W1 |
 North Carolina | 5 | 5 | 0 | 0.500 | 258 | 221 | 1-4 | 4-1 | L1 |
 Boston College | 4 | 6 | 0 | 0.400 | 204 | 284 | 3-2 | 1-4 | L3 |
 Florida State | 5 | 5 | 0 | 0.500 | 292 | 265 | 3-2 | 2-3 | W2 |
 NC State | 4 | 6 | 0 | 0.400 | 291 | 282 | 4-3 | 0-3 | L2 |
 Georgia Tech | 3 | 7 | 0 | 0.300 | 235 | 296 | 2-4 | 1-3 | W1 |
 Syracuse | 5 | 5 | 0 | 0.500 | 298 | 260 | 2-3 | 3-2 | W1 |
Central Michigan
7th in MAC
VS
Miami
1st in ACC
Quarterbacks & Specialists
#10
Marcus Beamon
#51
Zach Curtis
#18
Declan Duley
#7
Angel Flores
#5
Jadyn Glasser
Receivers & Backs
#31
Jayden Clerveaux
#16
Shawn Foster II
#20
Langston Lewis
#22
Trav Moore
#17
Braylen Naves
#6
Collin Payne
#85
Myles Peters
#9
Justin Ruffin Jr.
#87
Gavin Spillers
#42
Landon Swanson
#2
Brock Townsend
#81
Tayte Vanderleest
#3
Nasir Williams
#43

Nick Woodford
Defensive Line & Linebackers
#10
Jeremiah Alston
D.J. Bennett
#92
Jaxon Cherry
#30
Antonio Cherry Jr.
#5
Korver Demma
#1
JJ Douglas
#35
Mayson Hitchens
#40
Brett McCalla
#32
James Reinbold
#97
Max Van Fleet
#48
Nathan VanTimmeren
#11
Xavier White
Defensive Backs
#17
Coen Ali
#21
Jamari Allen
#22
Nolan Anderson
#19
Darrell Bryant Jr.
#27
Tysen Campbell
#43
Kameran Hayward
#4
Jaion Jackson
#20
Jajuan Jones
#23
Kyle Krebs
#26
Matthew McKenzie
#12
Donavan Philord
#14
Justin Taylor
#24
Ty Williams
Other
#38
Caden VanHuis
Quarterbacks & Specialists
#94
Dylan Joyce
#10
Darian Mensah
#5
Luke Nickel
Offensive Line
#71
Jamal Meriweather
Receivers & Backs
#18
Cooper Barkate
#8
Vandrevius Jacobs
#9
Elija Lofton
#2
Jordan Lyle
#21
Javian Mallory
Girard Pringle Jr.
#13
Vance Spafford
#1
Malachi Toney
#7
Daylyn Upshaw
#25
Chris Wheatley-Humphrey
#12
Somourian Wingo
Defensive Line & Linebackers
#18
Armondo Blount
#11
Kamal Bonner
#92
Samuel Coufal
#97
Keona Davis
#88
DeAnthony Lafayette
#8
Marquise Lightfoot
#17
Ezekiel Marcelin Jr.
#33
Booker Pickett Jr.
#4
Cam Pruitt
#5
Justin Scott
#31
Herbert Scroggins III
#9
Chase Smith
#40
Keshawn Stancil
#1
Mohamed Toure
#10
Damon Wilson II
Defensive Backs
#25
JJ Dunnigan
#20
Chris Ewald Jr.
#15
Brody Jennings
#27
Ryan Mack
#24
Ethan O'Connor
#7
Zechariah Poyser
#28
Isaiah Taylor
Omar Thornton
Other
#82
Jack Olsen
#22
Jake Weinberg
Central Michigan
7th in MAC
VS
Miami
1st in ACC
Passing
59.2
Completion Percentage
76.4
141
Completions
262
2.90
Interception Percentage
0.90
7
Interceptions
3
71
Longest Pass
63
1,394
Net Passing Yards
3,310
126.7
Net Passing Yards Per Game
331.0
238
Passing Attempts
343
3.40
Passing Touchdown %
9.30
8
Passing Touchdowns
32
114.1
Passer Rating
186.9
21
Total Sacks
12
133
Sack Yards Lost
72
5.9
Yards Per Pass Attempt
9.7
1,394
Passing Yards
3,310
0
Passing Fumbles Lost
0
11
Team Games Played
10
318.0
Yards Per Game
518.1
20.6
Total Points Per Game
44.1
227
Total Points
441
31
Total Touchdowns
58
126.7
Passing Yards Per Game
331.0
141-238
Comp-Att
262-343
21-133
Sacks-Yards Lost
12-72
Rushing
456
Rushing Attempts
355
2,104
Rushing Yards
1,871
4.6
Yards Per Rush Attempt
5.3
55
Long Rushing
52
0
20+ Yard Rushing Plays
0
22
Rushing Touchdowns
25
191.3
Rushing Yards Per Game
187.1
0
Rushing Fumbles
0
0
Rushing Fumbles Lost
0
129
Rushing 1st downs
92
11
Team Games Played
10
3,498
Total Yards
5,181
715
Total Offensive Plays
710
20.6
Total Points Per Game
44.1
227
Total Points
441
31
Total Touchdowns
58
Receiving
141
Receptions
262
0
Receiving Targets
0
1,394
Receiving Yards
3,310
1,394
Receiving Yards
3,310
8
Receiving Touchdowns
32
71
Long Reception
63
0
20+ Yard Receiving Plays
0
126.7
Receiving Yards Per Game
331.0
0
Receiving Fumbles
0
0
Receiving Fumbles Lost
0
721
Receiving Yards After Catch
1871
46
Receiving First Downs
158
11
Team Games Played
10
9.9
Yards Per Reception
12.6
20.6
Total Points Per Game
44.1
227
Total Points
441
31
Total Touchdowns
58
Miscellaneous
194
Total 1st downs
271
129
Rushing 1st downs
92
46
Passing 1st downs
158
17
1st downs by penalty
20
63
Third Down Conversions
60
152
Third Down Attempts
114
41.45
3rd down %
52.63
22
Fourth Down Conversions
6
33
First Downs Attempts
12
66.67
4th down %
50.00
63
Total Penalties
66
566
Total Penalty Yards
567
20400
Possession Time Seconds
20030
0.00
Red Zone Field Goal Percentage
0.00
0.00
Red Zone Scoring Percentage
0.00
0.00
Red Zone Efficiency Percentage
0.00
0.00
Red Zone Touchdown Percentage
0.00
14
Total Takeaways
9
15
Total Giveaways
5
-1
Turnover Ratio
4
0
Fumbles Lost
0
63-152
3rd down efficiency
60-114
22-33
4th down efficiency
6-12
63-566
Total-Yards
66-567
Defense
286
Solo Tackles
317
460
Assist Tackles
240
746
Total Tackles
557
16
Sacks
24
108
Sack Yards
132
65
Stuffs
62
35
Passes Defended
31
12.9
Average Interception Yards
12.2
46
Long Interception
39
0
Miscellaneous Touchdowns
0
1
Kicks Blocked
0
28
Tackles For Loss
41
11
Team Games Played
10
Defensive Interceptions
10
Interceptions
5
129
Interception Yards
61
1
Interception Touchdowns
1
10-129
INT: Total
5-61
General
12
Fumbles
6
6
Forced Fumbles
5
7
Fumbles Recovered
6
0
Fumbles Touchdowns
0
11
Games Played
10
12-0
Fumbles-Lost
6-0
Returning
12
Kick Returns
16
284
Kick Return Yards
289
23.7
Yards Per Kick Return
18.1
33
Long Kick Return
27
0
Kick Return Touchdowns
0
8
Punt Returns
10
45
Punt Return Yards
117
5.6
Yards Per Punt Return
11.7
11
Long Punt Return
42
0
Punt Return Touchdowns
0
0
Punt Return Fair Catches
0
0
Kick Return Fumbles Lost
0
0
Punt Return Fumbles Lost
0
11
Team Games Played
10
8-45
Punt: Total
10-117
Kicking
4
Field Goal Made
11
8
Field Goal Attempts
12
50.0
Field Goal Percentage
91.7
49
Long Field Goal Made
50
0
Field Goal Attempts 1-19
1
3
Field Goal Attempts 20-29
5
1
Field Goal Attempts 30-39
2
2
Field Goal Attempts 40-49
2
2
Field Goal Attempts 50+
2
29
Extra Points Made
56
31
Extra Point Attempts
56
93.5
Extra Point Percentage
100.0
0
Field Goals Made 1-19
1
2
Field Goals Made 20-29
5
1
Field Goals Made 30-39
2
1
Field Goals Made 40-49
2
0
Field Goals Made 50+
1
41
Total Kicking Points
89
11
Team Games Played
10
30
Touchback Percentage
88
0.0
Average Kickoff Return Yards
0.0
0
Kickoff Return Yards
0
0
Kickoff Returns
0
0-0
Kickoffs: Total
0-0
4-8
FG: Good-Attempts
11-12
Punting
42
Punts
26
1,848
Punt Yards
1,167
86
Long Punt
59
44.0
Gross Average Punt Yards
44.9
44.0
Net Average Punt Yards
44.9
0
Punts Blocked
0
16
Punts Inside 20
9
4
Touchbacks
1
10
Fair Catches
12
14
Punt Returns
9
0
Punt Return Yards
0
0.0
Average Punt Return Yards
0.0
11
Team Games Played
10
42-1,848
Punt: Total Yards
26-1,167
Scoring
22
Rushing Touchdowns
25
8
Receiving Touchdowns
32
0
Return Touchdowns
0
30
Total Touchdowns
57
4
Field Goals
11
29
Kick Extra Points
56
0
Total Two Point Conversions
1
227
Total Points
441
20.6
Total Points Per Game
44.1