

Central Michigan vs New Mexico Live Score (6 Sep, 2026)
Score by Quarter
| Team | Q1 | Q2 | Q3 | Q4 | Final |
|---|---|---|---|---|---|
 Central Michigan | 0 | 0 | 0 | 7 | 7 |
 New Mexico | 7 | 13 | 15 | 3 | 38 |
Scoring Plays
Q1
7:18
7:18
Scottre Humphrey 7 Yd Run (Grant Glasgow Kick)
Rushing Touchdown
0 – 7
Q2
12:56
12:56
James Laubstein 1 Yd Run (Grant Glasgow Kick)
Rushing Touchdown
0 – 14
Q2
8:19
8:19
Grant Glasgow 48 Yd Field Goal
Field Goal Good
0 – 17
Q2
1:04
1:04
Grant Glasgow 46 Yd Field Goal
Field Goal Good
0 – 20
Q3
7:05
7:05
James Laubstein 3 Yd Run (Scottre Humphrey Run for Two-Point Conversion)
Rushing Touchdown
0 – 28
Q3
4:03
4:03
Bailen George 11 Yd pass from Luke Moga (Grant Glasgow Kick)
Passing Touchdown
0 – 35
Q4
9:31
9:31
Grant Glasgow 49 Yd Field Goal
Field Goal Good
0 – 38
Q4
4:23
4:23
Nasir Williams 23 Yd Run (Caden VanHuis Kick)
Rushing Touchdown
7 – 38
Game Leaders
Central MichiganNew Mexico
 J. Glasser QB
Passing Yards
 L. Moga QB
 A. Flores QB
Rushing Yards
 S. Humphrey RB
 N. Williams WR
Receiving Yards
 B. George WR
 K. Demma DL
Sacks
 D. Agu DE
 D. Bryant Jr. DB
Tackles
 M. Swaim LB
Player Box Score
Central Michigan| Player | C/ATT | YDS | AVG | TD | INT |
|---|---|---|---|---|---|
| Jadyn Glasser#5 | 4/10 | 16 | 1.6 | 0 | 0 |
| Angel Flores#7 | 3/6 | 14 | 2.3 | 0 | 1 |
New Mexico| Player | C/ATT | YDS | AVG | TD | INT |
|---|---|---|---|---|---|
| Luke Moga#10 | 13/17 | 116 | 6.8 | 1 | 0 |
 Toa Fa'avae#13 | 4/8 | 43 | 5.4 | 0 | 0 |
Central Michigan| Player | CAR | YDS | AVG | TD | LONG |
|---|---|---|---|---|---|
| Angel Flores#7 | 10 | 27 | 2.7 | 0 | 11 |
 Vaughn Blue#24 | 3 | 25 | 8.3 | 0 | 16 |
| Nasir Williams#3 | 1 | 23 | 23.0 | 1 | 23 |
 Jayden Clerveaux#31 | 2 | 18 | 9.0 | 0 | 10 |
 Shawn Foster II#16 | 2 | 10 | 5.0 | 0 | 8 |
 Nick Woodford#43 | 2 | 8 | 4.0 | 0 | 5 |
 Langston Lewis#20 | 1 | 4 | 4.0 | 0 | 4 |
 Brock Townsend#2 | 2 | 4 | 2.0 | 0 | 3 |
 Justin Ruffin Jr.#9 | 1 | 2 | 2.0 | 0 | 2 |
| Jadyn Glasser#5 | 8 | -2 | -0.3 | 0 | 5 |
New Mexico| Player | CAR | YDS | AVG | TD | LONG |
|---|---|---|---|---|---|
| Scottre Humphrey#22 | 13 | 64 | 4.9 | 1 | 15 |
| Toa Fa'avae#13 | 7 | 45 | 6.4 | 0 | 16 |
 Kiefer Sibley#21 | 8 | 45 | 5.6 | 0 | 13 |
 Darrion Bowers#20 | 2 | 21 | 10.5 | 0 | 23 |
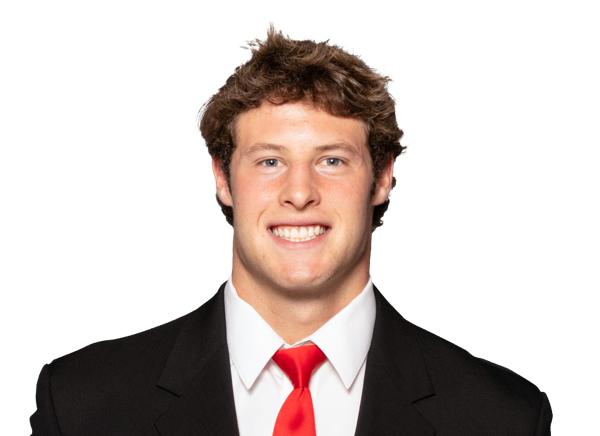 James Laubstein#12 | 6 | 18 | 3.0 | 2 | 6 |
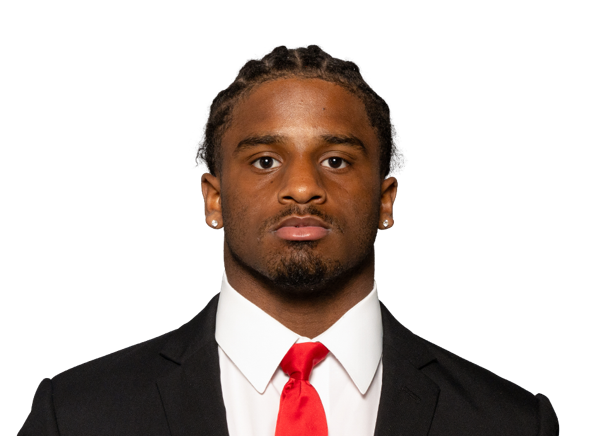 Cameron Mathews#23 | 5 | 13 | 2.6 | 0 | 6 |
| Luke Moga#10 | 3 | -1 | -0.3 | 0 | 3 |
Central Michigan| Player | REC | YDS | AVG | TD | LONG |
|---|---|---|---|---|---|
| Nasir Williams#3 | 1 | 11 | 11.0 | 0 | 11 |
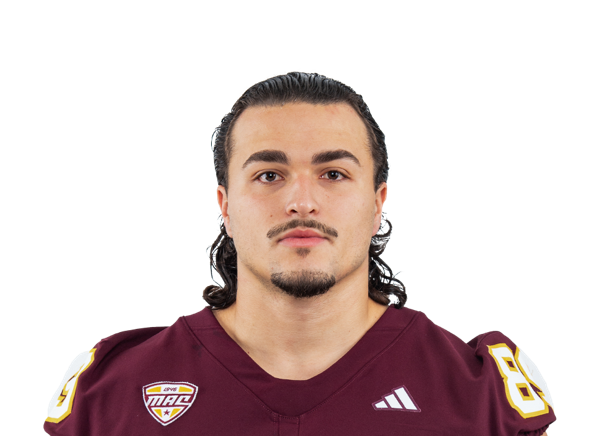 Jaden Allen#88 | 1 | 10 | 10.0 | 0 | 10 |
| Justin Ruffin Jr.#9 | 3 | 9 | 3.0 | 0 | 5 |
| Jayden Clerveaux#31 | 1 | 1 | 1.0 | 0 | 1 |
| Vaughn Blue#24 | 1 | -1 | -1.0 | 0 | 0 |
New Mexico| Player | REC | YDS | AVG | TD | LONG |
|---|---|---|---|---|---|
| Bailen George#81 | 4 | 36 | 9.0 | 1 | 11 |
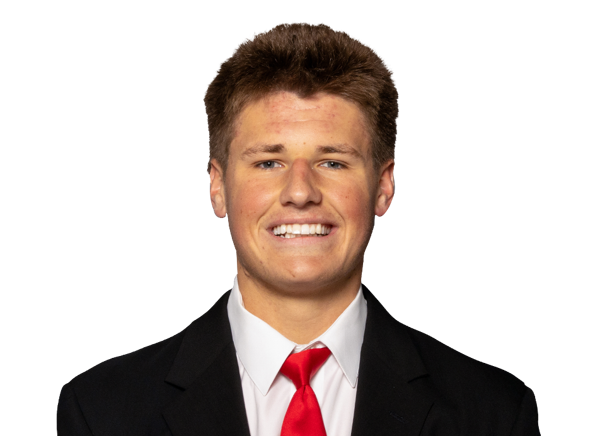 Cade Keith#88 | 3 | 28 | 9.3 | 0 | 17 |
 Massiah Mingo#11 | 2 | 26 | 13.0 | 0 | 21 |
 Troy Omeire#5 | 2 | 20 | 10.0 | 0 | 11 |
 Miles Williams | 1 | 19 | 19.0 | 0 | 19 |
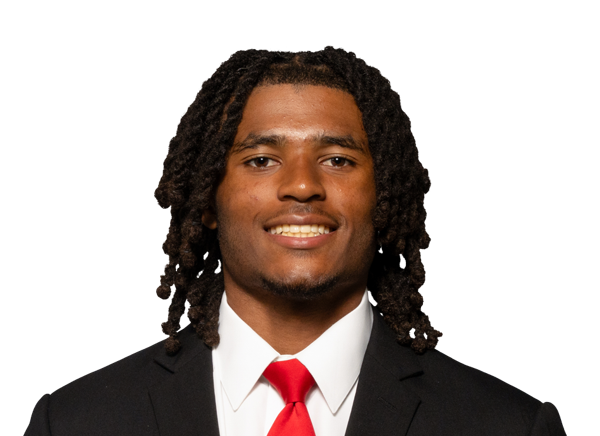 DJ Darling#14 | 1 | 9 | 9.0 | 0 | 9 |
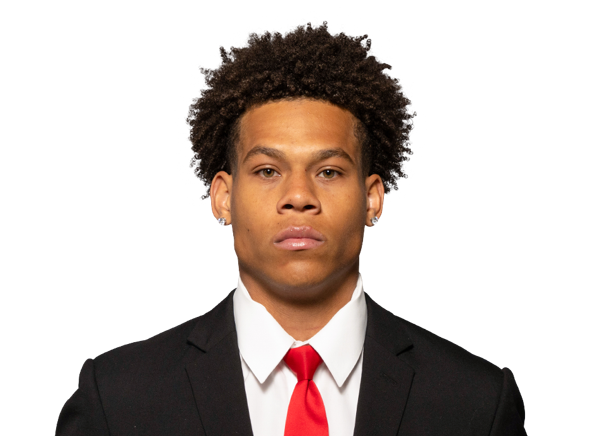 Zhaiel Smith#6 | 1 | 7 | 7.0 | 0 | 7 |
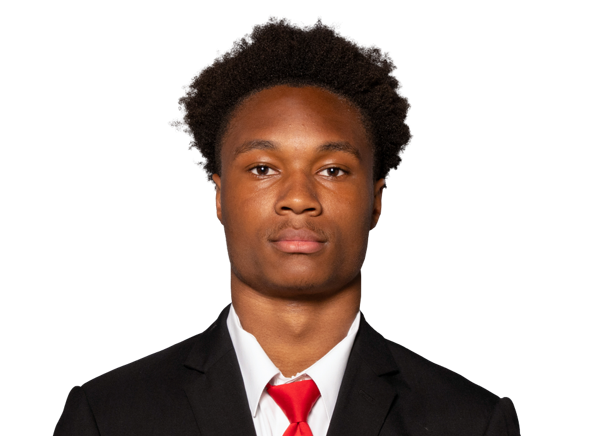 Dorian Patterson#25 | 1 | 6 | 6.0 | 0 | 6 |
 Tripp Walsh#7 | 1 | 5 | 5.0 | 0 | 5 |
| Kiefer Sibley#21 | 1 | 3 | 3.0 | 0 | 3 |
Central Michigan| Player | TOT | SOLO | SACKS | TFL | PD | QB HUR | TD |
|---|---|---|---|---|---|---|---|
| Darrell Bryant Jr.#19 | 9 | 6 | 0 | 0 | 0 | 0 | 0 |
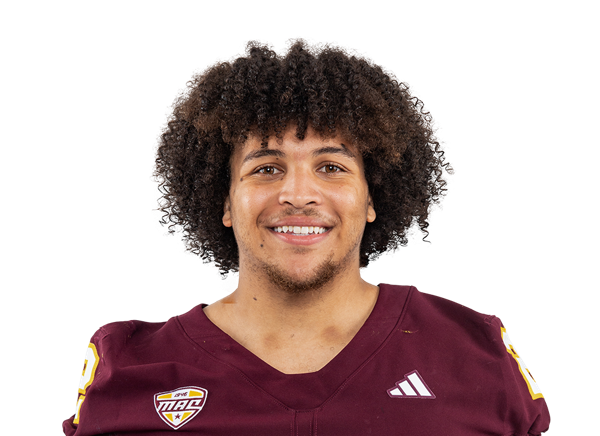 Xavier White#11 | 7 | 3 | 0 | 0 | 0 | 0 | 0 |
| Korver Demma#5 | 6 | 2 | 1 | 1 | 0 | 0 | 0 |
| Brett McCalla#40 | 5 | 3 | 0 | 0 | 0 | 0 | 0 |
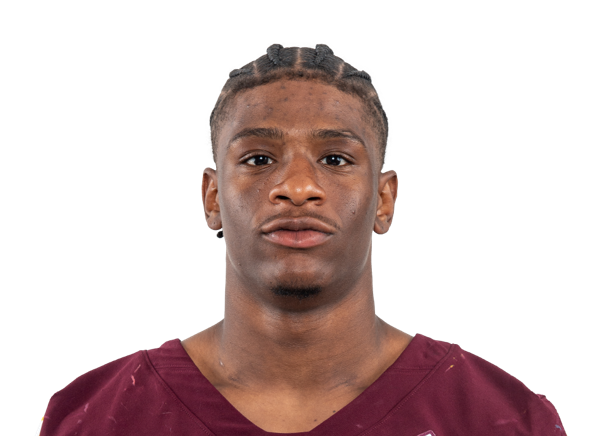 Jaion Jackson#4 | 5 | 2 | 0.5 | 0.5 | 1 | 0 | 0 |
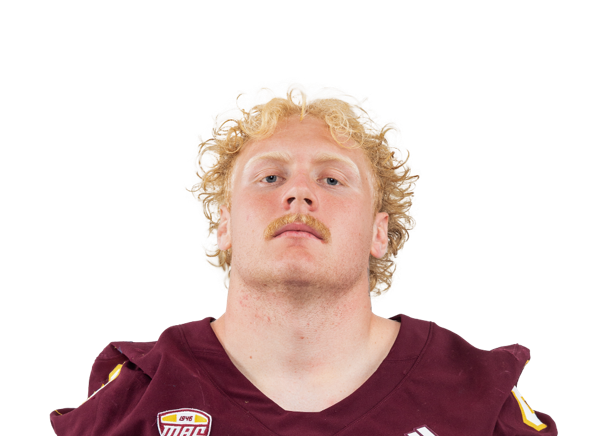 Mayson Hitchens#35 | 5 | 2 | 0 | 0 | 0 | 0 | 0 |
 Jeremiah Alston#10 | 5 | 1 | 0 | 0 | 0 | 0 | 0 |
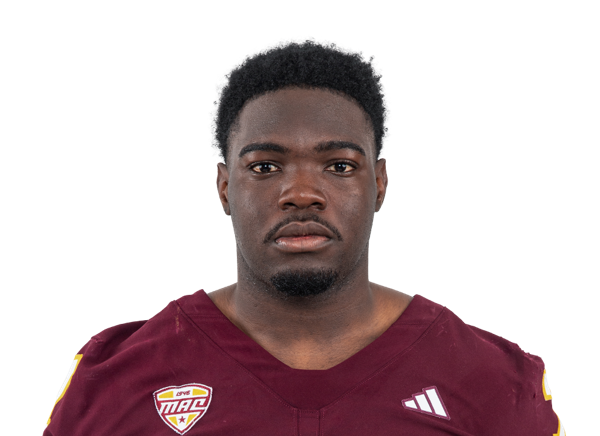 Donavan Philord#12 | 4 | 4 | 0 | 0 | 0 | 0 | 0 |
 Drew Esper#34 | 4 | 2 | 0 | 0 | 0 | 0 | 0 |
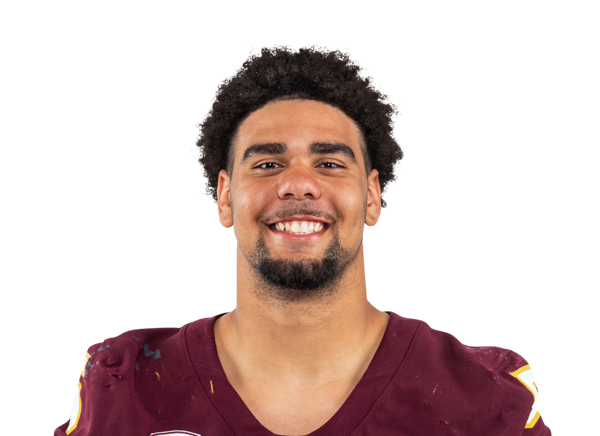 JJ Douglas#1 | 4 | 1 | 0 | 0 | 0 | 0 | 0 |
 Tysen Campbell#27 | 3 | 2 | 0 | 0 | 0 | 0 | 0 |
 James Reinbold#32 | 3 | 1 | 0 | 0 | 0 | 0 | 0 |
 Jaxon Cherry#92 | 3 | 1 | 0.5 | 0.5 | 0 | 0 | 0 |
 Kameran Hayward#43 | 2 | 2 | 0 | 0 | 0 | 0 | 0 |
 Nathan VanTimmeren#48 | 2 | 1 | 0 | 1 | 0 | 0 | 0 |
 Hunter Zirkle#6 | 1 | 1 | 0 | 0 | 0 | 0 | 0 |
 Coen Ali#17 | 1 | 1 | 0 | 0 | 0 | 0 | 0 |
 Ty Williams#24 | 1 | 1 | 0 | 0 | 0 | 0 | 0 |
 Antonio Cherry Jr.#30 | 1 | 1 | 0 | 0 | 0 | 0 | 0 |
 Max Van Fleet#97 | 1 | 0 | 0 | 0 | 0 | 0 | 0 |
 Justin Taylor#14 | 1 | 0 | 0 | 0 | 0 | 0 | 0 |
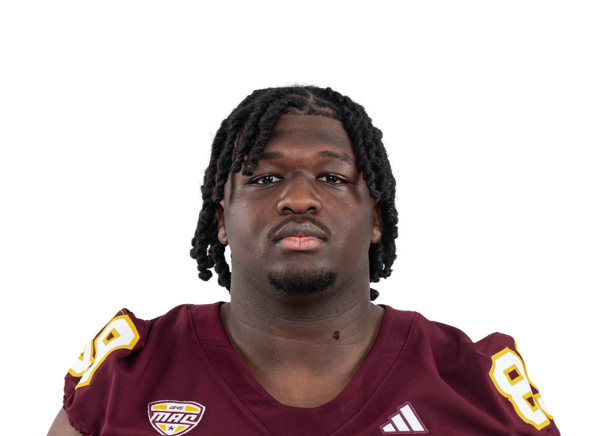 Quavion Bird#96 | 1 | 0 | 0 | 0 | 0 | 0 | 0 |
 Landon Swanson#42 | 1 | 0 | 0 | 0 | 0 | 0 | 0 |
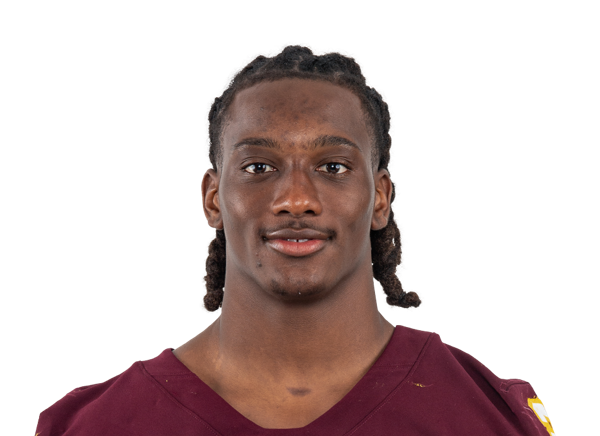 Matthew McKenzie#26 | 1 | 0 | 0 | 0 | 1 | 1 | 0 |
 Jajuan Jones#20 | 1 | 0 | 0 | 0 | 0 | 0 | 0 |
New Mexico| Player | TOT | SOLO | SACKS | TFL | PD | QB HUR | TD |
|---|---|---|---|---|---|---|---|
| Mercury Swaim#2 | 7 | 4 | 0 | 0 | 0 | 0 | 0 |
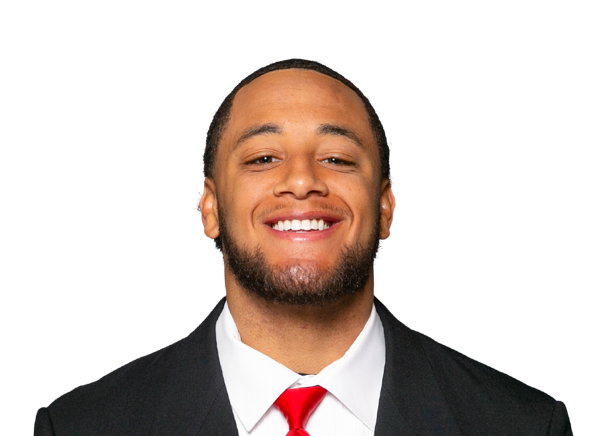 Drew Speech#12 | 5 | 2 | 1 | 1 | 0 | 0 | 0 |
 Jaxton Eck#6 | 5 | 1 | 0 | 0 | 0 | 1 | 0 |
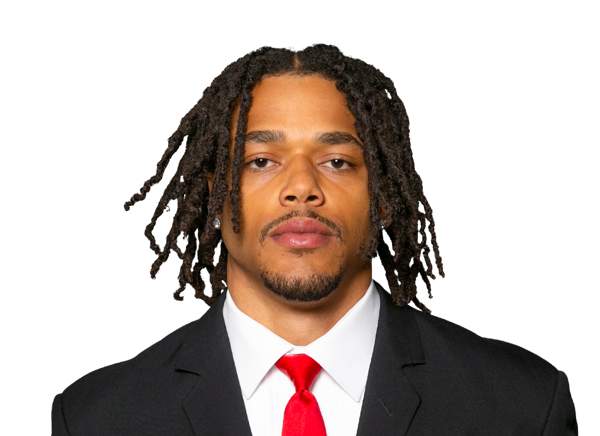 Tavian Combs#7 | 4 | 3 | 0 | 0 | 0 | 0 | 0 |
 Austin Brawley | 4 | 1 | 0 | 1 | 2 | 1 | 0 |
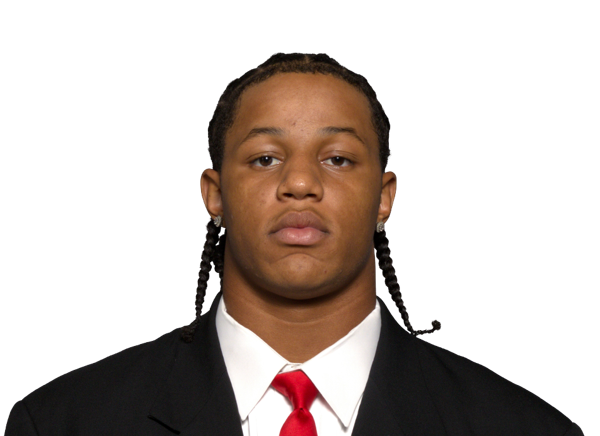 Elijah Brody#19 | 3 | 1 | 0 | 0 | 0 | 0 | 0 |
| Darren Agu#10 | 2 | 2 | 1 | 1 | 0 | 1 | 0 |
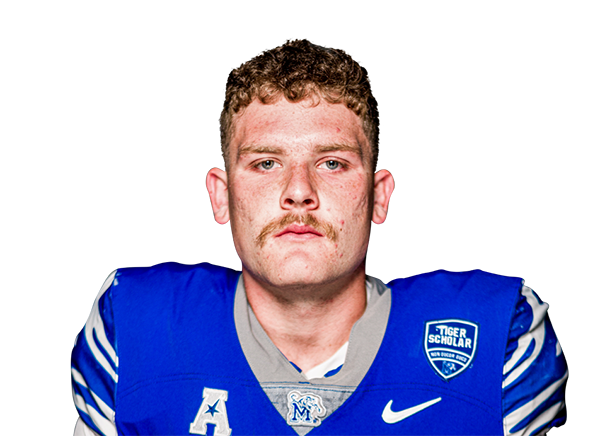 Brett Karhu | 2 | 1 | 1 | 1 | 0 | 0 | 0 |
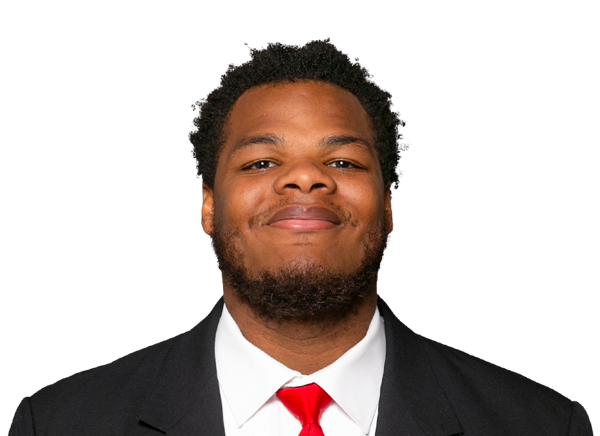 Brian Booker#92 | 2 | 1 | 0 | 0 | 1 | 0 | 0 |
 Clay Martineau#18 | 2 | 1 | 0 | 0 | 0 | 0 | 0 |
 Eric McClain#9 | 2 | 1 | 0 | 0 | 0 | 0 | 0 |
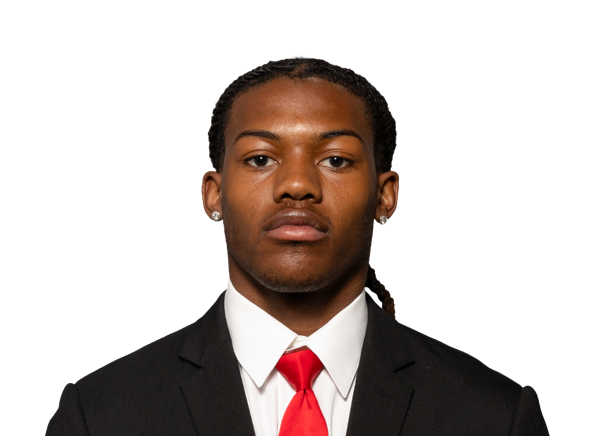 Jahmir Torres#1 | 2 | 1 | 0 | 0 | 0 | 0 | 0 |
 Frankie Edwards III#5 | 2 | 1 | 0 | 0 | 0 | 0 | 0 |
 Jalen Charles#22 | 2 | 0 | 0 | 0 | 0 | 0 | 0 |
 Xavier Slayton#15 | 1 | 1 | 0 | 0 | 0 | 0 | 0 |
 Jake DeVos#46 | 1 | 1 | 0 | 0 | 0 | 0 | 0 |
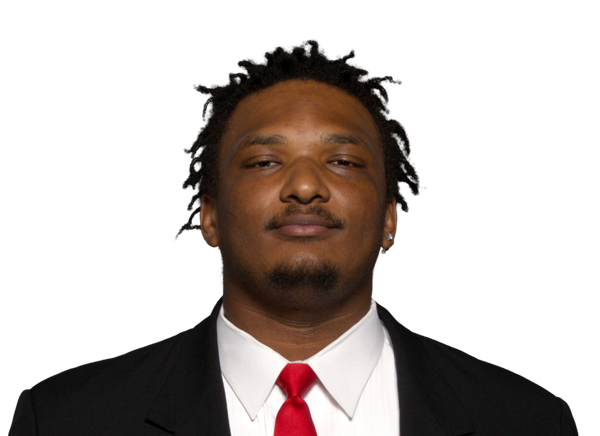 Jalen McIver#94 | 1 | 1 | 0 | 0 | 0 | 0 | 0 |
 Jayden Sheridan#4 | 1 | 0 | 0 | 0 | 0 | 0 | 0 |
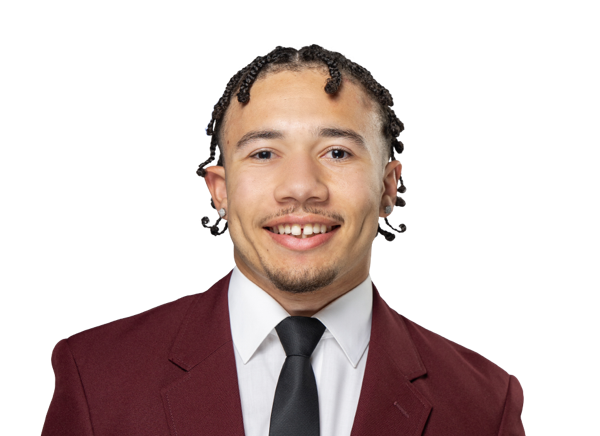 Kevin Longstreet#20 | 1 | 0 | 0 | 0 | 0 | 0 | 0 |
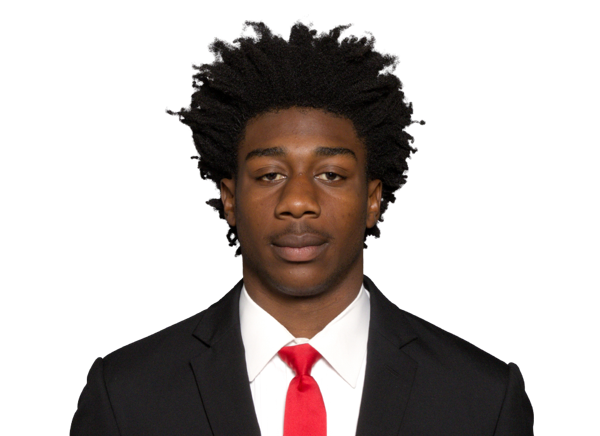 CJ McBean#3 | 1 | 0 | 0 | 0 | 0 | 0 | 0 |
 Nick Barber#98 | 1 | 0 | 0 | 0 | 0 | 0 | 0 |
 Ormanie Arnold#8 | 0 | 0 | 0 | 0 | 1 | 0 | 0 |
Central Michigan| Player | FUM | LOST | REC |
|---|---|---|---|
| Jadyn Glasser#5 | 1 | 1 | 0 |
New Mexico| Player | FUM | LOST | REC |
|---|---|---|---|
| Scottre Humphrey#22 | 1 | 0 | 0 |
| Jalen McIver#94 | 0 | 0 | 1 |
Central Michigan| Player | FG | PCT | LONG | XP | PTS |
|---|---|---|---|---|---|
 Caden VanHuis#38 | 0/0 | 0.0 | 0 | 1/1 | 1 |
New Mexico| Player | FG | PCT | LONG | XP | PTS |
|---|---|---|---|---|---|
 Grant Glasgow#31 | 3/4 | 75.0 | 49 | 3/3 | 12 |
Central Michigan| Player | NO | YDS | AVG | TB | In 20 | LONG |
|---|---|---|---|---|---|---|
 Declan Duley#18 | 6 | 306 | 51.0 | 1 | 1 | 62 |
New Mexico| Player | NO | YDS | AVG | TB | In 20 | LONG |
|---|---|---|---|---|---|---|
 Charles Steinkamp#35 | 2 | 81 | 40.5 | 1 | 0 | 44 |
New Mexico| Player | NO | YDS | AVG | LONG | TD |
|---|---|---|---|---|---|
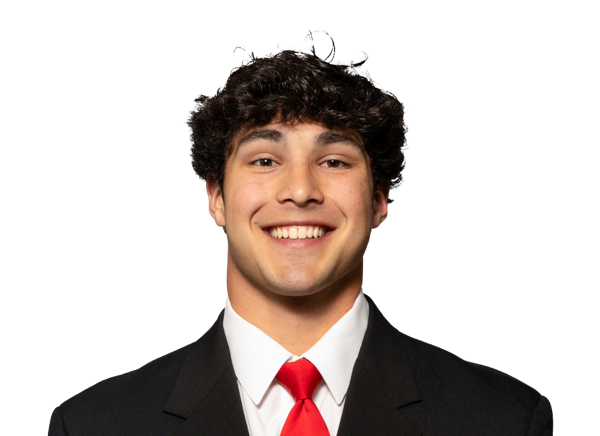 Marco Beltran Jr.#16 | 2 | 47 | 23.5 | 29 | 0 |
New Mexico| Player | INT | YDS | TD |
|---|---|---|---|
| Xavier Slayton#15 | 1 | 0 | 0 |
Drive Summary
UNM
Punt
6
CMU
Punt
-3
UNM
Touchdown
78
CMU
Punt
3
UNM
Touchdown
64
CMU
Punt
1
UNM
Field Goal
33
CMU
Punt
2
UNM
Field Goal
60
CMU
Interception
30
UNM
Field Goal
9
CMU
Punt
18
UNM
Touchdown
79
CMU
Punt
-3
UNM
Touchdown
39
CMU
Fumble
13
UNM
Field Goal
6
CMU
Touchdown
75
UNM
Punt
31
CMU
End of Half
8
Injury Report
No current injury report is available for this matchup.
Head-to-Head
Historical meetings are not available for this matchup.
Game Information
StageWeek 1
Season2026
KickoffSat, Sep 5, 10:00 pm
VenueUniversity Stadium (NM)
LocationAlbuquerque, NM
SurfaceArtificial Turf
BroadcastFS1
Attendance24,126
Division Standings
FBS — Mid-American Conference
| Team | W | L | T | Pct | PF | PA | Home | Away | Strk |
|---|---|---|---|---|---|---|---|---|---|
 Eastern Michigan | 4 | 6 | 0 | 0.400 | 199 | 266 | 2-3 | 2-3 | L3 |
 Buffalo | 6 | 3 | 0 | 0.667 | 215 | 234 | 4-1 | 2-2 | W4 |
 Massachusetts | 5 | 4 | 0 | 0.556 | 243 | 199 | 3-2 | 2-2 | W1 |
 Akron | 1 | 8 | 0 | 0.111 | 172 | 290 | 1-3 | 0-5 | L7 |
 Ball State | 3 | 6 | 0 | 0.333 | 206 | 313 | 2-1 | 1-5 | L1 |
 Bowling Green | 2 | 7 | 0 | 0.222 | 160 | 261 | 1-3 | 1-4 | L3 |
| Central Michigan | 4 | 5 | 0 | 0.444 | 178 | 214 | 3-2 | 1-3 | W1 |
 Kent State | 3 | 6 | 0 | 0.333 | 129 | 275 | 3-1 | 0-5 | L1 |
 Miami (OH) | 5 | 4 | 0 | 0.556 | 247 | 240 | 3-2 | 2-2 | L1 |
 Ohio | 7 | 2 | 0 | 0.778 | 265 | 195 | 4-0 | 3-2 | W6 |
 Toledo | 7 | 2 | 0 | 0.778 | 319 | 220 | 4-1 | 3-1 | W3 |
 Western Michigan | 6 | 3 | 0 | 0.667 | 236 | 173 | 3-1 | 3-2 | W1 |
 Sacramento State | 2 | 8 | 0 | 0.200 | 170 | 293 | 2-4 | 0-4 | L1 |
FBS — Mountain West Conference
| Team | W | L | T | Pct | PF | PA | Home | Away | Strk |
|---|---|---|---|---|---|---|---|---|---|
 UNLV | 5 | 4 | 0 | 0.556 | 235 | 231 | 3-2 | 2-2 | L1 |
 North Dakota State | 7 | 2 | 0 | 0.778 | 253 | 107 | 5-0 | 2-2 | W1 |
 Air Force | 7 | 2 | 0 | 0.778 | 258 | 193 | 4-1 | 3-1 | W2 |
| New Mexico | 8 | 1 | 0 | 0.889 | 311 | 98 | 4-0 | 4-1 | W6 |
 San José State | 5 | 5 | 0 | 0.500 | 209 | 220 | 2-3 | 3-2 | W1 |
 Nevada | 3 | 6 | 0 | 0.333 | 187 | 212 | 2-3 | 1-3 | L2 |
 Northern Illinois | 0 | 9 | 0 | 0.000 | 149 | 331 | 0-3 | 0-6 | L9 |
 UTEP | 1 | 8 | 0 | 0.111 | 127 | 309 | 1-4 | 0-4 | L7 |
 Wyoming | 6 | 3 | 0 | 0.667 | 197 | 195 | 4-0 | 2-3 | W4 |
 Hawai'i | 3 | 6 | 0 | 0.333 | 183 | 210 | 1-3 | 2-3 | W2 |
Central Michigan
10th in MAC
VS
New Mexico
1st in Mountain West
Quarterbacks & Specialists
#18
Declan Duley
#7
Angel Flores
#5
Jadyn Glasser
Receivers & Backs
#88
Jaden Allen
#24
Vaughn Blue
#31
Jayden Clerveaux
#16
Shawn Foster II
#20
Langston Lewis
#9
Justin Ruffin Jr.
#42
Landon Swanson
#2
Brock Townsend
#3
Nasir Williams
#43
Nick Woodford
Defensive Line & Linebackers
#10
Jeremiah Alston
#96
Quavion Bird
#92
Jaxon Cherry
#30
Antonio Cherry Jr.
#5
Korver Demma
#1
JJ Douglas
#34
Drew Esper
#35
Mayson Hitchens
#40
Brett McCalla
#32
James Reinbold
#97
Max Van Fleet
#48
Nathan VanTimmeren
#11
Xavier White
#6
Hunter Zirkle
Defensive Backs
#17
Coen Ali
#19
Darrell Bryant Jr.
#27
Tysen Campbell
#43
Kameran Hayward
#4
Jaion Jackson
#20
Jajuan Jones
#26
Matthew McKenzie
#12
Donavan Philord
#14
Justin Taylor
#24
Ty Williams
Other
#38
Caden VanHuis
Quarterbacks & Specialists
#13
Toa Fa'avae
#12
James Laubstein
#10
Luke Moga
#35
Charles Steinkamp
Receivers & Backs
#20
Darrion Bowers
#14
DJ Darling
#81
Bailen George
#22
Scottre Humphrey
#88
Cade Keith
#23
Cameron Mathews
#11
Massiah Mingo
#5
Troy Omeire
#25
Dorian Patterson
#21
Kiefer Sibley
#6
Zhaiel Smith
#7
Tripp Walsh
Miles Williams
Defensive Line & Linebackers
#10
Darren Agu
#98
Nick Barber
#92
Brian Booker
#19
Elijah Brody
#22
Jalen Charles
#46
Jake DeVos
#6
Jaxton Eck
#45
Brett Karhu
#18
Clay Martineau
#94
Jalen McIver
#15
Xavier Slayton
#2
Mercury Swaim
Defensive Backs
#8
Ormanie Arnold
#16
Marco Beltran Jr.
Austin Brawley
#7
Tavian Combs
#5
Frankie Edwards III
#20
Kevin Longstreet
#3
CJ McBean
#9
Eric McClain
#4
Jayden Sheridan
#12
Drew Speech
#1
Jahmir Torres
Other
#31
Grant Glasgow
Central Michigan
7th in MAC
VS
New Mexico
1st in Mountain West
Passing
59.2
Completion Percentage
60.4
116
Completions
99
2.60
Interception Percentage
4.30
5
Interceptions
7
71
Longest Pass
68
1,161
Net Passing Yards
1,345
129.0
Net Passing Yards Per Game
149.4
196
Passing Attempts
164
2.60
Passing Touchdown %
6.10
5
Passing Touchdowns
10
112.0
Passer Rating
140.8
20
Total Sacks
21
126
Sack Yards Lost
135
5.9
Yards Per Pass Attempt
8.2
1,161
Passing Yards
1,345
0
Passing Fumbles Lost
0
9
Team Games Played
9
305.6
Yards Per Game
362.6
19.8
Total Points Per Game
34.6
178
Total Points
311
24
Total Touchdowns
41
129.0
Passing Yards Per Game
149.4
116-196
Comp-Att
99-164
20-126
Sacks-Yards Lost
21-135
Rushing
357
Rushing Attempts
403
1,589
Rushing Yards
1,918
4.5
Yards Per Rush Attempt
4.8
55
Long Rushing
54
0
20+ Yard Rushing Plays
0
18
Rushing Touchdowns
28
176.6
Rushing Yards Per Game
213.1
0
Rushing Fumbles
0
0
Rushing Fumbles Lost
0
97
Rushing 1st downs
93
9
Team Games Played
9
2,750
Total Yards
3,263
573
Total Offensive Plays
588
19.8
Total Points Per Game
34.6
178
Total Points
311
24
Total Touchdowns
41
Receiving
116
Receptions
99
0
Receiving Targets
0
1,161
Receiving Yards
1,345
1,161
Receiving Yards
1,345
5
Receiving Touchdowns
10
71
Long Reception
68
0
20+ Yard Receiving Plays
0
129.0
Receiving Yards Per Game
149.4
0
Receiving Fumbles
0
0
Receiving Fumbles Lost
0
670
Receiving Yards After Catch
573
39
Receiving First Downs
58
9
Team Games Played
9
10.0
Yards Per Reception
13.6
19.8
Total Points Per Game
34.6
178
Total Points
311
24
Total Touchdowns
41
Miscellaneous
151
Total 1st downs
173
97
Rushing 1st downs
93
39
Passing 1st downs
58
13
1st downs by penalty
21
45
Third Down Conversions
47
122
Third Down Attempts
116
36.89
3rd down %
40.52
18
Fourth Down Conversions
12
26
First Downs Attempts
17
69.23
4th down %
70.59
55
Total Penalties
58
499
Total Penalty Yards
484
16126
Possession Time Seconds
18006
0.00
Red Zone Field Goal Percentage
0.00
0.00
Red Zone Scoring Percentage
0.00
0.00
Red Zone Efficiency Percentage
0.00
0.00
Red Zone Touchdown Percentage
0.00
10
Total Takeaways
17
11
Total Giveaways
8
-1
Turnover Ratio
9
0
Fumbles Lost
0
45-122
3rd down efficiency
47-116
18-26
4th down efficiency
12-17
55-499
Total-Yards
58-484
Defense
238
Solo Tackles
259
404
Assist Tackles
244
642
Total Tackles
503
15
Sacks
27
105
Sack Yards
204
56
Stuffs
99
29
Passes Defended
25
14.1
Average Interception Yards
15.2
46
Long Interception
65
0
Miscellaneous Touchdowns
0
1
Kicks Blocked
2
26
Tackles For Loss
64
9
Team Games Played
9
Defensive Interceptions
9
Interceptions
17
127
Interception Yards
258
1
Interception Touchdowns
2
9-127
INT: Total
17-258
General
8
Fumbles
6
6
Forced Fumbles
9
5
Fumbles Recovered
10
0
Fumbles Touchdowns
1
9
Games Played
9
8-0
Fumbles-Lost
6-0
Returning
8
Kick Returns
8
194
Kick Return Yards
180
24.3
Yards Per Kick Return
22.5
33
Long Kick Return
37
0
Kick Return Touchdowns
0
8
Punt Returns
21
45
Punt Return Yards
307
5.6
Yards Per Punt Return
14.6
11
Long Punt Return
44
0
Punt Return Touchdowns
0
0
Punt Return Fair Catches
0
0
Kick Return Fumbles Lost
0
0
Punt Return Fumbles Lost
0
9
Team Games Played
9
8-45
Punt: Total
21-307
Kicking
4
Field Goal Made
7
7
Field Goal Attempts
13
57.1
Field Goal Percentage
53.8
49
Long Field Goal Made
49
0
Field Goal Attempts 1-19
0
3
Field Goal Attempts 20-29
4
1
Field Goal Attempts 30-39
1
2
Field Goal Attempts 40-49
5
1
Field Goal Attempts 50+
3
22
Extra Points Made
40
24
Extra Point Attempts
40
91.7
Extra Point Percentage
100.0
0
Field Goals Made 1-19
0
2
Field Goals Made 20-29
2
1
Field Goals Made 30-39
1
1
Field Goals Made 40-49
4
0
Field Goals Made 50+
0
34
Total Kicking Points
61
9
Team Games Played
9
34
Touchback Percentage
75
0.0
Average Kickoff Return Yards
0.0
0
Kickoff Return Yards
0
0
Kickoff Returns
0
0-0
Kickoffs: Total
0-0
4-7
FG: Good-Attempts
7-13
Punting
38
Punts
35
1,655
Punt Yards
1,467
66
Long Punt
76
43.6
Gross Average Punt Yards
41.9
43.6
Net Average Punt Yards
41.9
0
Punts Blocked
0
13
Punts Inside 20
15
4
Touchbacks
3
10
Fair Catches
18
14
Punt Returns
10
0
Punt Return Yards
0
0.0
Average Punt Return Yards
0.0
9
Team Games Played
9
38-1,655
Punt: Total Yards
35-1,467
Scoring
18
Rushing Touchdowns
28
5
Receiving Touchdowns
10
0
Return Touchdowns
0
23
Total Touchdowns
39
4
Field Goals
7
22
Kick Extra Points
40
0
Total Two Point Conversions
1
178
Total Points
311
19.8
Total Points Per Game
34.6