

Charleston Southern vs Clemson Live Score (17 Oct, 2026)
Score by Quarter
| Team | Q1 | Q2 | Q3 | Q4 | Final |
|---|---|---|---|---|---|
 Charleston Southern | 0 | 0 | 0 | 0 | 0 |
 Clemson | 10 | 24 | 0 | 3 | 37 |
Scoring Plays
Q1
12:51
12:51
Nolan Hauser 41 Yd Field Goal
Field Goal Good
0 – 3
Q1
5:17
5:17
Chris Johnson Jr. 6 Yd Run (Nolan Hauser Kick)
Rushing Touchdown
0 – 10
Q2
13:30
13:30
Gideon Davidson 7 Yd Run (Nolan Hauser Kick)
Rushing Touchdown
0 – 17
Q2
5:30
5:30
Chris Johnson Jr. 2 Yd Run (Nolan Hauser Kick)
Rushing Touchdown
0 – 24
Q2
5:21
5:21
Kylon Griffin 17 Yd Fumble Return (Nolan Hauser Kick)
Kickoff Return (Offense)
0 – 31
Q2
0:47
0:47
Nolan Hauser 59 Yd Field Goal
Field Goal Good
0 – 34
Q4
14:43
14:43
Nolan Hauser 44 Yd Field Goal
Field Goal Good
0 – 37
Game Leaders
Charleston SouthernClemson
 J. Echols QB
Passing Yards
 T. Reynolds QB
 H. Watters RB
Rushing Yards
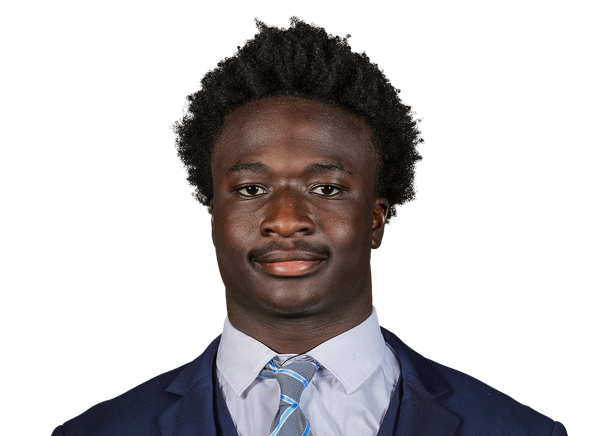 G. Davidson RB
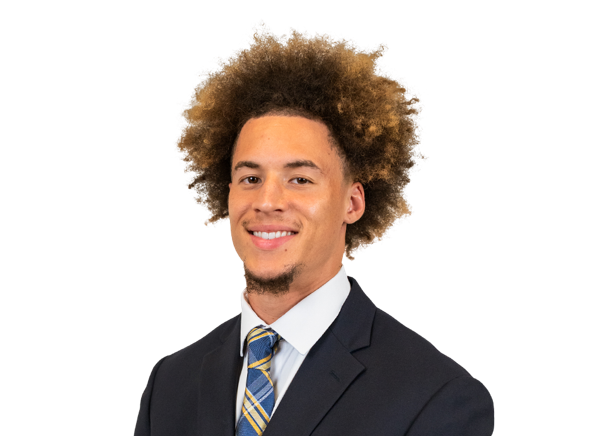 M. Warren WR
Receiving Yards
 C. Bentancur TE
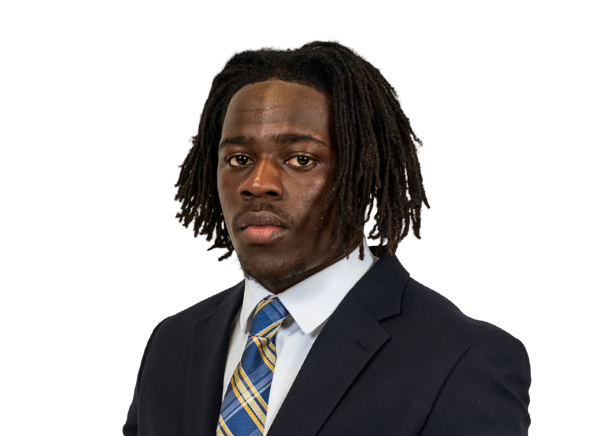 T. Snipe LB
Tackles
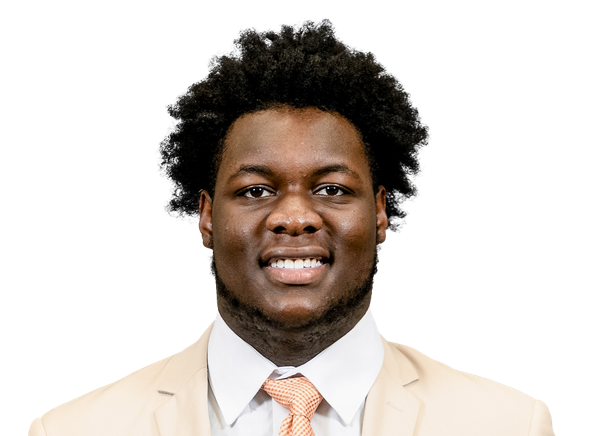 C. Story DL
—
Sacks
C. Story DLPlayer Box Score
Charleston Southern| Player | C/ATT | YDS | AVG | TD | INT | QBR |
|---|---|---|---|---|---|---|
| Jared Echols#7 | 7/12 | 50 | 4.2 | 0 | 0 | -- |
 Caden Clay#11 | 0/1 | 0 | 0.0 | 0 | 0 | -- |
Clemson| Player | C/ATT | YDS | AVG | TD | INT | QBR |
|---|---|---|---|---|---|---|
| Tait Reynolds#2 | 17/26 | 127 | 4.9 | 0 | 0 | 26.3 |
 Trent Pearman#14 | 8/13 | 80 | 6.2 | 0 | 2 | 4.9 |
 Brock Bradley#5 | 1/1 | 0 | 0.0 | 0 | 0 | -- |
Charleston Southern| Player | CAR | YDS | AVG | TD | LONG |
|---|---|---|---|---|---|
| Hakeem Watters | 13 | 46 | 3.5 | 0 | 18 |
 Dwayne Wright#17 | 6 | 12 | 2.0 | 0 | 9 |
 Harry Smalls#26 | 4 | 6 | 1.5 | 0 | 4 |
| Maxwell Warren#83 | 1 | -1 | -1.0 | 0 | 0 |
| Jared Echols#7 | 4 | -3 | -0.8 | 0 | 3 |
 Team | 1 | -13 | -13.0 | 0 | 0 |
| Caden Clay#11 | 3 | -21 | -7.0 | 0 | 0 |
Clemson| Player | CAR | YDS | AVG | TD | LONG |
|---|---|---|---|---|---|
| Gideon Davidson#8 | 13 | 59 | 4.5 | 1 | 11 |
 Max Wilson#34 | 7 | 52 | 7.4 | 0 | 26 |
| Tait Reynolds#2 | 7 | 40 | 5.7 | 0 | 10 |
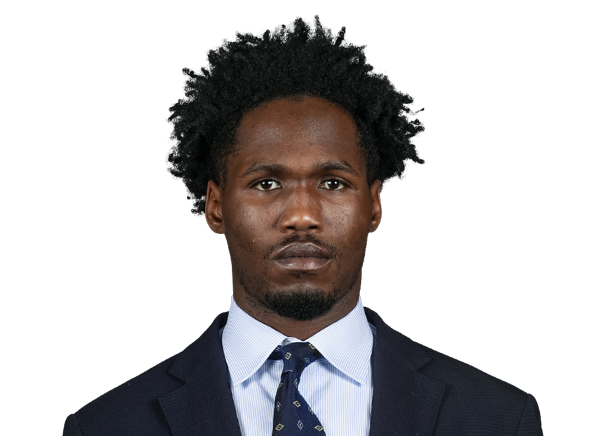 Chris Johnson Jr.#16 | 7 | 34 | 4.9 | 2 | 10 |
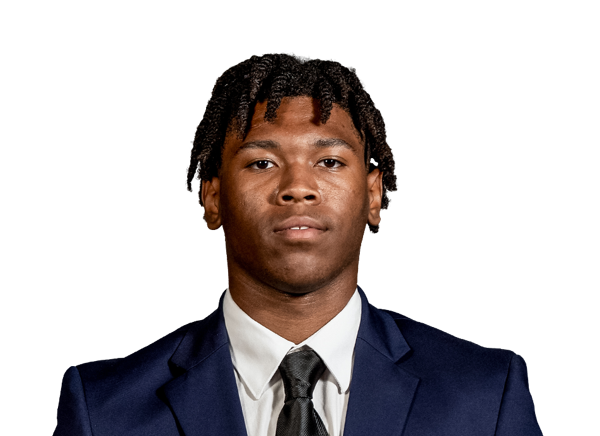 Jay Haynes#26 | 9 | 25 | 2.8 | 0 | 5 |
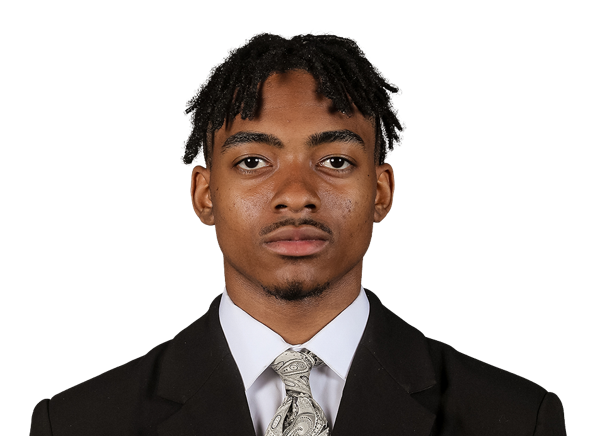 Juju Preston#10 | 1 | 11 | 11.0 | 0 | 11 |
 Naeem Burroughs | 1 | 6 | 6.0 | 0 | 6 |
 Tyler Brown#6 | 1 | 4 | 4.0 | 0 | 4 |
Charleston Southern| Player | REC | YDS | AVG | TD | LONG |
|---|---|---|---|---|---|
| Maxwell Warren#83 | 5 | 38 | 7.6 | 0 | 13 |
 Mekhi Campfield#3 | 1 | 9 | 9.0 | 0 | 9 |
 TJ Smith#10 | 1 | 3 | 3.0 | 0 | 3 |
Clemson| Player | REC | YDS | AVG | TD | LONG |
|---|---|---|---|---|---|
| Christian Bentancur#87 | 4 | 74 | 18.5 | 0 | 32 |
 Logan Brooking#7 | 2 | 26 | 13.0 | 0 | 23 |
 Bryant Wesco Jr.#12 | 4 | 25 | 6.3 | 0 | 10 |
| Naeem Burroughs | 2 | 19 | 9.5 | 0 | 12 |
 Olsen Patt-Henry#11 | 1 | 9 | 9.0 | 0 | 9 |
| Cam Blivens#83 | 1 | 9 | 9.0 | 0 | 9 |
 T.J. Moore#1 | 2 | 9 | 4.5 | 0 | 11 |
| Tyler Brown#6 | 2 | 8 | 4.0 | 0 | 6 |
| Chris Johnson Jr.#16 | 1 | 6 | 6.0 | 0 | 6 |
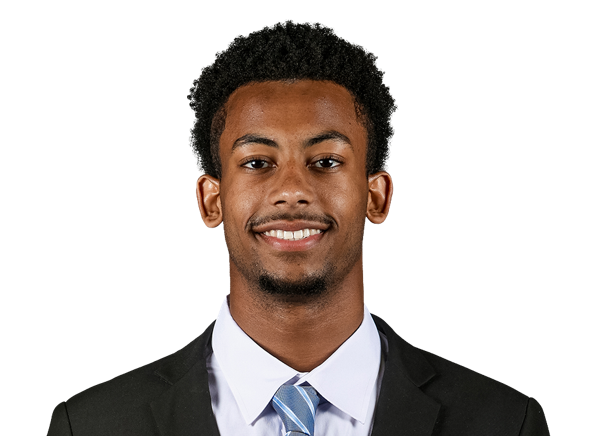 Gordon Sellars III#19 | 1 | 6 | 6.0 | 0 | 6 |
| Max Wilson#34 | 1 | 5 | 5.0 | 0 | 5 |
| Juju Preston#10 | 2 | 5 | 2.5 | 0 | 4 |
| Jay Haynes#26 | 1 | 3 | 3.0 | 0 | 3 |
 Tristan Smith#3 | 1 | 3 | 3.0 | 0 | 3 |
 Clark Sanderson#20 | 1 | 0 | 0.0 | 0 | 0 |
Charleston Southern| Player | TOT | SOLO | SACKS | TFL | PD | QB HUR | TD |
|---|---|---|---|---|---|---|---|
| Taivon Snipe#7 | 10 | 4 | 0 | 0 | 0 | 0 | 0 |
 Avery Dixon#6 | 7 | 7 | 0 | 1 | 0 | 0 | 0 |
 Steve Zayachkowsky#5 | 7 | 3 | 0 | 0.5 | 0 | 0 | 0 |
 Champ Brantley#1 | 6 | 4 | 0 | 0 | 0 | 0 | 0 |
 Mylan Bowen#10 | 5 | 3 | 0 | 0 | 1 | 0 | 0 |
 Josiah Wyatt | 5 | 2 | 0 | 1 | 0 | 1 | 0 |
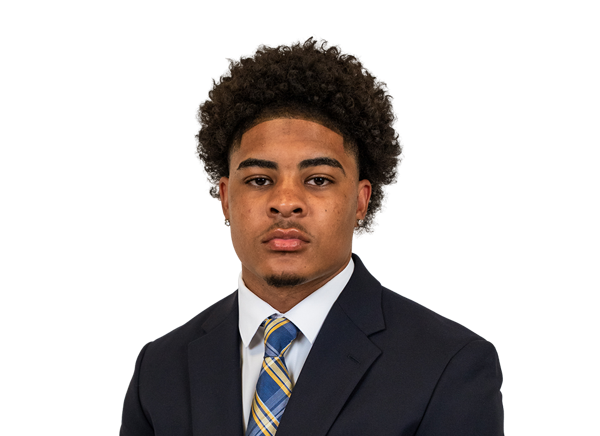 Angel Miles#24 | 4 | 3 | 0 | 0 | 0 | 0 | 0 |
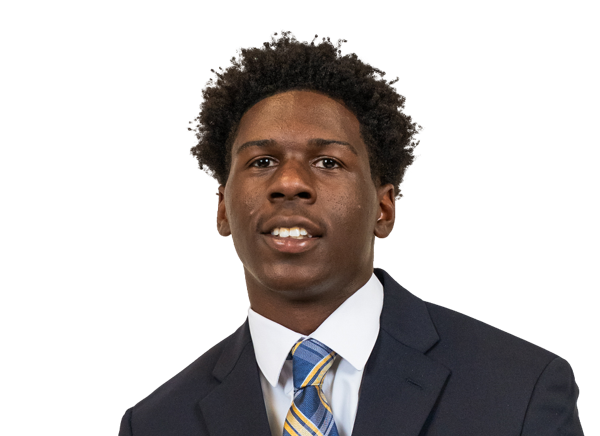 Jayden Hancock#4 | 4 | 3 | 0 | 0.5 | 0 | 0 | 0 |
 Jamie Williamson#57 | 4 | 1 | 0 | 0 | 0 | 0 | 0 |
 Jalen Brassell#39 | 4 | 0 | 0 | 0 | 0 | 0 | 0 |
 Kiemond Emilien#11 | 3 | 2 | 0 | 0 | 0 | 0 | 0 |
 Tristan Lennon#25 | 3 | 2 | 0 | 0 | 0 | 0 | 0 |
| Austin Brown#36 | 3 | 2 | 0 | 0 | 0 | 0 | 0 |
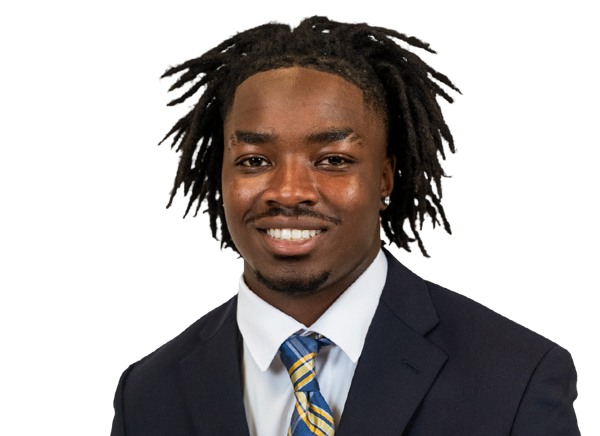 Kason Hooks#12 | 3 | 1 | 0 | 0 | 0 | 0 | 0 |
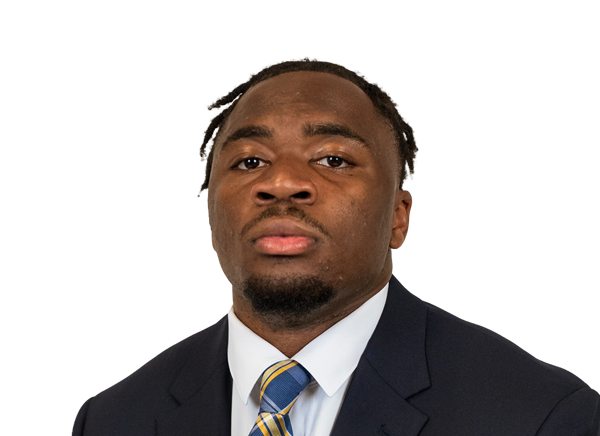 Shaun Hamilton#94 | 3 | 1 | 0 | 0 | 0 | 1 | 0 |
 Shannon Adkins#51 | 3 | 1 | 0 | 0 | 0 | 0 | 0 |
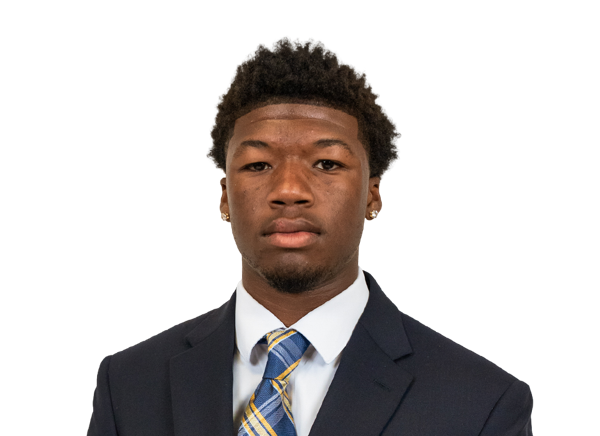 Brandon McDonald#33 | 2 | 2 | 0 | 0 | 1 | 0 | 0 |
 Chandler Perry#13 | 2 | 1 | 0 | 0 | 0 | 0 | 0 |
| Joshua Modupe#18 | 2 | 1 | 0 | 1 | 0 | 0 | 0 |
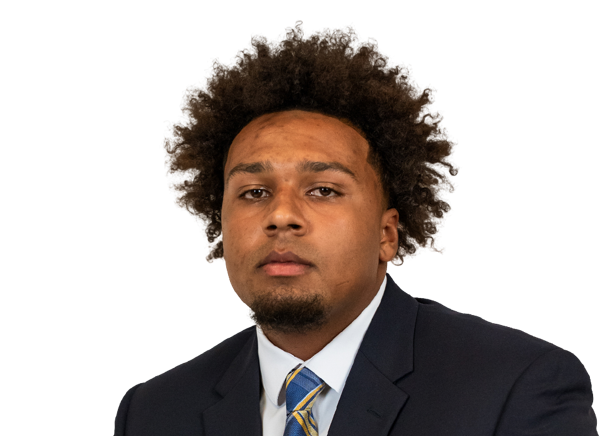 CJ Landrum#8 | 2 | 1 | 0 | 0 | 0 | 0 | 0 |
 Devontae Roberts#31 | 2 | 1 | 0 | 0 | 0 | 0 | 0 |
 Collin Bray#40 | 2 | 1 | 0 | 0 | 0 | 0 | 0 |
 Josias Addison#52 | 2 | 0 | 0 | 0 | 0 | 0 | 0 |
 Will Laing#98 | 1 | 1 | 0 | 0 | 0 | 0 | 0 |
 Anthony Carter#9 | 1 | 1 | 0 | 0 | 1 | 0 | 0 |
 Charles Atkins#95 | 1 | 1 | 0 | 0 | 0 | 0 | 0 |
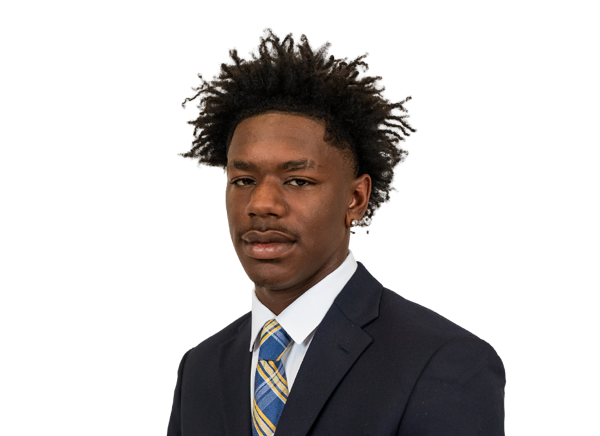 Damarcus O'Neal#32 | 1 | 1 | 0 | 0 | 0 | 1 | 0 |
 Jaiden Coleman#30 | 1 | 0 | 0 | 0 | 0 | 0 | 0 |
 GeTerius Brown#99 | 1 | 0 | 0 | 0 | 0 | 0 | 0 |
Clemson| Player | TOT | SOLO | SACKS | TFL | PD | QB HUR | TD |
|---|---|---|---|---|---|---|---|
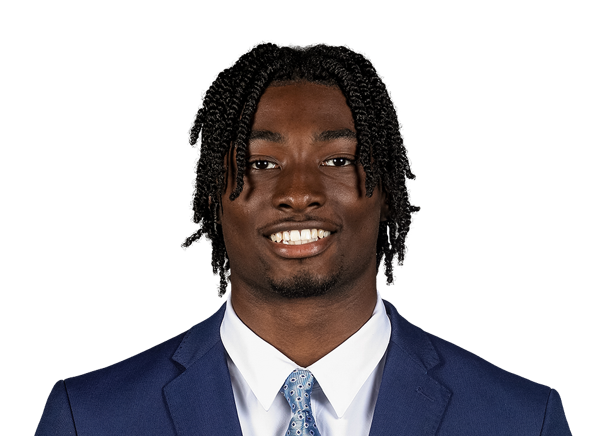 Ashton Hampton#2 | 4 | 3 | 0 | 1.5 | 0 | 0 | 0 |
| Caden Story#33 | 4 | 2 | 1.5 | 3 | 0 | 0 | 0 |
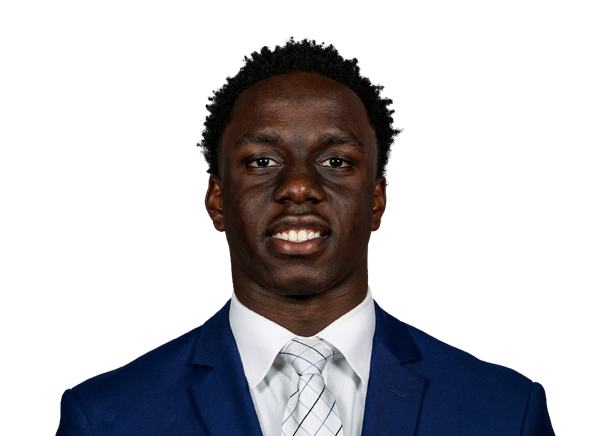 C.J. Kubah-Taylor#26 | 4 | 2 | 0.5 | 1 | 0 | 0 | 0 |
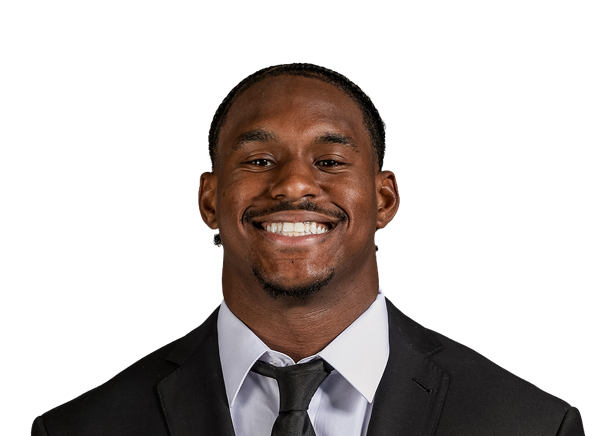 Jeremiah Alexander#7 | 3 | 3 | 0 | 0 | 0 | 0 | 0 |
 Ronan Hanafin#5 | 3 | 3 | 0 | 2 | 0 | 0 | 0 |
 Fletcher Cothran#50 | 3 | 2 | 0 | 0 | 0 | 0 | 0 |
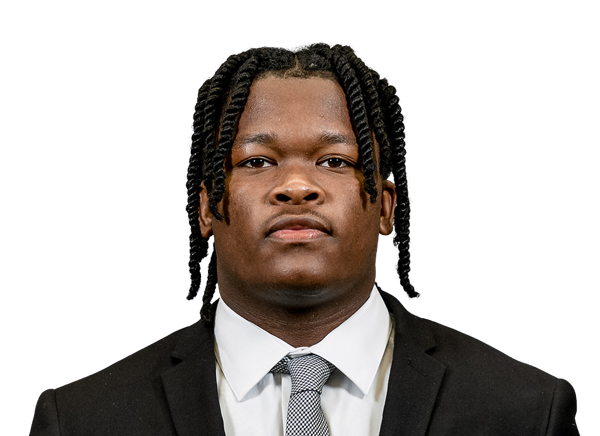 Kobe McCloud#21 | 3 | 1 | 0 | 0 | 0 | 0 | 0 |
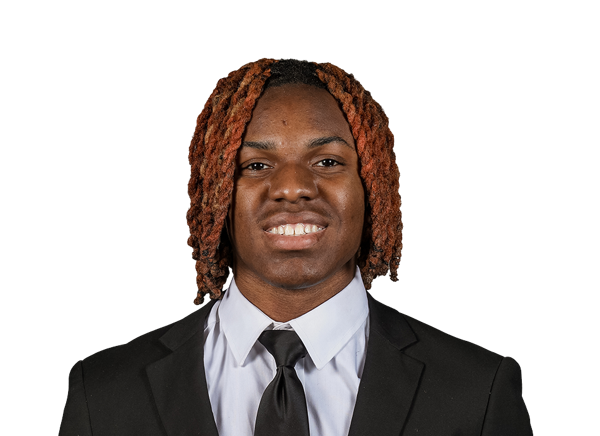 Jakarrion Kenan#20 | 3 | 1 | 0 | 0 | 0 | 0 | 0 |
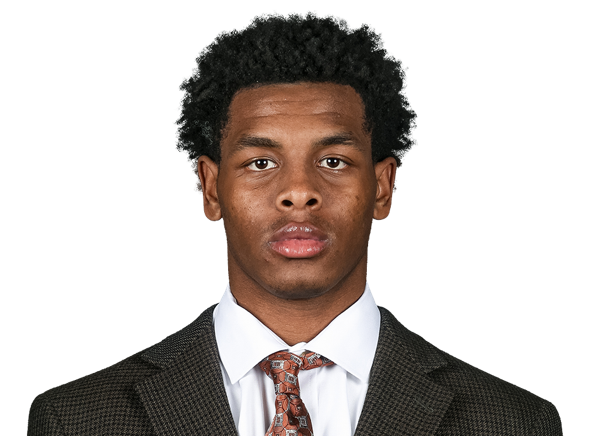 Jerome Carter III#6 | 2 | 2 | 0 | 0 | 0 | 0 | 0 |
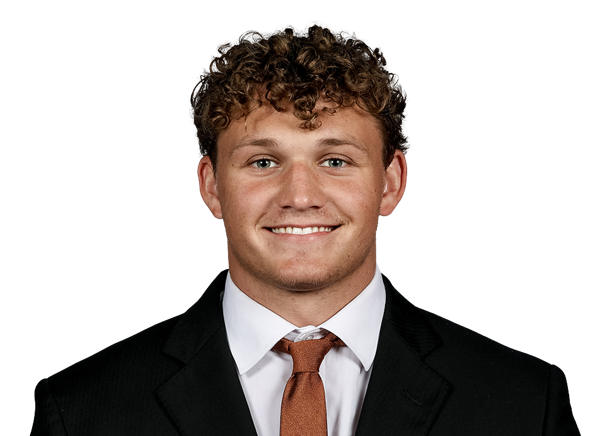 Logan Anderson#24 | 2 | 2 | 0 | 1 | 0 | 0 | 0 |
 Elliot Washington II#3 | 2 | 1 | 0 | 0 | 0 | 0 | 0 |
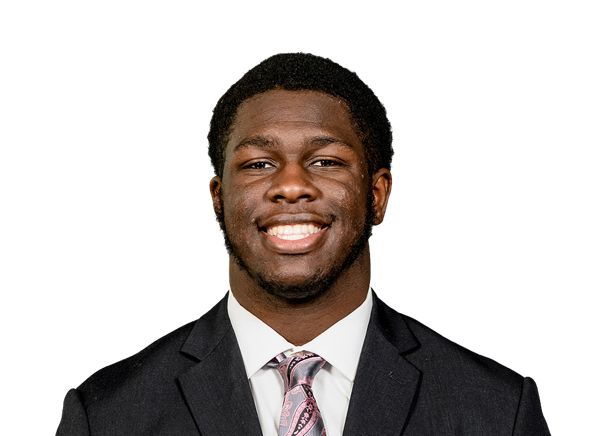 Vic Burley#45 | 1 | 1 | 1 | 1 | 0 | 0 | 0 |
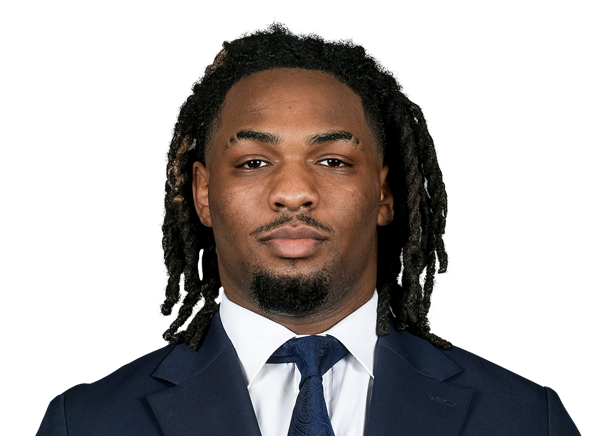 London Merritt#14 | 1 | 1 | 1 | 1 | 0 | 1 | 0 |
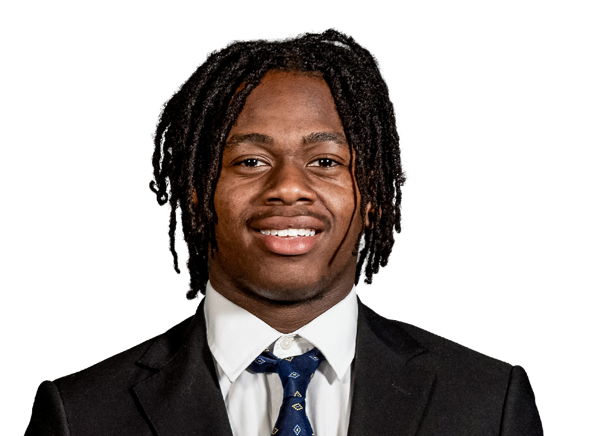 Branden Strozier#1 | 1 | 1 | 0 | 0 | 0 | 0 | 0 |
 Will Heldt#13 | 1 | 1 | 0 | 0 | 1 | 0 | 0 |
 Sammy Brown#47 | 1 | 1 | 0 | 0 | 0 | 0 | 0 |
 Robert Gunn III#38 | 1 | 1 | 0 | 0 | 0 | 0 | 0 |
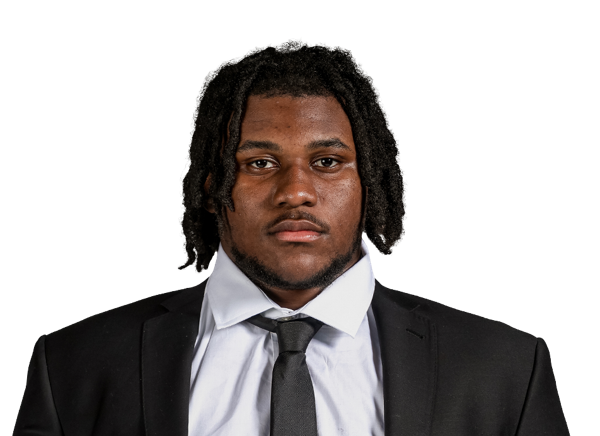 Amare Adams#95 | 1 | 1 | 0 | 1 | 0 | 0 | 0 |
 Donovan Starr | 1 | 1 | 0 | 0 | 1 | 0 | 0 |
 Marcell Gipson Jr.#25 | 1 | 1 | 0 | 1 | 0 | 0 | 0 |
| Max Wilson#34 | 1 | 1 | 0 | 0 | 0 | 0 | 0 |
 Connor McFadden#41 | 1 | 1 | 0 | 0 | 0 | 0 | 0 |
 Dietrick Pennington#91 | 1 | 0 | 0 | 0 | 0 | 0 | 0 |
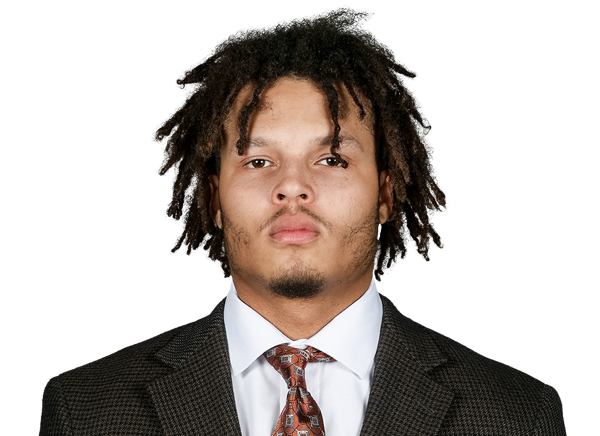 C.J. Wesley#23 | 1 | 0 | 0 | 0.5 | 0 | 0 | 0 |
 Drew Woodaz#9 | 1 | 0 | 0 | 0 | 0 | 0 | 0 |
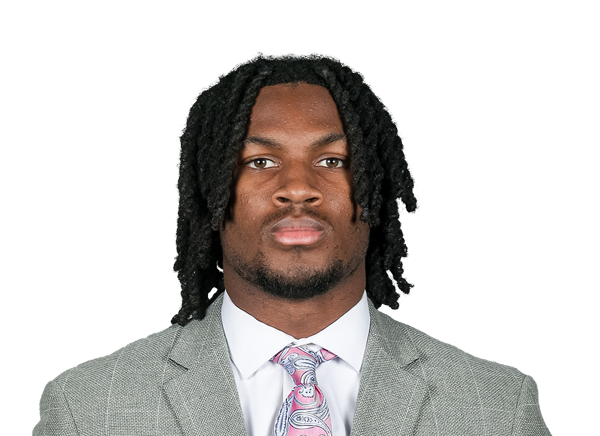 Corey Myrick#22 | 1 | 0 | 0 | 0 | 0 | 0 | 0 |
| Kam Cody#54 | 1 | 0 | 0 | 0 | 0 | 0 | 0 |
 Kourtney Kelly#44 | 1 | 0 | 0 | 0 | 0 | 0 | 0 |
 Brayden Reilly#19 | 1 | 0 | 0 | 0 | 0 | 0 | 0 |
 Kylon Griffin#18 | 0 | 0 | 0 | 0 | 0 | 0 | 1 |
 Ari Watford#17 | 0 | 0 | 0 | 0 | 0 | 1 | 0 |
Charleston Southern| Player | FUM | LOST | REC |
|---|---|---|---|
 Quay Kindell#8 | 1 | 1 | 0 |
| Team | 1 | 0 | 0 |
Clemson| Player | FUM | LOST | REC |
|---|---|---|---|
| Juju Preston#10 | 1 | 0 | 0 |
| Tait Reynolds#2 | 1 | 0 | 0 |
| Kylon Griffin#18 | 0 | 0 | 1 |
Charleston Southern| Player | FG | PCT | LONG | XP | PTS |
|---|---|---|---|---|---|
 Matt Rolader#47 | 0/1 | 0.0 | 0 | 0/0 | 0 |
Clemson| Player | FG | PCT | LONG | XP | PTS |
|---|---|---|---|---|---|
 Nolan Hauser#81 | 3/3 | 100.0 | 59 | 4/4 | 13 |
Charleston Southern| Player | NO | YDS | AVG | TB | In 20 | LONG |
|---|---|---|---|---|---|---|
 Baxter Pearce#37 | 7 | 296 | 42.3 | 0 | 0 | 48 |
Clemson| Player | NO | YDS | AVG | TB | In 20 | LONG |
|---|---|---|---|---|---|---|
 Jack Smith#89 | 1 | 37 | 37.0 | 0 | 1 | 37 |
Charleston Southern| Player | NO | YDS | AVG | LONG | TD |
|---|---|---|---|---|---|
| Quay Kindell#8 | 3 | 79 | 26.3 | 47 | 0 |
Clemson| Player | NO | YDS | AVG | LONG | TD |
|---|---|---|---|---|---|
| Chris Johnson Jr.#16 | 1 | 43 | 43.0 | 43 | 0 |
Clemson| Player | NO | YDS | AVG | LONG | TD |
|---|---|---|---|---|---|
| Bryant Wesco Jr.#12 | 1 | 25 | 25.0 | 25 | 0 |
| Juju Preston#10 | 3 | 23 | 7.7 | 14 | 0 |
Charleston Southern| Player | INT | YDS | TD |
|---|---|---|---|
| Mylan Bowen#10 | 1 | 45 | 0 |
| Kason Hooks#12 | 1 | 0 | 0 |
Drive Summary
CLEM
Field Goal
30
CHSO
Missed FG
43
CLEM
Touchdown
68
CHSO
Punt
12
CLEM
Touchdown
40
CHSO
Downs
21
CLEM
Touchdown
70
CLEM
Fumble
17
CHSO
Punt
3
CLEM
Field Goal
31
CHSO
End Of Half
6
CHSO
Punt
3
CLEM
Punt
31
CHSO
Punt
13
CLEM
Downs
53
CHSO
Punt
0
CLEM
Field Goal
6
CHSO
Punt
-3
CLEM
Interception
28
CHSO
Downs
-18
CLEM
Interception
34
CHSO
Punt
6
CLEM
Downs
44
CHSO
End of Half
2
Injury Report
No current injury report is available for this matchup.
Head-to-Head
Historical meetings are not available for this matchup.
Game Information
StageWeek 7
Season2026
KickoffSat, Oct 17, 12:00 pm
VenueMemorial Stadium (Clemson, SC)
LocationClemson, SC
SurfaceGrass
BroadcastACC Network
Attendance75,917
Division Standings
FCS — Ohio Valley Conference
| Team | W | L | T | Pct | PF | PA | Home | Away | Strk |
|---|---|---|---|---|---|---|---|---|---|
 Southeast Missouri State | 0 | 1 | 0 | 0.000 | 10 | 38 | 0-0 | 0-1 | L1 |
 UT Martin | 0 | 2 | 0 | 0.000 | 28 | 97 | 0-0 | 0-2 | L2 |
 Lindenwood | 0 | 2 | 0 | 0.000 | 17 | 77 | 0-0 | 0-2 | L2 |
 Western Illinois | 0 | 1 | 0 | 0.000 | 9 | 36 | 0-0 | 0-1 | L1 |
 Eastern Illinois | 0 | 1 | 0 | 0.000 | 7 | 59 | 0-0 | 0-1 | L1 |
 Gardner-Webb | 0 | 2 | 0 | 0.000 | 58 | 60 | 0-0 | 0-2 | L2 |
| Charleston Southern | 0 | 2 | 0 | 0.000 | 0 | 68 | 0-0 | 0-2 | L2 |
 Tennessee State | 0 | 1 | 0 | 0.000 | 3 | 63 | 0-0 | 0-1 | L1 |
FBS — Atlantic Coast Conference
| Team | W | L | T | Pct | PF | PA | Home | Away | Strk |
|---|---|---|---|---|---|---|---|---|---|
 Miami | 8 | 1 | 0 | 0.889 | 405 | 173 | 4-0 | 4-1 | L1 |
 SMU | 7 | 2 | 0 | 0.778 | 333 | 206 | 6-0 | 1-2 | W1 |
 Wake Forest | 8 | 1 | 0 | 0.889 | 390 | 143 | 4-1 | 4-0 | W6 |
| Clemson | 6 | 3 | 0 | 0.667 | 204 | 186 | 3-2 | 3-1 | W2 |
 North Carolina | 5 | 4 | 0 | 0.556 | 244 | 205 | 1-3 | 4-1 | W1 |
 California | 3 | 6 | 0 | 0.333 | 197 | 284 | 2-3 | 1-3 | L3 |
 Louisville | 6 | 3 | 0 | 0.667 | 367 | 233 | 4-1 | 2-2 | W4 |
 Pittsburgh | 6 | 3 | 0 | 0.667 | 287 | 178 | 5-1 | 1-2 | W1 |
 Virginia Tech | 6 | 3 | 0 | 0.667 | 308 | 215 | 3-1 | 3-2 | L1 |
 Virginia | 4 | 5 | 0 | 0.444 | 233 | 208 | 4-2 | 0-3 | L3 |
 Georgia Tech | 2 | 7 | 0 | 0.222 | 215 | 290 | 2-4 | 0-3 | L4 |
 Duke | 7 | 2 | 0 | 0.778 | 297 | 117 | 4-1 | 3-1 | W3 |
 Boston College | 4 | 5 | 0 | 0.444 | 197 | 243 | 3-2 | 1-3 | L2 |
 NC State | 4 | 5 | 0 | 0.444 | 260 | 248 | 4-2 | 0-3 | L1 |
 Florida State | 4 | 5 | 0 | 0.444 | 276 | 255 | 3-2 | 1-3 | W1 |
 Stanford | 4 | 5 | 0 | 0.444 | 183 | 336 | 4-1 | 0-4 | L1 |
 Syracuse | 4 | 5 | 0 | 0.444 | 264 | 229 | 2-3 | 2-2 | L1 |
Charleston Southern
VS
Clemson
6th in ACC
Quarterbacks & Specialists
#11
Caden Clay
#7
Jared Echols
#37
Baxter Pearce
Receivers & Backs
#3
Mekhi Campfield
#8
Quay Kindell
#26
Harry Smalls
#10
TJ Smith
#83
Maxwell Warren
Hakeem Watters
#17
Dwayne Wright
Defensive Line & Linebackers
#52
Josias Addison
#51
Shannon Adkins
#95
Charles Atkins
#10
Mylan Bowen
#40
Collin Bray
#99
GeTerius Brown
#30
Jaiden Coleman
#94
Shaun Hamilton
#8
CJ Landrum
#25
Tristan Lennon
#24
Angel Miles
#18
Joshua Modupe
#7
Taivon Snipe
#57
Jamie Williamson
Josiah Wyatt
#5
Steve Zayachkowsky
Defensive Backs
#1
Champ Brantley
#39
Jalen Brassell
#36
Austin Brown
#9
Anthony Carter
#6
Avery Dixon
#11
Kiemond Emilien
#4
Jayden Hancock
#12
Kason Hooks
#33
Brandon McDonald
#32
Damarcus O'Neal
#13
Chandler Perry
#31
Devontae Roberts
Other
#98
Will Laing
#47
Matt Rolader
Quarterbacks & Specialists
#5
Brock Bradley
#14
Trent Pearman
#2
Tait Reynolds
#89
Jack Smith
Offensive Line
#91
Dietrick Pennington
Receivers & Backs
#87
Christian Bentancur
#83
Cam Blivens
#7
Logan Brooking
#6
Tyler Brown
Naeem Burroughs
#8
Gideon Davidson
#26
Jay Haynes
#16
Chris Johnson Jr.
#1
T.J. Moore
#11
Olsen Patt-Henry
#10
Juju Preston
#20
Clark Sanderson
#19
Gordon Sellars III
#3
Tristan Smith
#12
Bryant Wesco Jr.
#34
Max Wilson
Defensive Line & Linebackers
#95
Amare Adams
#7
Jeremiah Alexander
#24
Logan Anderson
#47
Sammy Brown
#45
Vic Burley
#54
Kam Cody
#50
Fletcher Cothran
#13
Will Heldt
#44
Kourtney Kelly
#26
C.J. Kubah-Taylor
#21
Kobe McCloud
#41
Connor McFadden
#14
London Merritt
#19
Brayden Reilly
#33
Caden Story
#17
Ari Watford
#23
C.J. Wesley
#9
Drew Woodaz
Defensive Backs
#6
Jerome Carter III
#25
Marcell Gipson Jr.
#18
Kylon Griffin
#2
Ashton Hampton
#5
Ronan Hanafin
#20
Jakarrion Kenan
#22
Corey Myrick
Donovan Starr
#1
Branden Strozier
#3
Elliot Washington II
Other
#38
Robert Gunn III
#81
Nolan Hauser
Charleston Southern
7th in OVC
VS
Clemson
5th in ACC
Passing
52.1
Completion Percentage
63.9
126
Completions
179
1.70
Interception Percentage
2.90
4
Interceptions
8
40
Longest Pass
55
1,402
Net Passing Yards
1,664
140.2
Net Passing Yards Per Game
184.9
242
Passing Attempts
280
2.90
Passing Touchdown %
1.40
7
Passing Touchdowns
4
107.0
Passer Rating
112.4
34
Total Sacks
28
235
Sack Yards Lost
152
5.8
Yards Per Pass Attempt
5.9
1,402
Passing Yards
1,664
0
Passing Fumbles Lost
0
10
Team Games Played
9
251.0
Yards Per Game
338.0
23.2
Total Points Per Game
22.7
232
Total Points
204
30
Total Touchdowns
18
140.2
Passing Yards Per Game
184.9
126-242
Comp-Att
179-280
34-235
Sacks-Yards Lost
28-152
Rushing
318
Rushing Attempts
340
1,108
Rushing Yards
1,378
3.5
Yards Per Rush Attempt
4.1
66
Long Rushing
79
0
20+ Yard Rushing Plays
0
15
Rushing Touchdowns
11
110.8
Rushing Yards Per Game
153.1
0
Rushing Fumbles
0
0
Rushing Fumbles Lost
0
55
Rushing 1st downs
80
10
Team Games Played
9
2,510
Total Yards
3,042
594
Total Offensive Plays
648
23.2
Total Points Per Game
22.7
232
Total Points
204
30
Total Touchdowns
18
Receiving
126
Receptions
179
0
Receiving Targets
0
1,402
Receiving Yards
1,664
1,402
Receiving Yards
1,664
7
Receiving Touchdowns
4
40
Long Reception
55
0
20+ Yard Receiving Plays
0
140.2
Receiving Yards Per Game
184.9
0
Receiving Fumbles
0
0
Receiving Fumbles Lost
0
52
Receiving Yards After Catch
944
67
Receiving First Downs
73
10
Team Games Played
9
11.1
Yards Per Reception
9.3
23.2
Total Points Per Game
22.7
232
Total Points
204
30
Total Touchdowns
18
Miscellaneous
142
Total 1st downs
173
55
Rushing 1st downs
80
69
Passing 1st downs
73
17
1st downs by penalty
20
31
Third Down Conversions
40
122
Third Down Attempts
134
25.41
3rd down %
29.85
5
Fourth Down Conversions
10
14
First Downs Attempts
16
35.71
4th down %
62.50
69
Total Penalties
62
620
Total Penalty Yards
574
16708
Possession Time Seconds
16130
0.00
Red Zone Field Goal Percentage
0.00
0.00
Red Zone Scoring Percentage
0.00
0.00
Red Zone Efficiency Percentage
0.00
0.00
Red Zone Touchdown Percentage
0.00
13
Total Takeaways
14
12
Total Giveaways
13
1
Turnover Ratio
1
0
Fumbles Lost
0
31-122
3rd down efficiency
40-134
5-14
4th down efficiency
10-16
69-620
Total-Yards
62-574
Defense
339
Solo Tackles
305
420
Assist Tackles
280
759
Total Tackles
585
14
Sacks
27
85
Sack Yards
182
86
Stuffs
75
35
Passes Defended
40
25.8
Average Interception Yards
4.4
65
Long Interception
26
0
Miscellaneous Touchdowns
0
3
Kicks Blocked
0
49
Tackles For Loss
45
10
Team Games Played
9
Defensive Interceptions
11
Interceptions
8
284
Interception Yards
35
4
Interception Touchdowns
0
11-284
INT: Total
8-35
General
16
Fumbles
9
10
Forced Fumbles
6
9
Fumbles Recovered
6
1
Fumbles Touchdowns
2
10
Games Played
9
16-0
Fumbles-Lost
9-0
Returning
18
Kick Returns
17
458
Kick Return Yards
406
25.4
Yards Per Kick Return
23.9
98
Long Kick Return
43
2
Kick Return Touchdowns
0
18
Punt Returns
18
163
Punt Return Yards
212
9.1
Yards Per Punt Return
11.8
60
Long Punt Return
65
1
Punt Return Touchdowns
1
0
Punt Return Fair Catches
0
0
Kick Return Fumbles Lost
0
0
Punt Return Fumbles Lost
0
10
Team Games Played
9
18-163
Punt: Total
18-212
Kicking
7
Field Goal Made
27
10
Field Goal Attempts
29
70.0
Field Goal Percentage
93.1
52
Long Field Goal Made
59
0
Field Goal Attempts 1-19
0
1
Field Goal Attempts 20-29
4
2
Field Goal Attempts 30-39
10
4
Field Goal Attempts 40-49
10
3
Field Goal Attempts 50+
5
29
Extra Points Made
15
29
Extra Point Attempts
15
100.0
Extra Point Percentage
100.0
0
Field Goals Made 1-19
0
1
Field Goals Made 20-29
4
1
Field Goals Made 30-39
10
3
Field Goals Made 40-49
9
2
Field Goals Made 50+
4
50
Total Kicking Points
96
10
Team Games Played
9
40
Touchback Percentage
68
0.0
Average Kickoff Return Yards
0.0
0
Kickoff Return Yards
0
0
Kickoff Returns
0
0-0
Kickoffs: Total
0-0
7-10
FG: Good-Attempts
27-29
Punting
57
Punts
44
2,320
Punt Yards
1,760
59
Long Punt
63
40.7
Gross Average Punt Yards
40.0
40.7
Net Average Punt Yards
40.0
0
Punts Blocked
0
14
Punts Inside 20
17
2
Touchbacks
2
19
Fair Catches
20
18
Punt Returns
8
0
Punt Return Yards
0
0.0
Average Punt Return Yards
0.0
10
Team Games Played
9
57-2,320
Punt: Total Yards
44-1,760
Scoring
15
Rushing Touchdowns
11
7
Receiving Touchdowns
4
3
Return Touchdowns
1
26
Total Touchdowns
18
7
Field Goals
27
29
Kick Extra Points
15
0
Total Two Point Conversions
0
232
Total Points
204
23.2
Total Points Per Game
22.7