

Charlotte vs App State Live Score (20 Sep, 2026)
Score by Quarter
| Team | Q1 | Q2 | Q3 | Q4 | Final |
|---|---|---|---|---|---|
 Charlotte |
0 | 7 | 0 | 14 | 21 |
 App State |
3 | 10 | 6 | 7 | 26 |
Scoring Plays
Q1
9:50
9:50
J. London 41 yd FG GOOD
Field Goal Good
0 – 3
Q2
4:34
4:34
J. Lewis run for 2 yds, for a TD (J. London KICK)
Rushing Touchdown
0 – 10
Q2
0:35
0:35
K. Alexander run for 1 yd, for a TD (I. Kelly KICK)
Rushing Touchdown
7 – 10
Q2
0:02
0:02
J. London 47 yd FG GOOD
Field Goal Good
7 – 13
Q3
4:28
4:28
M. Singleton pass to C. Lofton for 3 yds, for a TD (Two-Point Conversion failed)
Pass Reception
7 – 19
Q4
12:08
12:08
M. Singleton pass to J. Grier for 7 yds, for a TD (J. London KICK)
Passing Touchdown
7 – 26
Q4
7:00
7:00
K. Alexander run for 1 yd, for a TD (K. Alexander Run For Two-point Conversion)
Rushing Touchdown
15 – 26
Q4
2:05
2:05
M. Singleton pass intercepted, for a TD, C. Gill return for 36 yds
Pass Interception Return
21 – 26
Game Leaders
CharlotteApp State
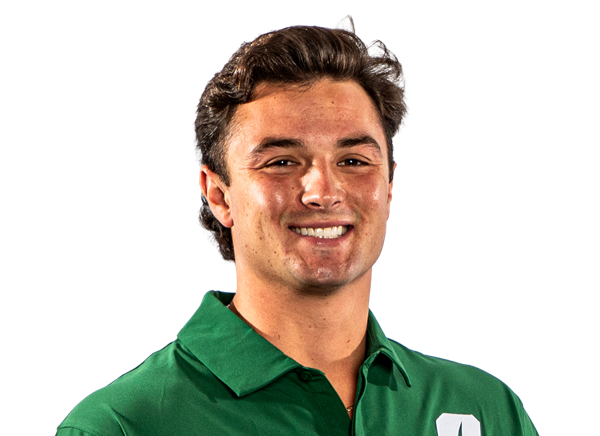 C. Gonzales QB
Passing Yards
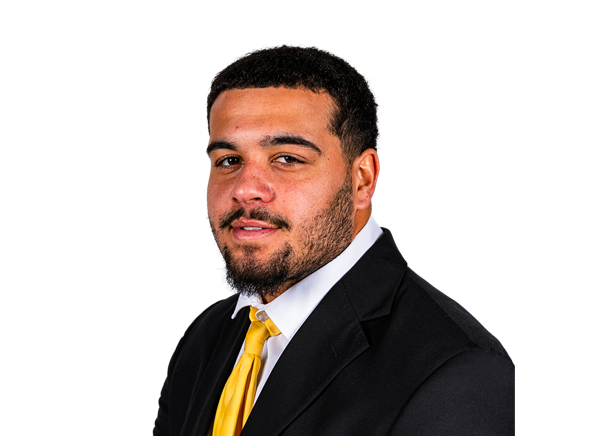 M. Singleton QB
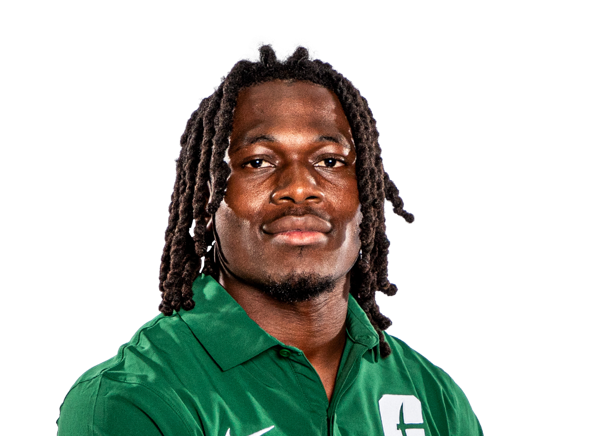 H. Rutledge RB
Rushing Yards
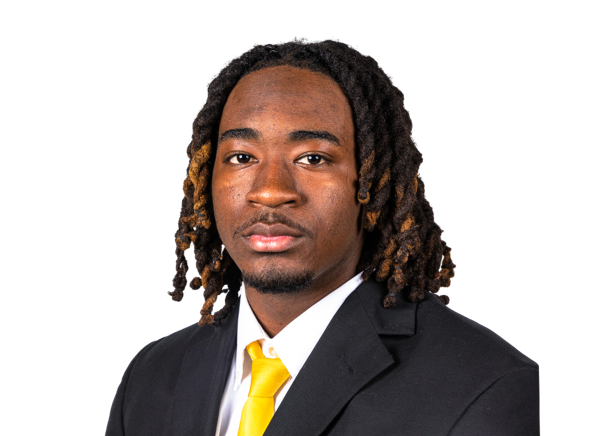 J. Lewis RB
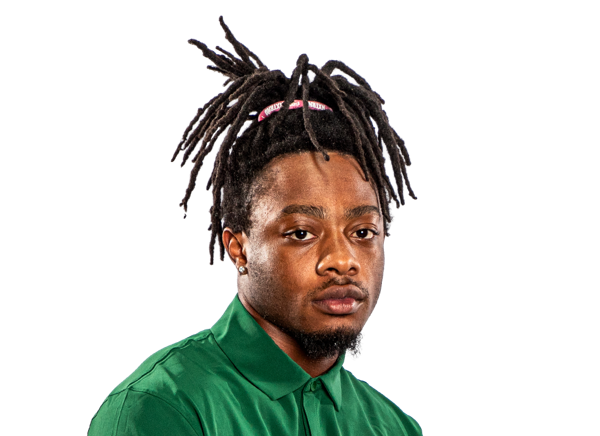 J. Barnes WR
Receiving Yards
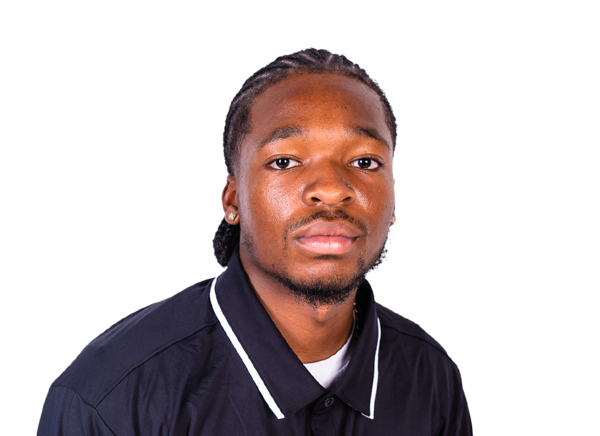 C. Lofton WR
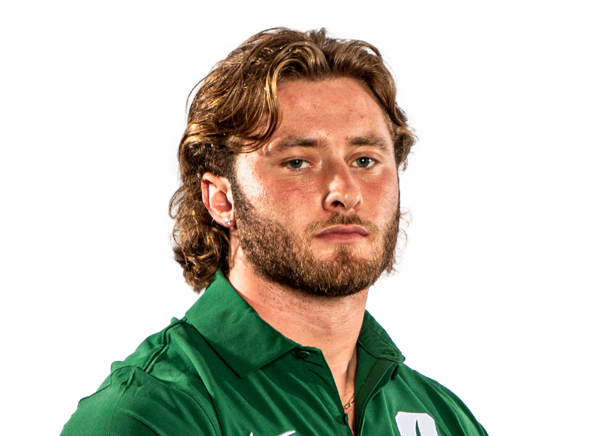 K. Schmitz LB
Tackles
 D. Henderson DB
—
Sacks
 C. Sandstrom DL
Player Box Score
Charlotte| Player | C/ATT | YDS | AVG | TD | INT |
|---|---|---|---|---|---|
| Cole Gonzales#9 | 22/35 | 211 | 6.0 | 0 | 2 |
App State| Player | C/ATT | YDS | AVG | TD | INT |
|---|---|---|---|---|---|
| Malachi Singleton#3 | 28/42 | 331 | 7.9 | 2 | 1 |
 Henry Hasselbeck#8 | 1/1 | 14 | 14.0 | 0 | 0 |
Charlotte| Player | CAR | YDS | AVG | TD | LONG |
|---|---|---|---|---|---|
| Henry Rutledge#21 | 7 | 29 | 4.1 | 0 | 12 |
 Khamani Alexander#5 | 13 | 18 | 1.4 | 2 | 7 |
| Cole Gonzales#9 | 3 | 5 | 1.7 | 0 | 3 |
| Jaden Barnes#1 | 1 | -6 | -6.0 | 0 | 0 |
 Team | 1 | -10 | -10.0 | 0 | -10 |
App State| Player | CAR | YDS | AVG | TD | LONG |
|---|---|---|---|---|---|
| Jaquari Lewis#5 | 11 | 46 | 4.2 | 1 | 13 |
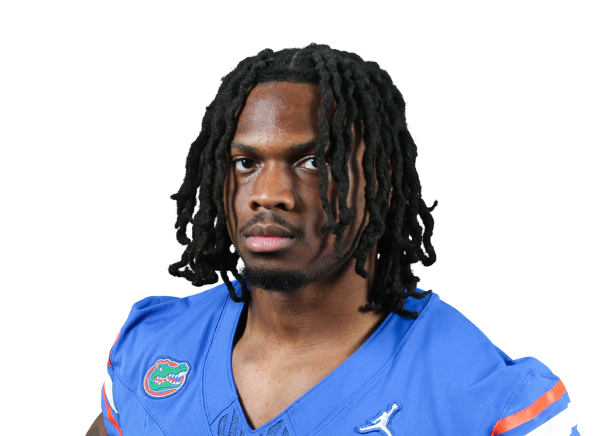 Treyaun Webb#4 | 8 | 24 | 3.0 | 0 | 18 |
| Malachi Singleton#3 | 5 | 14 | 2.8 | 0 | 7 |
 Ja'Quez Cross#11 | 2 | 7 | 3.5 | 0 | 4 |
| Henry Hasselbeck#8 | 2 | 7 | 3.5 | 0 | 4 |
 Daz James#83 | 1 | 4 | 4.0 | 0 | 4 |
| Team | 3 | -6 | -2.0 | 0 | -1 |
| Nate Branch#1 | 1 | -6 | -6.0 | 0 | 0 |
Charlotte| Player | REC | YDS | AVG | TD | LONG |
|---|---|---|---|---|---|
| Jaden Barnes#1 | 10 | 97 | 9.7 | 0 | 17 |
 Jaylen Hampton#2 | 4 | 50 | 12.5 | 0 | 33 |
 Derrick Eley#89 | 2 | 26 | 13.0 | 0 | 18 |
 Logan Mauldin#3 | 2 | 22 | 11.0 | 0 | 16 |
| Khamani Alexander#5 | 2 | 14 | 7.0 | 0 | 7 |
 Jason Jeffares#85 | 2 | 2 | 1.0 | 0 | 1 |
App State| Player | REC | YDS | AVG | TD | LONG |
|---|---|---|---|---|---|
| Chris Lofton#6 | 6 | 90 | 15.0 | 1 | 29 |
 Sam Pickett III | 6 | 67 | 11.2 | 0 | 21 |
 Alexander Sanchez#16 | 4 | 56 | 14.0 | 0 | 28 |
| Jamel Howse#19 | 2 | 50 | 25.0 | 0 | 36 |
 Jackson Grier#13 | 2 | 23 | 11.5 | 1 | 16 |
 Darrin Fugitt#7 | 1 | 16 | 16.0 | 0 | 16 |
| Nate Branch#1 | 4 | 16 | 4.0 | 0 | 12 |
| Malachi Singleton#3 | 1 | 14 | 14.0 | 0 | 14 |
| Daz James#83 | 1 | 9 | 9.0 | 0 | 9 |
| Ja'Quez Cross#11 | 1 | 3 | 3.0 | 0 | 3 |
| Jaquari Lewis#5 | 1 | 1 | 1.0 | 0 | 1 |
Charlotte| Player | TOT | SOLO | SACKS | TFL | PD | QB HUR | TD |
|---|---|---|---|---|---|---|---|
| Kadin Schmitz#19 | 9 | 5 | 0 | 0.5 | 0 | 0 | 0 |
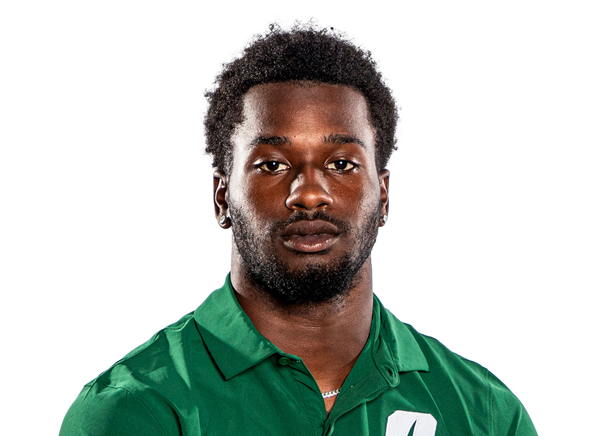 Collin Gill | 7 | 5 | 0 | 0 | 2 | 0 | 1 |
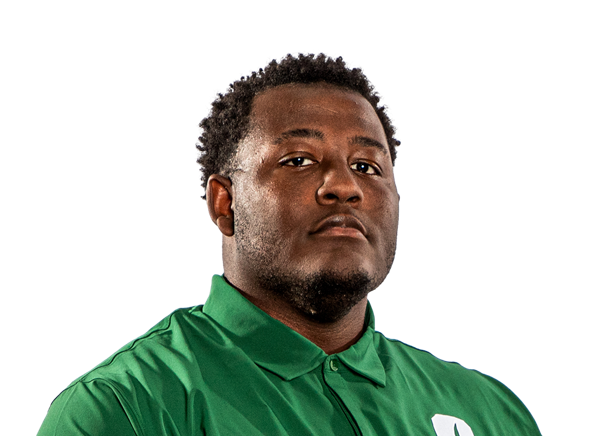 Devin Ancrum#95 | 5 | 4 | 0 | 0 | 0 | 0 | 0 |
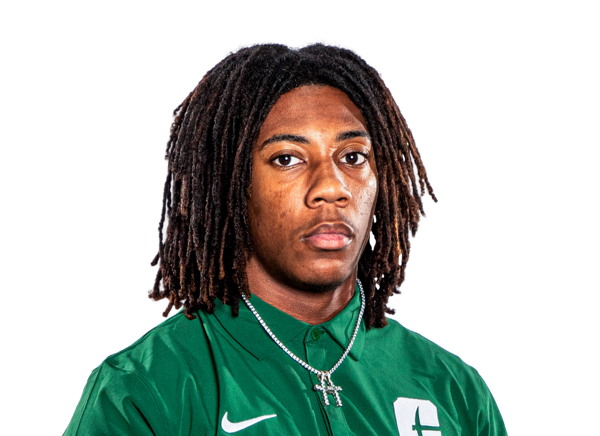 Dy'Lon Womack#3 | 5 | 3 | 0 | 0 | 1 | 0 | 0 |
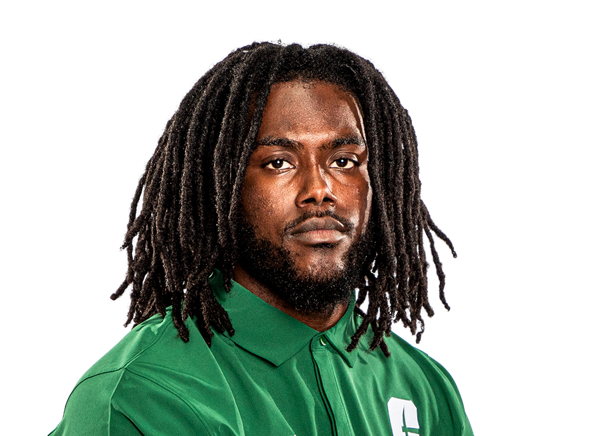 Curtis Simpson#9 | 4 | 3 | 0 | 0.5 | 0 | 1 | 0 |
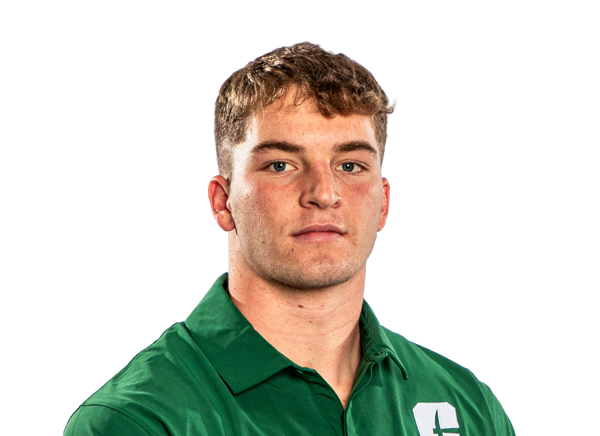 Gavin Willis#13 | 4 | 3 | 0 | 0 | 0 | 0 | 0 |
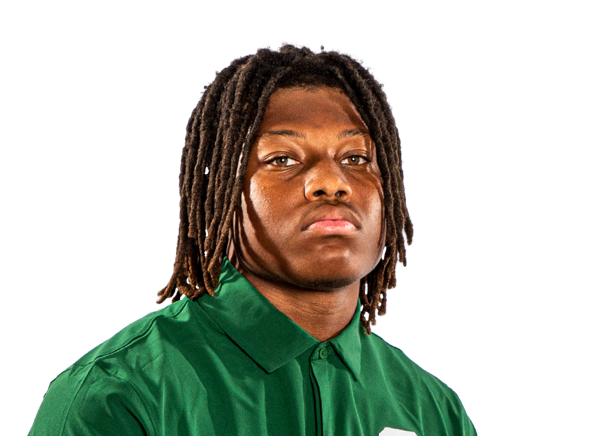 Chase Usher#18 | 4 | 3 | 0 | 0 | 1 | 0 | 0 |
 Jameel Croft Jr.#1 | 3 | 3 | 0 | 0 | 0 | 0 | 0 |
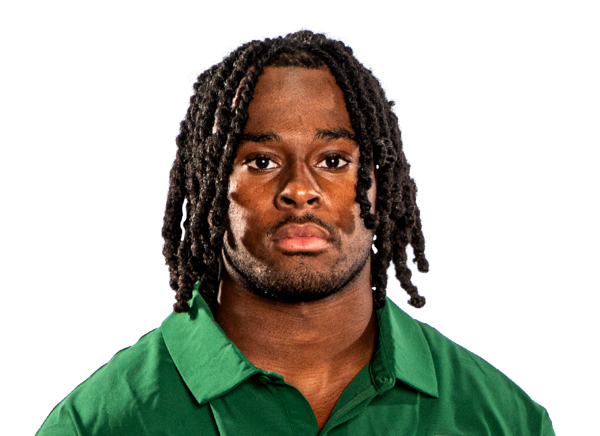 Cornell Allen#28 | 3 | 3 | 0 | 0 | 0 | 0 | 0 |
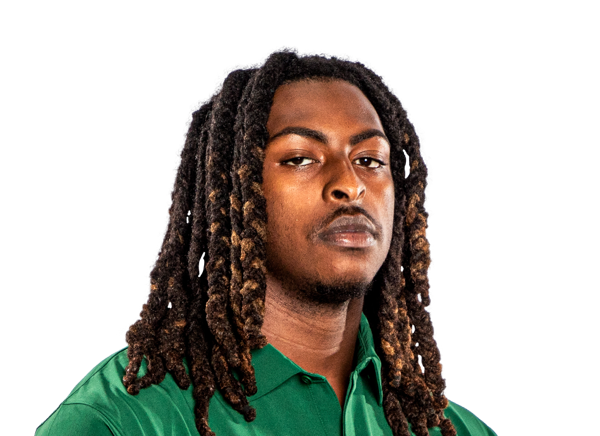 Jaylon Johnson#2 | 3 | 3 | 0 | 0 | 0 | 2 | 0 |
 DJ Burgess#7 | 2 | 2 | 0 | 1 | 0 | 0 | 0 |
 DeQuinder Williams II#11 | 2 | 2 | 0 | 0 | 0 | 0 | 0 |
 Jerry Wall III#10 | 2 | 2 | 0 | 0 | 0 | 0 | 0 |
 Jamarrion Solomon#51 | 2 | 1 | 0 | 0 | 0 | 0 | 0 |
| Logan Mauldin#3 | 1 | 1 | 0 | 0 | 0 | 0 | 0 |
 CJ Clinkscales Jr.#12 | 1 | 1 | 0 | 0 | 0 | 0 | 0 |
 D'Nas White#88 | 1 | 1 | 0 | 0 | 0 | 0 | 0 |
 Shaku Sangarie#55 | 1 | 1 | 0 | 0 | 0 | 0 | 0 |
 Calif Spencer#8 | 1 | 1 | 0 | 0 | 0 | 0 | 0 |
 Jonathan Patterson#5 | 1 | 1 | 0 | 0 | 0 | 1 | 0 |
 Devon St. Clair#26 | 1 | 0 | 0 | 0 | 0 | 0 | 0 |
App State| Player | TOT | SOLO | SACKS | TFL | PD | QB HUR | TD |
|---|---|---|---|---|---|---|---|
| Devin Henderson#7 | 8 | 5 | 0 | 0 | 0 | 0 | 0 |
 Colton Phares#10 | 6 | 5 | 0 | 1 | 0 | 0 | 0 |
 Kaleb Purdy#25 | 4 | 4 | 0 | 0 | 0 | 0 | 0 |
 Juan Berchal | 4 | 2 | 0 | 1 | 0 | 0 | 0 |
 Khalil Conley#6 | 3 | 3 | 0 | 0 | 0 | 0 | 0 |
| Caleb Sandstrom#41 | 3 | 2 | 1 | 1.5 | 0 | 0 | 0 |
 Ja'Den McBurrows#1 | 3 | 2 | 0 | 0 | 0 | 0 | 0 |
 Ja'Cari Henderson#3 | 3 | 1 | 0 | 0 | 0 | 0 | 0 |
 Carson Sloan#5 | 2 | 2 | 0 | 0 | 0 | 1 | 0 |
 Jakob Gude#4 | 2 | 1 | 0 | 0 | 0 | 0 | 0 |
 Dre Walker#8 | 2 | 1 | 0 | 1 | 0 | 0 | 0 |
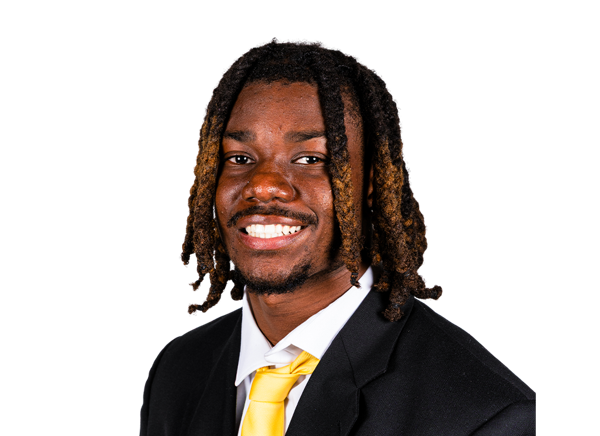 Keshawn Thomas#13 | 2 | 0 | 0 | 0 | 0 | 3 | 0 |
 Alex Mitchell#15 | 1 | 1 | 0 | 0 | 0 | 0 | 0 |
 Jehchys Brown#50 | 1 | 1 | 0 | 0 | 0 | 1 | 0 |
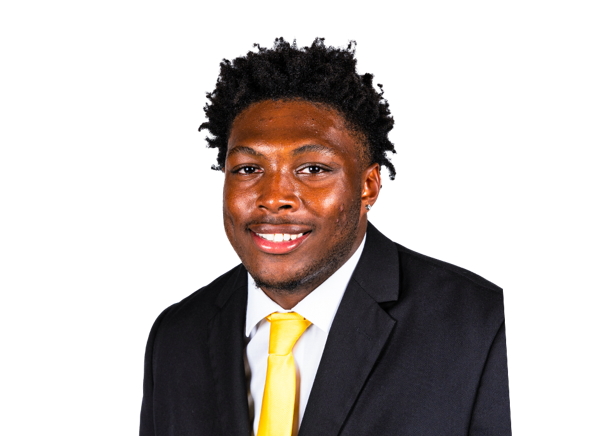 Caleb Pitts#94 | 1 | 1 | 0 | 0 | 0 | 0 | 0 |
 Aaron Clark#99 | 1 | 1 | 0 | 0 | 0 | 0 | 0 |
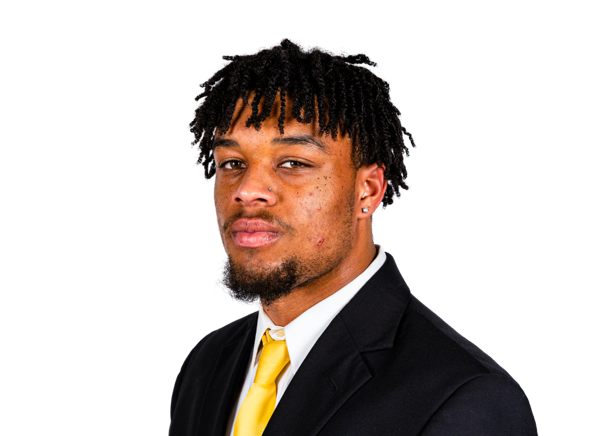 Joe Reddish#21 | 1 | 1 | 0 | 0 | 0 | 0 | 0 |
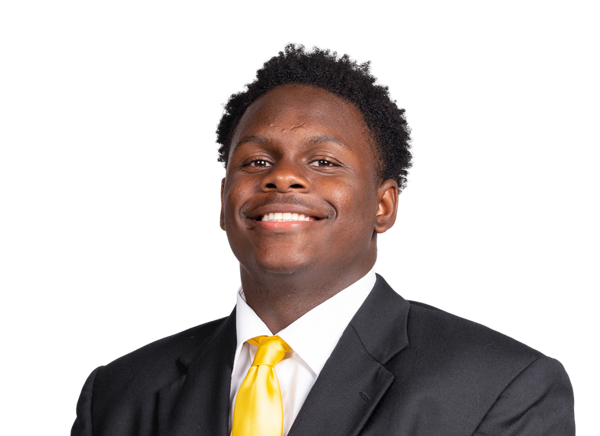 Aiden Benton#33 | 1 | 1 | 0 | 0 | 0 | 3 | 0 |
 Ricky Lolohea#96 | 1 | 0 | 0 | 0 | 0 | 0 | 0 |
 Ki'Shawn Harvey#95 | 1 | 0 | 0 | 0.5 | 0 | 0 | 0 |
 Eric Adams#20 | 0 | 0 | 0 | 0 | 2 | 0 | 0 |
Charlotte| Player | FUM | LOST | REC |
|---|---|---|---|
| Jaylen Hampton#2 | 1 | 0 | 0 |
| Khamani Alexander#5 | 0 | 0 | 1 |
App State| Player | FUM | LOST | REC |
|---|---|---|---|
| Chris Lofton#6 | 1 | 1 | 0 |
Charlotte| Player | FG | PCT | LONG | XP | PTS |
|---|---|---|---|---|---|
 Ian Kelly#44 | 0/0 | 0.0 | 0 | 1/1 | 1 |
App State| Player | FG | PCT | LONG | XP | PTS |
|---|---|---|---|---|---|
 James London#83 | 2/2 | 100.0 | 47 | 2/2 | 8 |
Charlotte| Player | NO | YDS | AVG | TB | In 20 | LONG |
|---|---|---|---|---|---|---|
| Ian Kelly#44 | 5 | 211 | 42.2 | 0 | 1 | 45 |
App State| Player | NO | YDS | AVG | TB | In 20 | LONG |
|---|---|---|---|---|---|---|
 Jaxson Dunn#40 | 4 | 145 | 36.3 | 0 | 2 | 43 |
App State| Player | NO | YDS | AVG | LONG | TD |
|---|---|---|---|---|---|
| Ja'Quez Cross#11 | 1 | 0 | 0.0 | 0 | 0 |
App State| Player | NO | YDS | AVG | LONG | TD |
|---|---|---|---|---|---|
| Chris Lofton#6 | 1 | -3 | -3.0 | 0 | 0 |
Charlotte| Player | INT | YDS | TD |
|---|---|---|---|
| Collin Gill | 1 | 36 | 1 |
App State| Player | INT | YDS | TD |
|---|---|---|---|
| Khalil Conley#6 | 1 | 0 | 0 |
| Dre Walker#8 | 1 | -1 | 0 |
Drive Summary
CLT
Punt
5
CLT
Downs
-14
APP
Field Goal
41
CLT
Punt
5
APP
Punt
2
CLT
Downs
40
APP
Punt
24
CLT
Punt
18
APP
Touchdown
74
CLT
Punt
31
APP
Punt
19
CLT
Touchdown
68
APP
Field Goal
46
APP
Downs
74
CLT
Interception
2
APP
Touchdown
27
CLT
Punt
4
APP
Touchdown
74
CLT
Touchdown
75
APP
Punt
33
CLT
Interception
45
APP
Interception Touchdown
3
APP
End Of Quarter
-6
Injury Report
No current injury report is available for this matchup.
Head-to-Head
Historical meetings are not available for this matchup.
Game Information
StageWeek 3
Season2026
KickoffSat, Sep 19, 9:30 pm
VenueKidd Brewer Stadium
LocationBoone, NC
SurfaceArtificial Turf
BroadcastESPN+
Division Standings
FBS — American Conference
| Team | W | L | T | Pct | PF | PA | Home | Away | Strk |
|---|---|---|---|---|---|---|---|---|---|
 South Florida | 6 | 4 | 0 | 0.600 | 274 | 188 | 4-2 | 2-2 | L2 |
 Florida Atlantic | 6 | 4 | 0 | 0.600 | 383 | 353 | 5-0 | 1-4 | L1 |
 Tulsa | 6 | 4 | 0 | 0.600 | 336 | 226 | 3-2 | 3-2 | W2 |
 Memphis | 8 | 2 | 0 | 0.800 | 390 | 253 | 5-0 | 3-2 | W3 |
 UTSA | 7 | 2 | 0 | 0.778 | 297 | 268 | 4-0 | 3-2 | L1 |
 East Carolina | 6 | 4 | 0 | 0.600 | 229 | 226 | 4-1 | 2-3 | W3 |
 North Texas | 7 | 2 | 0 | 0.778 | 402 | 278 | 5-0 | 2-2 | W6 |
 Rice | 1 | 9 | 0 | 0.100 | 208 | 326 | 1-4 | 0-5 | L9 |
 Temple | 2 | 8 | 0 | 0.200 | 234 | 291 | 1-5 | 1-3 | L5 |
 Tulane | 5 | 5 | 0 | 0.500 | 210 | 280 | 3-2 | 2-3 | W1 |
 UAB | 6 | 4 | 0 | 0.600 | 232 | 224 | 5-0 | 1-4 | W2 |
| Charlotte | 1 | 9 | 0 | 0.100 | 193 | 362 | 0-5 | 1-4 | L3 |
 Army | 5 | 4 | 0 | 0.556 | 290 | 228 | 3-2 | 2-2 | L2 |
 Navy | 3 | 6 | 0 | 0.333 | 263 | 274 | 3-2 | 0-4 | W1 |
Charlotte
VS
App State
6th in Sun Belt
Quarterbacks & Specialists
#9
Cole Gonzales
#44
Ian Kelly
Receivers & Backs
#5
Khamani Alexander
#1
Jaden Barnes
#89
Derrick Eley
#2
Jaylen Hampton
#85
Jason Jeffares
#3
Logan Mauldin
#21
Henry Rutledge
Defensive Line & Linebackers
#95
Devin Ancrum
#7
DJ Burgess
#2
Jaylon Johnson
#55
Shaku Sangarie
#19
Kadin Schmitz
#9
Curtis Simpson
#51
Jamarrion Solomon
#8
Calif Spencer
#10
Jerry Wall III
#88
D'Nas White
#13
Gavin Willis
Defensive Backs
#28
Cornell Allen
#12
CJ Clinkscales Jr.
#1
Jameel Croft Jr.
Collin Gill
#5
Jonathan Patterson
#26
Devon St. Clair
#18
Chase Usher
#11
DeQuinder Williams II
#3
Dy'Lon Womack
Quarterbacks & Specialists
#40
Jaxson Dunn
#8
Henry Hasselbeck
#3
Malachi Singleton
Receivers & Backs
#1
Nate Branch
#11
Ja'Quez Cross
#7
Darrin Fugitt
#13
Jackson Grier
#19
Jamel Howse
#83
Daz James
#5
Jaquari Lewis
#6
Chris Lofton
Sam Pickett III
#16
Alexander Sanchez
#4
Treyaun Webb
Defensive Line & Linebackers
#33
Aiden Benton
#50
Jehchys Brown
#99
Aaron Clark
#95
Ki'Shawn Harvey
#96
Ricky Lolohea
#15
Alex Mitchell
#10
Colton Phares
#94
Caleb Pitts
#41
Caleb Sandstrom
#5
Carson Sloan
#13
Keshawn Thomas
Defensive Backs
#20
Eric Adams
Juan Berchal
#6
Khalil Conley
#4
Jakob Gude
#7
Devin Henderson
#3
Ja'Cari Henderson
#1
Ja'Den McBurrows
#25
Kaleb Purdy
#21
Joe Reddish
#8
Dre Walker
Other
#83
James London
Charlotte
9th in American
VS
App State
3rd in Sun Belt - East
Passing
64.7
Completion Percentage
67.3
132
Completions
132
4.40
Interception Percentage
1.50
9
Interceptions
3
75
Longest Pass
54
1,399
Net Passing Yards
1,606
199.9
Net Passing Yards Per Game
267.7
204
Passing Attempts
196
2.90
Passing Touchdown %
4.10
6
Passing Touchdowns
8
123.6
Passer Rating
146.6
13
Total Sacks
8
68
Sack Yards Lost
43
6.9
Yards Per Pass Attempt
8.2
1,399
Passing Yards
1,606
0
Passing Fumbles Lost
0
7
Team Games Played
6
310.9
Yards Per Game
421.7
19.1
Total Points Per Game
29.5
134
Total Points
177
17
Total Touchdowns
22
199.9
Passing Yards Per Game
267.7
132-204
Comp-Att
132-196
13-68
Sacks-Yards Lost
8-43
Rushing
201
Rushing Attempts
218
777
Rushing Yards
924
3.9
Yards Per Rush Attempt
4.2
75
Long Rushing
39
0
20+ Yard Rushing Plays
0
9
Rushing Touchdowns
14
111.0
Rushing Yards Per Game
154.0
0
Rushing Fumbles
0
0
Rushing Fumbles Lost
0
35
Rushing 1st downs
50
7
Team Games Played
6
2,176
Total Yards
2,530
418
Total Offensive Plays
422
19.1
Total Points Per Game
29.5
134
Total Points
177
17
Total Touchdowns
22
Receiving
132
Receptions
132
0
Receiving Targets
0
1,399
Receiving Yards
1,606
1,399
Receiving Yards
1,606
6
Receiving Touchdowns
8
75
Long Reception
54
0
20+ Yard Receiving Plays
0
199.9
Receiving Yards Per Game
267.7
0
Receiving Fumbles
0
0
Receiving Fumbles Lost
0
808
Receiving Yards After Catch
747
55
Receiving First Downs
72
7
Team Games Played
6
10.6
Yards Per Reception
12.2
19.1
Total Points Per Game
29.5
134
Total Points
177
17
Total Touchdowns
22
Miscellaneous
104
Total 1st downs
132
35
Rushing 1st downs
50
55
Passing 1st downs
72
14
1st downs by penalty
10
26
Third Down Conversions
28
86
Third Down Attempts
80
30.23
3rd down %
35.00
3
Fourth Down Conversions
6
11
First Downs Attempts
11
27.27
4th down %
54.55
44
Total Penalties
40
298
Total Penalty Yards
335
11690
Possession Time Seconds
10673
0.00
Red Zone Field Goal Percentage
0.00
0.00
Red Zone Scoring Percentage
0.00
0.00
Red Zone Efficiency Percentage
0.00
0.00
Red Zone Touchdown Percentage
0.00
12
Total Takeaways
5
16
Total Giveaways
7
-4
Turnover Ratio
-2
0
Fumbles Lost
0
26-86
3rd down efficiency
28-80
3-11
4th down efficiency
6-11
44-298
Total-Yards
40-335
Defense
299
Solo Tackles
213
194
Assist Tackles
180
493
Total Tackles
393
11
Sacks
9
81
Sack Yards
57
61
Stuffs
53
13
Passes Defended
25
18.0
Average Interception Yards
1.9
36
Long Interception
15
0
Miscellaneous Touchdowns
0
0
Kicks Blocked
1
29
Tackles For Loss
26
7
Team Games Played
6
Defensive Interceptions
2
Interceptions
9
36
Interception Yards
17
1
Interception Touchdowns
0
2-36
INT: Total
9-17
General
11
Fumbles
7
1
Forced Fumbles
4
3
Fumbles Recovered
2
1
Fumbles Touchdowns
0
7
Games Played
6
11-0
Fumbles-Lost
7-0
Returning
16
Kick Returns
8
308
Kick Return Yards
120
19.3
Yards Per Kick Return
15.0
27
Long Kick Return
30
0
Kick Return Touchdowns
0
5
Punt Returns
6
11
Punt Return Yards
22
2.2
Yards Per Punt Return
3.7
6
Long Punt Return
17
0
Punt Return Touchdowns
0
0
Punt Return Fair Catches
0
0
Kick Return Fumbles Lost
0
0
Punt Return Fumbles Lost
0
7
Team Games Played
6
5-11
Punt: Total
6-22
Kicking
5
Field Goal Made
8
7
Field Goal Attempts
11
71.4
Field Goal Percentage
72.7
47
Long Field Goal Made
48
0
Field Goal Attempts 1-19
0
3
Field Goal Attempts 20-29
0
0
Field Goal Attempts 30-39
4
4
Field Goal Attempts 40-49
6
0
Field Goal Attempts 50+
1
13
Extra Points Made
21
13
Extra Point Attempts
21
100.0
Extra Point Percentage
100.0
0
Field Goals Made 1-19
0
3
Field Goals Made 20-29
0
0
Field Goals Made 30-39
4
2
Field Goals Made 40-49
4
0
Field Goals Made 50+
0
28
Total Kicking Points
45
7
Team Games Played
6
67
Touchback Percentage
88
0.0
Average Kickoff Return Yards
0.0
0
Kickoff Return Yards
0
0
Kickoff Returns
0
0-0
Kickoffs: Total
0-0
5-7
FG: Good-Attempts
8-11
Punting
33
Punts
27
1,461
Punt Yards
1,143
61
Long Punt
66
44.3
Gross Average Punt Yards
42.3
44.3
Net Average Punt Yards
42.3
0
Punts Blocked
0
12
Punts Inside 20
11
2
Touchbacks
1
13
Fair Catches
7
10
Punt Returns
4
0
Punt Return Yards
0
0.0
Average Punt Return Yards
0.0
7
Team Games Played
6
33-1,461
Punt: Total Yards
27-1,143
Scoring
9
Rushing Touchdowns
14
6
Receiving Touchdowns
8
0
Return Touchdowns
0
16
Total Touchdowns
22
5
Field Goals
8
13
Kick Extra Points
21
2
Total Two Point Conversions
0
134
Total Points
177
19.1
Total Points Per Game
29.5