

Delaware vs Vanderbilt Live Score (12 Sep, 2026)
Score by Quarter
| Team | Q1 | Q2 | Q3 | Q4 | Final |
|---|---|---|---|---|---|
 Delaware |
0 | 17 | 0 | 9 | 26 |
 Vanderbilt |
14 | 0 | 21 | 0 | 35 |
Scoring Plays
Q1
1:19
1:19
Jar. Curtis run for 1 yd, Jar. Curtis fumbled, recovered by Jar. Curtis, Jar. Curtis returned for a TD (B. Taylor KICK)
Fumble Recovery (Own)
0 – 7
Q1
0:27
0:27
S. Alexander run for 9 yds, for a TD (B. Taylor KICK)
Rushing Touchdown
0 – 14
Q2
12:51
12:51
T. Smack 37 yd FG GOOD
Field Goal Good
3 – 14
Q2
1:56
1:56
V. Ellison Jr. run for 1 yd, for a TD (T. Smack KICK)
Rushing Touchdown
10 – 14
Q2
0:17
0:17
punt blocked by B. Graves (T. Smack KICK)
Punt
17 – 14
Q3
11:05
11:05
Jar. Curtis run for 1 yd, for a TD (B. Taylor KICK)
Rushing Touchdown
17 – 21
Q3
9:30
9:30
punt blocked by A. Howard (B. Taylor KICK)
Punt
17 – 29
Q3
0:04
0:04
Jar. Curtis pass to W. Taylor for 19 yds, for a TD (B. Taylor KICK)
Passing Touchdown
17 – 35
Q4
11:55
11:55
T. Smack 40 yd FG GOOD
Field Goal Good
20 – 35
Q4
6:37
6:37
N. Minicucci pass to D. Lofton for 43 yds, for a TD
Passing Touchdown
26 – 35
Game Leaders
DelawareVanderbilt
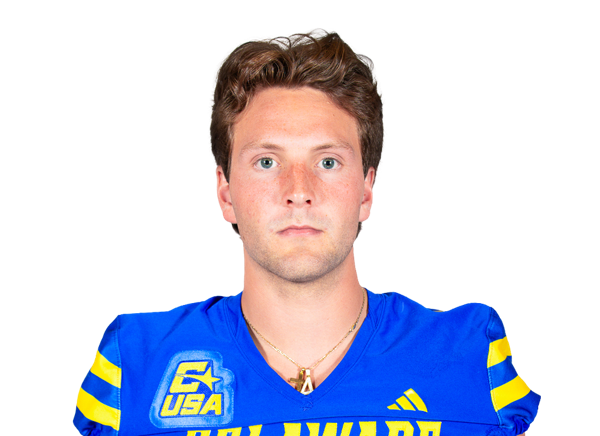 N. Minicucci QB
Passing Yards
 J. Curtis QB
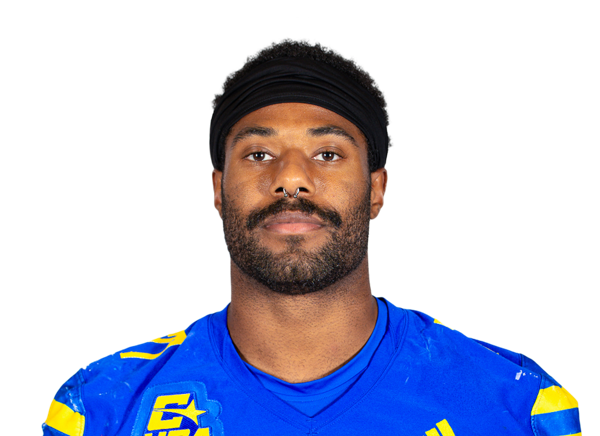 J. Silver RB
Rushing Yards
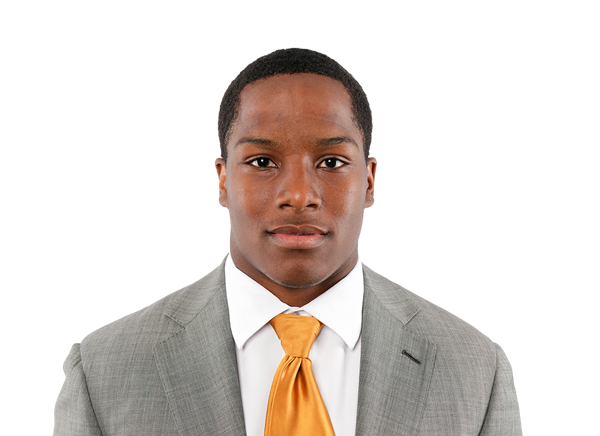 S. Alexander RB
 D. Lofton WR
Receiving Yards
 J. Sherrill WR
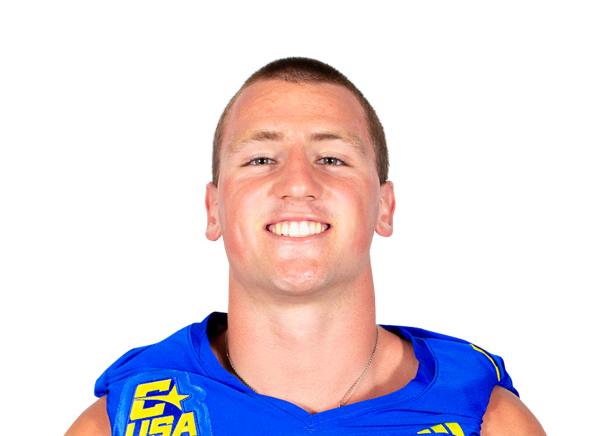 C. Gallagher LB
Sacks
 C. Heard S
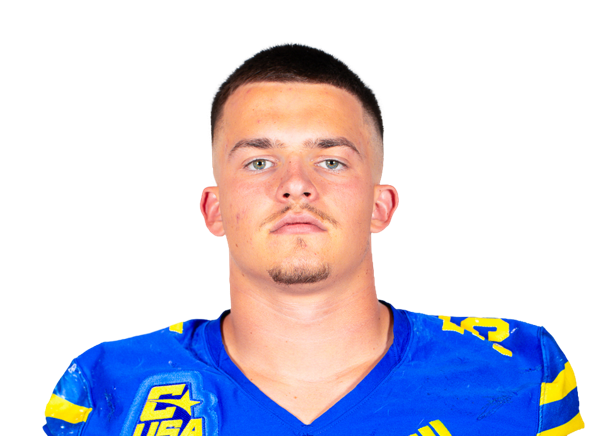 G. Moul LB
Tackles
C. Heard SPlayer Box Score
Delaware| Player | C/ATT | YDS | AVG | TD | INT |
|---|---|---|---|---|---|
| Nick Minicucci#4 | 11/27 | 182 | 6.7 | 1 | 2 |
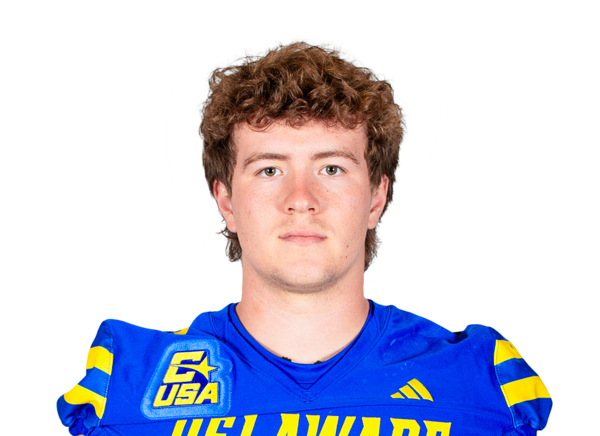 Braden Streeter#16 | 4/5 | 58 | 11.6 | 0 | 0 |
Vanderbilt| Player | C/ATT | YDS | AVG | TD | INT |
|---|---|---|---|---|---|
| Jared Curtis#2 | 14/22 | 210 | 9.5 | 1 | 0 |
 Blaze Berlowitz#1 | 3/9 | 29 | 3.2 | 0 | 0 |
Delaware| Player | CAR | YDS | AVG | TD | LONG |
|---|---|---|---|---|---|
| Jo Silver#27 | 16 | 109 | 6.8 | 0 | 37 |
 Kaderris Roberts#3 | 3 | 14 | 4.7 | 0 | 7 |
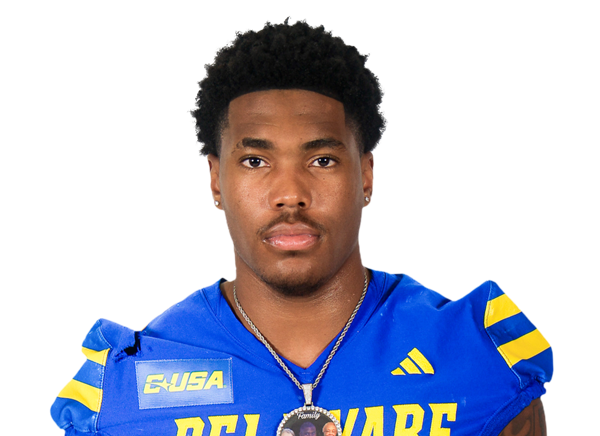 Viron Ellison Jr.#21 | 5 | 2 | 0.4 | 1 | 2 |
| Nick Minicucci#4 | 9 | -5 | -0.6 | 0 | 10 |
| Team | 1 | -5 | -5.0 | 0 | 5 |
| Braden Streeter#16 | 2 | -17 | -8.5 | 0 | 1 |
Vanderbilt| Player | CAR | YDS | AVG | TD | LONG |
|---|---|---|---|---|---|
| Sedrick Alexander#28 | 9 | 39 | 4.3 | 1 | 14 |
 Makhilyn Young#22 | 8 | 38 | 4.8 | 0 | 20 |
 Jamezell Lassiter#3 | 5 | 18 | 3.6 | 0 | 7 |
| Blaze Berlowitz#1 | 2 | 6 | 3.0 | 0 | 5 |
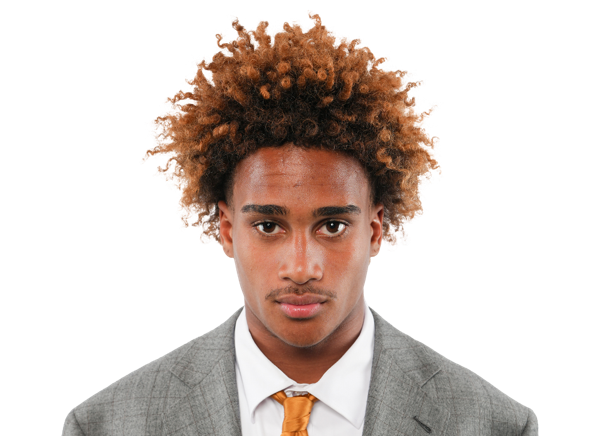 Kayleb Barnett#13 | 1 | 2 | 2.0 | 0 | 2 |
| Jared Curtis#2 | 8 | 1 | 0.1 | 2 | 9 |
| Evan Hampton#23 | 1 | 1 | 1.0 | 0 | 1 |
| Team | 4 | -5 | -1.3 | 0 | 5 |
Delaware| Player | REC | YDS | AVG | TD | LONG |
|---|---|---|---|---|---|
| Da'Wain Lofton#5 | 4 | 142 | 35.5 | 1 | 57 |
| Kaderris Roberts#3 | 2 | 42 | 21.0 | 0 | 31 |
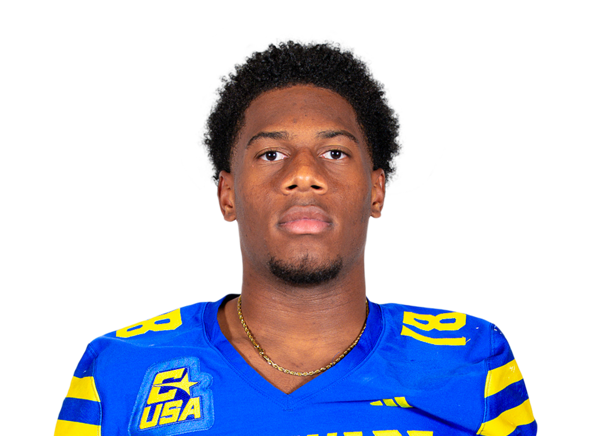 Sean Wilson#18 | 3 | 30 | 10.0 | 0 | 20 |
 Scott Moore#40 | 1 | 14 | 14.0 | 0 | 14 |
| Viron Ellison Jr.#21 | 1 | 8 | 8.0 | 0 | 8 |
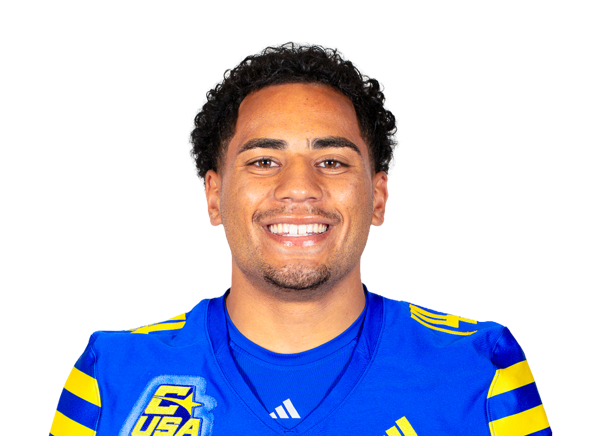 Donovan Lewis#14 | 1 | 6 | 6.0 | 0 | 6 |
 Bryson Graves | 3 | -2 | -0.7 | 0 | 4 |
Vanderbilt| Player | REC | YDS | AVG | TD | LONG |
|---|---|---|---|---|---|
| Junior Sherrill | 5 | 94 | 18.8 | 0 | 35 |
 Jayvontay Conner#8 | 6 | 87 | 14.5 | 0 | 31 |
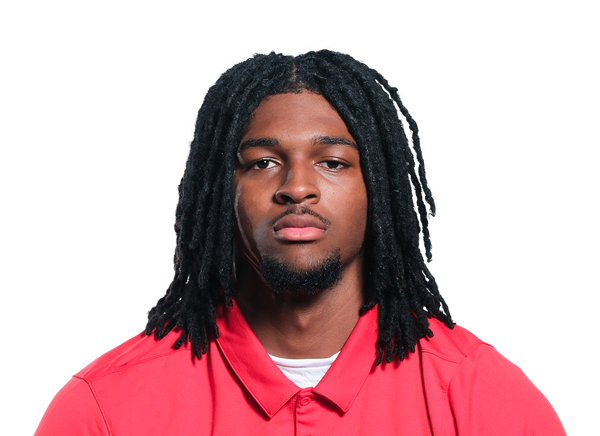 Walter Taylor#12 | 1 | 19 | 19.0 | 1 | 19 |
| Sedrick Alexander#28 | 2 | 15 | 7.5 | 0 | 8 |
| Makhilyn Young#22 | 1 | 9 | 9.0 | 0 | 9 |
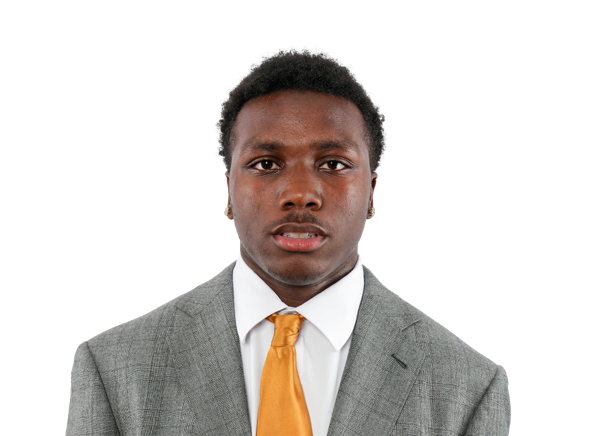 Tristen Brown#5 | 1 | 9 | 9.0 | 0 | 9 |
 Brycen Coleman#9 | 1 | 6 | 6.0 | 0 | 6 |
Delaware| Player | TOT | SOLO | SACKS | TFL | PD | QB HUR | TD |
|---|---|---|---|---|---|---|---|
| Gavin Moul#35 | 10 | 2 | 0 | 0 | 0 | 0 | 0 |
| Colin Gallagher#9 | 9 | 3 | 1.5 | 2.5 | 1 | 0 | 0 |
 Jamarion Kolagbodi#18 | 5 | 4 | 0 | 0 | 1 | 0 | 0 |
 George Mullins#29 | 5 | 2 | 0 | 0 | 0 | 0 | 0 |
 KT Seay#7 | 5 | 1 | 0 | 0 | 1 | 0 | 0 |
 Jaquise Alexander#8 | 4 | 3 | 0 | 0 | 1 | 0 | 0 |
 Trace Scott III#33 | 3 | 1 | 0.5 | 1.5 | 0 | 0 | 0 |
 Jawarren Corbin#11 | 3 | 1 | 0 | 0 | 0 | 1 | 0 |
 Dominick Brogna#52 | 3 | 0 | 0 | 0 | 0 | 2 | 0 |
 Brandon Gorham#3 | 3 | 0 | 0 | 0 | 0 | 0 | 0 |
 Kshawn Cox Jr.#6 | 2 | 2 | 0 | 0 | 0 | 0 | 0 |
 Kahlil Ali#2 | 2 | 1 | 0 | 0 | 0 | 0 | 0 |
| Viron Ellison Jr.#21 | 2 | 1 | 0 | 0 | 0 | 0 | 0 |
 AJ Graham#27 | 2 | 1 | 0 | 0 | 0 | 0 | 0 |
 Blake Matthews#10 | 2 | 0 | 0.5 | 0.5 | 0 | 3 | 0 |
 Matthew McKinley-Daniels#80 | 2 | 0 | 0 | 0 | 0 | 0 | 0 |
 Jalen Bell#20 | 2 | 0 | 0 | 0 | 0 | 1 | 0 |
 Noah Jefferson#16 | 2 | 0 | 0 | 0 | 0 | 0 | 0 |
| Da'Wain Lofton#5 | 1 | 1 | 0 | 0 | 0 | 0 | 0 |
 Elijah Sessoms#88 | 1 | 1 | 0 | 0 | 0 | 0 | 0 |
 Nasir Eatmon#36 | 1 | 1 | 0 | 0 | 0 | 0 | 0 |
 Demarco Daniels#4 | 1 | 1 | 0 | 0 | 0 | 0 | 0 |
 Kevin Moore#19 | 1 | 1 | 0 | 0 | 0 | 0 | 0 |
 Sam Siafa#88 | 1 | 0 | 0 | 0 | 0 | 0 | 0 |
 Nate Ray#89 | 1 | 0 | 0 | 0 | 0 | 0 | 0 |
 Kaeden Singleton#44 | 1 | 0 | 0.5 | 0.5 | 0 | 0 | 0 |
 Trent Gummer#21 | 1 | 0 | 0 | 0 | 0 | 0 | 0 |
| Bryson Graves | 0 | 0 | 0 | 0 | 0 | 0 | 1 |
Vanderbilt| Player | TOT | SOLO | SACKS | TFL | PD | QB HUR | TD |
|---|---|---|---|---|---|---|---|
| CJ Heard#8 | 8 | 5 | 2 | 2 | 1 | 0 | 0 |
 Miles Capers#29 | 7 | 4 | 1 | 4 | 1 | 1 | 0 |
 Nick Rinaldi#24 | 7 | 2 | 1.5 | 2.5 | 2 | 2 | 0 |
 Bryan Longwell#11 | 6 | 2 | 0 | 0.5 | 0 | 1 | 0 |
 Martel Hight#4 | 4 | 2 | 0 | 0 | 1 | 1 | 0 |
 Jordan Matthews#6 | 4 | 2 | 0 | 0 | 0 | 0 | 0 |
 Carson Lawrence#3 | 4 | 1 | 0.5 | 0.5 | 0 | 0 | 0 |
 Cayden Daniels#26 | 3 | 2 | 0 | 0 | 0 | 1 | 0 |
 Glenn Seabrooks III#53 | 3 | 1 | 0 | 0 | 0 | 0 | 0 |
 Jaylon Stone#92 | 3 | 1 | 0 | 0 | 0 | 0 | 0 |
| Mason Lewis#25 | 2 | 2 | 0 | 0 | 0 | 0 | 0 |
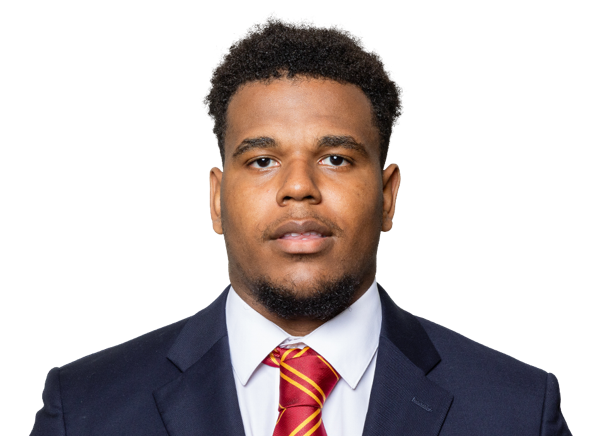 Edwin Kolenge#17 | 2 | 1 | 1 | 1 | 0 | 1 | 0 |
 Bradley Mann#94 | 2 | 1 | 0 | 0 | 0 | 0 | 0 |
 Ricardo Jones#7 | 2 | 1 | 0 | 0 | 1 | 1 | 0 |
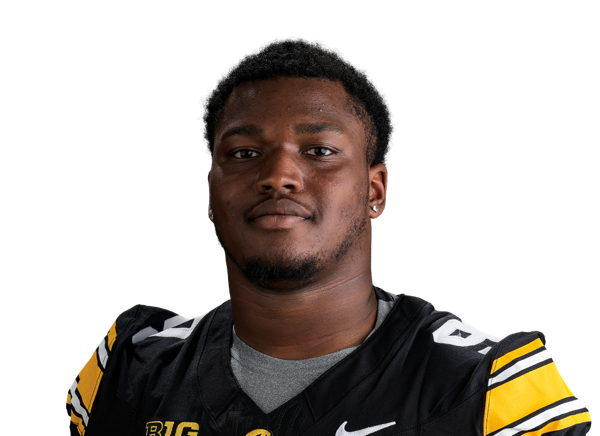 Brian Allen Jr.#10 | 2 | 0 | 0 | 0 | 0 | 0 | 0 |
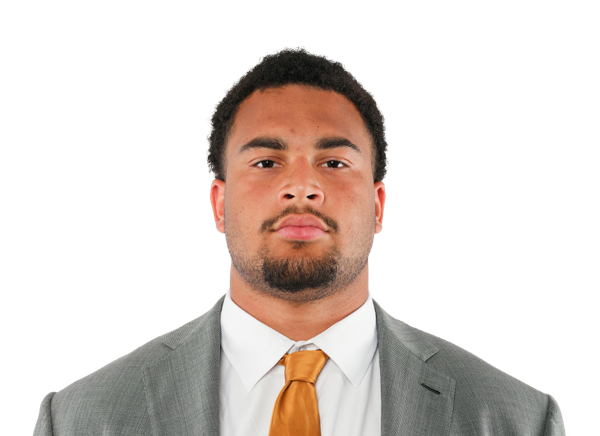 Issa Ouattara#5 | 2 | 0 | 0 | 0 | 0 | 1 | 0 |
 Josiah Broxton#18 | 2 | 0 | 0 | 0 | 0 | 0 | 0 |
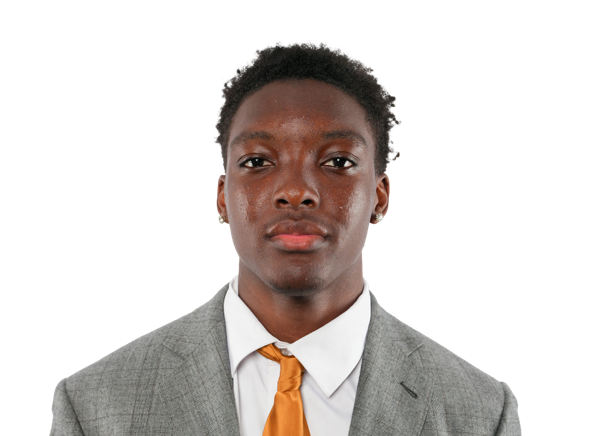 Davin Chandler#21 | 2 | 0 | 0 | 0.5 | 1 | 0 | 0 |
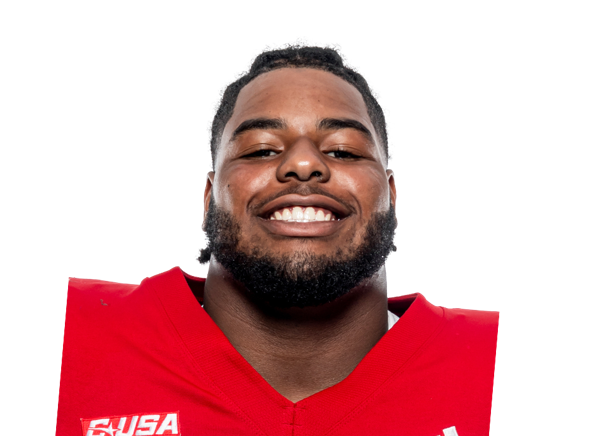 Talan Carter#99 | 2 | 0 | 0 | 0 | 0 | 1 | 0 |
 Bryce Cowan#22 | 1 | 0 | 0 | 0 | 0 | 0 | 0 |
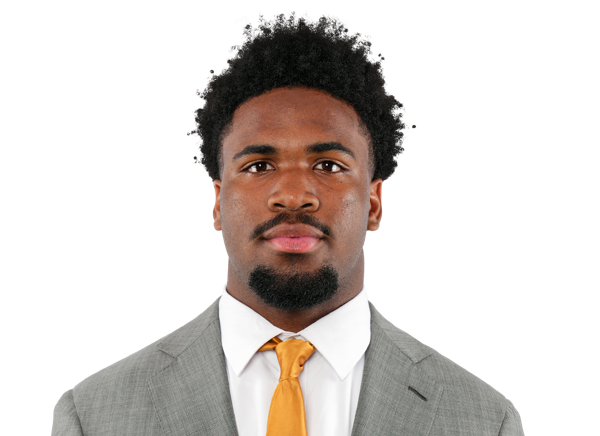 Vanzale Hinton#12 | 1 | 0 | 0 | 0 | 0 | 0 | 0 |
 Mason Carter#32 | 0 | 0 | 0 | 0 | 0 | 1 | 0 |
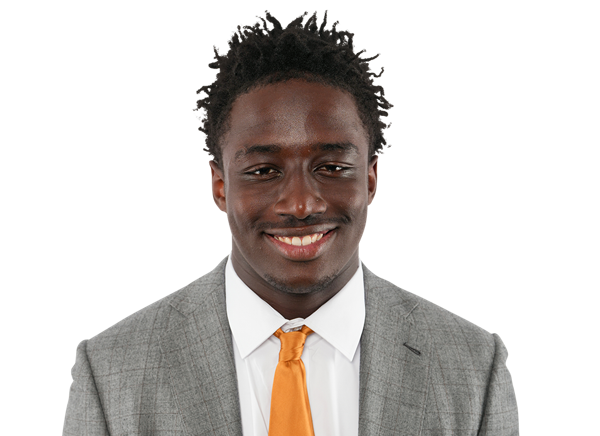 Austin Howard#30 | 0 | 0 | 0 | 0 | 0 | 0 | 1 |
Delaware| Player | FUM | LOST | REC |
|---|---|---|---|
| Bryson Graves | 2 | 0 | 0 |
| Team | 1 | 0 | 0 |
| Braden Streeter#16 | 1 | 0 | 0 |
| AJ Graham#27 | 0 | 0 | 1 |
Vanderbilt| Player | FUM | LOST | REC |
|---|---|---|---|
| Blaze Berlowitz#1 | 1 | 1 | 0 |
| Jared Curtis#2 | 1 | 0 | 0 |
Delaware| Player | FG | PCT | LONG | XP | PTS |
|---|---|---|---|---|---|
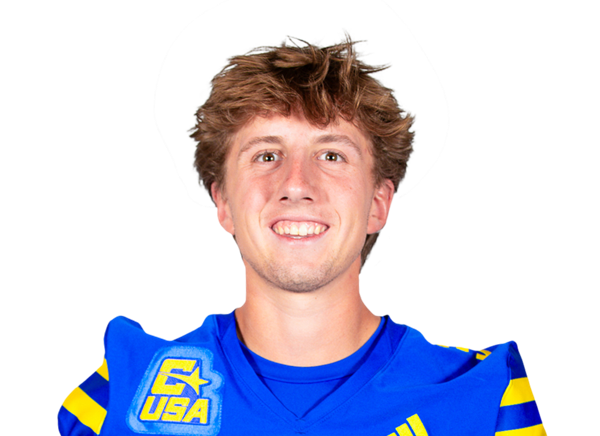 Tucker Smack#31 | 2/2 | 100.0 | 40 | 2/2 | 8 |
Vanderbilt| Player | FG | PCT | LONG | XP | PTS |
|---|---|---|---|---|---|
 Brock Taylor#88 | 0/0 | 0.0 | 42 | 5/5 | 5 |
Delaware| Player | NO | YDS | AVG | TB | In 20 | LONG |
|---|---|---|---|---|---|---|
 Josh Cupitt#39 | 6 | 247 | 41.2 | 0 | 1 | 47 |
| Team | 1 | 0 | 0.0 | 0 | 0 | 0 |
Vanderbilt| Player | NO | YDS | AVG | TB | In 20 | LONG |
|---|---|---|---|---|---|---|
 Tyler Ebel#37 | 4 | 191 | 47.8 | 0 | 1 | 52 |
| Team | 1 | 0 | 0.0 | 0 | 0 | 0 |
Delaware| Player | NO | YDS | AVG | LONG | TD |
|---|---|---|---|---|---|
| Bryson Graves | 1 | 19 | 19.0 | 19 | 0 |
Vanderbilt| Player | NO | YDS | AVG | LONG | TD |
|---|---|---|---|---|---|
| Junior Sherrill | 2 | 51 | 25.5 | 27 | 0 |
Delaware| Player | NO | YDS | AVG | LONG | TD |
|---|---|---|---|---|---|
| Bryson Graves | 3 | 6 | 2.0 | 5 | 1 |
Vanderbilt| Player | NO | YDS | AVG | LONG | TD |
|---|---|---|---|---|---|
| Martel Hight#4 | 3 | 47 | 15.7 | 25 | 0 |
 Cole Adams#7 | 1 | 11 | 11.0 | 11 | 0 |
| Austin Howard#30 | 1 | 0 | 0.0 | 0 | 1 |
Vanderbilt| Player | INT | YDS | TD |
|---|---|---|---|
| Cayden Daniels#26 | 1 | 8 | 0 |
| Martel Hight#4 | 1 | 2 | 0 |
Drive Summary
DEL
Punt
12
VAN
Punt
7
DEL
Punt
3
VAN
Fumble
54
DEL
Punt
7
VAN
Fumble
41
DEL
Interception
0
VAN
Touchdown
26
DEL
Field Goal
55
VAN
Punt
-13
DEL
Punt
2
VAN
Downs
49
DEL
Touchdown
82
VAN
Fumble
34
DEL
Punt
5
VAN
Punt Return Touchdown
0
VAN
End Of Half
-2
VAN
Touchdown
70
DEL
Punt Return Touchdown
0
DEL
Punt
13
VAN
Touchdown
60
DEL
Field Goal
52
VAN
Punt
17
DEL
Touchdown
80
VAN
Downs
36
DEL
Interception
30
VAN
End Of Quarter
-3
Injury Report
No current injury report is available for this matchup.
Head-to-Head
Historical meetings are not available for this matchup.
Game Information
StageWeek 2
Season2026
KickoffSat, Sep 12, 4:15 pm
VenueFirstBank Stadium
LocationNashville, TN
SurfaceArtificial Turf
BroadcastSEC Network
Division Standings
FBS — Conference USA
| Team | W | L | T | Pct | PF | PA | Home | Away | Strk |
|---|---|---|---|---|---|---|---|---|---|
 Kennesaw State | 4 | 6 | 0 | 0.400 | 252 | 250 | 2-3 | 2-3 | W3 |
 Middle Tennessee | 5 | 5 | 0 | 0.500 | 265 | 307 | 4-1 | 1-4 | L1 |
| Delaware | 5 | 5 | 0 | 0.500 | 297 | 278 | 4-1 | 1-4 | W1 |
 Jacksonville State | 7 | 3 | 0 | 0.700 | 286 | 208 | 5-0 | 2-3 | L1 |
 Liberty | 9 | 1 | 0 | 0.900 | 328 | 145 | 5-0 | 4-1 | W9 |
 New Mexico State | 3 | 7 | 0 | 0.300 | 207 | 259 | 2-3 | 1-4 | L3 |
 Florida International | 4 | 6 | 0 | 0.400 | 190 | 207 | 4-1 | 0-5 | L1 |
 Missouri State | 4 | 6 | 0 | 0.400 | 242 | 291 | 4-1 | 0-5 | W1 |
 Sam Houston | 1 | 9 | 0 | 0.100 | 165 | 274 | 1-4 | 0-5 | L7 |
 Western Kentucky | 4 | 6 | 0 | 0.400 | 247 | 324 | 3-1 | 1-5 | W1 |
FBS — Southeastern Conference
| Team | W | L | T | Pct | PF | PA | Home | Away | Strk |
|---|---|---|---|---|---|---|---|---|---|
 Alabama | 8 | 2 | 0 | 0.800 | 358 | 189 | 4-1 | 4-1 | W3 |
 Georgia | 9 | 1 | 0 | 0.900 | 418 | 147 | 6-1 | 3-0 | W3 |
 Mississippi State | 4 | 6 | 0 | 0.400 | 245 | 291 | 2-4 | 2-2 | L6 |
 Missouri | 6 | 4 | 0 | 0.600 | 293 | 229 | 4-1 | 2-3 | L2 |
 Texas A&M | 4 | 6 | 0 | 0.400 | 242 | 190 | 4-2 | 0-4 | L3 |
| Vanderbilt | 4 | 6 | 0 | 0.400 | 213 | 286 | 3-3 | 1-3 | L1 |
 Arkansas | 4 | 6 | 0 | 0.400 | 214 | 253 | 3-3 | 1-3 | W1 |
 Auburn | 6 | 4 | 0 | 0.600 | 260 | 246 | 4-2 | 2-2 | W2 |
 Florida | 6 | 4 | 0 | 0.600 | 313 | 262 | 3-2 | 3-2 | W1 |
 LSU | 6 | 4 | 0 | 0.600 | 355 | 181 | 5-2 | 1-2 | L2 |
 Ole Miss | 6 | 3 | 0 | 0.667 | 304 | 234 | 5-1 | 1-2 | L1 |
 South Carolina | 6 | 4 | 0 | 0.600 | 318 | 245 | 4-2 | 2-2 | L1 |
 Tennessee | 8 | 2 | 0 | 0.800 | 314 | 143 | 5-1 | 3-1 | W2 |
 Texas | 8 | 2 | 0 | 0.800 | 302 | 178 | 5-1 | 3-1 | W4 |
 Oklahoma | 5 | 4 | 0 | 0.556 | 199 | 173 | 3-2 | 2-2 | W1 |
 Kentucky | 7 | 3 | 0 | 0.700 | 283 | 253 | 4-2 | 3-1 | L2 |
Delaware
4th in CUSA
VS
Vanderbilt
13th in SEC
Quarterbacks & Specialists
#39
Josh Cupitt
#4
Nick Minicucci
#16
Braden Streeter
Receivers & Backs
#21
Viron Ellison Jr.
Bryson Graves
#14
Donovan Lewis
#5
Da'Wain Lofton
#80
Matthew McKinley-Daniels
#40
Scott Moore
#3
Kaderris Roberts
#88
Elijah Sessoms
#27
Jo Silver
#18
Sean Wilson
Defensive Line & Linebackers
#20
Jalen Bell
#52
Dominick Brogna
#11
Jawarren Corbin
#4
Demarco Daniels
#9
Colin Gallagher
#3
Brandon Gorham
#10
Blake Matthews
#35
Gavin Moul
#89
Nate Ray
#33
Trace Scott III
#88
Sam Siafa
#44
Kaeden Singleton
Defensive Backs
#8
Jaquise Alexander
#2
Kahlil Ali
#6
Kshawn Cox Jr.
#36
Nasir Eatmon
#27
AJ Graham
#21
Trent Gummer
#16
Noah Jefferson
#18
Jamarion Kolagbodi
#19
Kevin Moore
#29
George Mullins
#7
KT Seay
Other
#31
Tucker Smack
Quarterbacks & Specialists
#1
Blaze Berlowitz
#2
Jared Curtis
#37
Tyler Ebel
Receivers & Backs
#7
Cole Adams
#28
Sedrick Alexander
#13
Kayleb Barnett
#5
Tristen Brown
#9
Brycen Coleman
#8
Jayvontay Conner
#23
Evan Hampton
#3
Jamezell Lassiter
Junior Sherrill
#12
Walter Taylor
#22
Makhilyn Young
Defensive Line & Linebackers
#18
Josiah Broxton
#99
Talan Carter
#22
Bryce Cowan
#30
Austin Howard
#11
Bryan Longwell
#94
Bradley Mann
#5
Issa Ouattara
#24
Nick Rinaldi
#53
Glenn Seabrooks III
#92
Jaylon Stone
Defensive Backs
#21
Davin Chandler
#26
Cayden Daniels
#8
CJ Heard
#4
Martel Hight
#12
Vanzale Hinton
#7
Ricardo Jones
#3
Carson Lawrence
#25
Mason Lewis
#6
Jordan Matthews
Other
#10
Brian Allen Jr.
#29
Miles Capers
#32
Mason Carter
#17
Edwin Kolenge
#88
Brock Taylor
Delaware
3rd in CUSA
VS
Vanderbilt
15th in SEC
Passing
62.3
Completion Percentage
62.5
226
Completions
200
2.20
Interception Percentage
2.80
8
Interceptions
9
75
Longest Pass
60
2,928
Net Passing Yards
2,284
292.8
Net Passing Yards Per Game
228.4
363
Passing Attempts
320
6.60
Passing Touchdown %
2.80
24
Passing Touchdowns
9
147.8
Passer Rating
125.8
26
Total Sacks
23
160
Sack Yards Lost
143
8.1
Yards Per Pass Attempt
7.1
2,928
Passing Yards
2,284
0
Passing Fumbles Lost
0
10
Team Games Played
10
399.4
Yards Per Game
330.5
29.7
Total Points Per Game
21.3
297
Total Points
213
39
Total Touchdowns
24
292.8
Passing Yards Per Game
228.4
226-363
Comp-Att
200-320
26-160
Sacks-Yards Lost
23-143
Rushing
301
Rushing Attempts
325
1,066
Rushing Yards
1,021
3.5
Yards Per Rush Attempt
3.1
62
Long Rushing
34
0
20+ Yard Rushing Plays
0
13
Rushing Touchdowns
12
106.6
Rushing Yards Per Game
102.1
0
Rushing Fumbles
0
0
Rushing Fumbles Lost
0
66
Rushing 1st downs
66
10
Team Games Played
10
3,994
Total Yards
3,305
690
Total Offensive Plays
668
29.7
Total Points Per Game
21.3
297
Total Points
213
39
Total Touchdowns
24
Receiving
226
Receptions
200
0
Receiving Targets
0
2,928
Receiving Yards
2,284
2,928
Receiving Yards
2,284
24
Receiving Touchdowns
9
75
Long Reception
60
0
20+ Yard Receiving Plays
0
292.8
Receiving Yards Per Game
228.4
0
Receiving Fumbles
0
0
Receiving Fumbles Lost
0
1331
Receiving Yards After Catch
1065
127
Receiving First Downs
97
10
Team Games Played
10
13.0
Yards Per Reception
11.4
29.7
Total Points Per Game
21.3
297
Total Points
213
39
Total Touchdowns
24
Miscellaneous
215
Total 1st downs
176
66
Rushing 1st downs
66
128
Passing 1st downs
97
21
1st downs by penalty
13
45
Third Down Conversions
50
126
Third Down Attempts
140
35.71
3rd down %
35.71
13
Fourth Down Conversions
15
23
First Downs Attempts
25
56.52
4th down %
60.00
60
Total Penalties
90
536
Total Penalty Yards
647
17381
Possession Time Seconds
18597
0.00
Red Zone Field Goal Percentage
0.00
0.00
Red Zone Scoring Percentage
0.00
0.00
Red Zone Efficiency Percentage
0.00
0.00
Red Zone Touchdown Percentage
0.00
17
Total Takeaways
12
12
Total Giveaways
15
5
Turnover Ratio
-3
0
Fumbles Lost
0
45-126
3rd down efficiency
50-140
13-23
4th down efficiency
15-25
60-536
Total-Yards
90-647
Defense
308
Solo Tackles
305
404
Assist Tackles
346
712
Total Tackles
651
23
Sacks
22
155
Sack Yards
139
67
Stuffs
66
37
Passes Defended
42
11.4
Average Interception Yards
4.4
46
Long Interception
17
0
Miscellaneous Touchdowns
0
2
Kicks Blocked
1
47
Tackles For Loss
37
10
Team Games Played
10
Defensive Interceptions
10
Interceptions
7
114
Interception Yards
31
1
Interception Touchdowns
0
10-114
INT: Total
7-31
General
10
Fumbles
12
9
Forced Fumbles
4
9
Fumbles Recovered
3
0
Fumbles Touchdowns
1
10
Games Played
10
10-0
Fumbles-Lost
12-0
Returning
21
Kick Returns
16
444
Kick Return Yards
282
21.1
Yards Per Kick Return
17.6
63
Long Kick Return
33
0
Kick Return Touchdowns
0
7
Punt Returns
13
25
Punt Return Yards
175
3.6
Yards Per Punt Return
13.5
27
Long Punt Return
45
1
Punt Return Touchdowns
2
0
Punt Return Fair Catches
0
0
Kick Return Fumbles Lost
0
0
Punt Return Fumbles Lost
0
10
Team Games Played
10
7-25
Punt: Total
13-175
Kicking
9
Field Goal Made
15
12
Field Goal Attempts
18
75.0
Field Goal Percentage
83.3
54
Long Field Goal Made
57
0
Field Goal Attempts 1-19
0
3
Field Goal Attempts 20-29
1
5
Field Goal Attempts 30-39
7
3
Field Goal Attempts 40-49
4
1
Field Goal Attempts 50+
6
30
Extra Points Made
22
32
Extra Point Attempts
22
93.8
Extra Point Percentage
100.0
0
Field Goals Made 1-19
0
2
Field Goals Made 20-29
1
5
Field Goals Made 30-39
7
1
Field Goals Made 40-49
3
1
Field Goals Made 50+
4
57
Total Kicking Points
67
10
Team Games Played
10
37
Touchback Percentage
83
0.0
Average Kickoff Return Yards
0.0
0
Kickoff Return Yards
0
0
Kickoff Returns
0
0-0
Kickoffs: Total
0-0
9-12
FG: Good-Attempts
15-18
Punting
42
Punts
43
1,703
Punt Yards
1,939
58
Long Punt
64
40.5
Gross Average Punt Yards
45.1
40.5
Net Average Punt Yards
45.1
0
Punts Blocked
0
16
Punts Inside 20
18
1
Touchbacks
3
16
Fair Catches
4
13
Punt Returns
18
0
Punt Return Yards
0
0.0
Average Punt Return Yards
0.0
10
Team Games Played
10
42-1,703
Punt: Total Yards
43-1,939
Scoring
13
Rushing Touchdowns
12
24
Receiving Touchdowns
9
1
Return Touchdowns
2
38
Total Touchdowns
24
9
Field Goals
15
30
Kick Extra Points
22
3
Total Two Point Conversions
0
297
Total Points
213
29.7
Total Points Per Game
21.3