

Duquesne vs Air Force Live Score (5 Sep, 2026)
Score by Quarter
| Team | Q1 | Q2 | Q3 | Q4 | Final |
|---|---|---|---|---|---|
 Duquesne | 0 | 0 | 0 | 0 | 0 |
 Air Force | 7 | 13 | 7 | 7 | 34 |
Scoring Plays
Q1
8:06
8:06
K. Hodges run for 4 yds, for a TD (C. Cremascoli KICK)
Rushing Touchdown
0 – 7
Q2
12:17
12:17
L. Szarka run for 1 yd, for a TD (C. Cremascoli KICK)
Rushing Touchdown
0 – 14
Q2
9:33
9:33
C. Cremascoli 21 yd FG GOOD
Field Goal Good
0 – 17
Q2
4:04
4:04
C. Cremascoli 52 yd FG GOOD
Field Goal Good
0 – 20
Q3
1:21
1:21
L. Szarka run for 2 yds, for a TD (C. Cremascoli KICK)
Rushing Touchdown
0 – 27
Q4
8:19
8:19
E. Medders run for 4 yds, for a TD (C. Cremascoli KICK)
Rushing Touchdown
0 – 34
Game Leaders
DuquesneAir Force
 C. Camp QB
Passing Yards
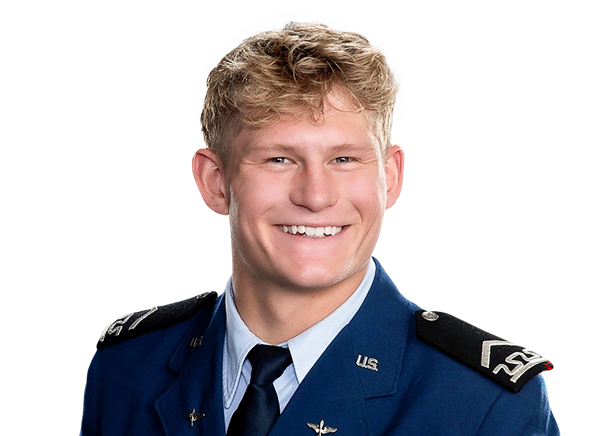 L. Szarka QB
 N. Davis RB
Rushing Yards
 R. Conti RB
 R. Petras WR
Receiving Yards
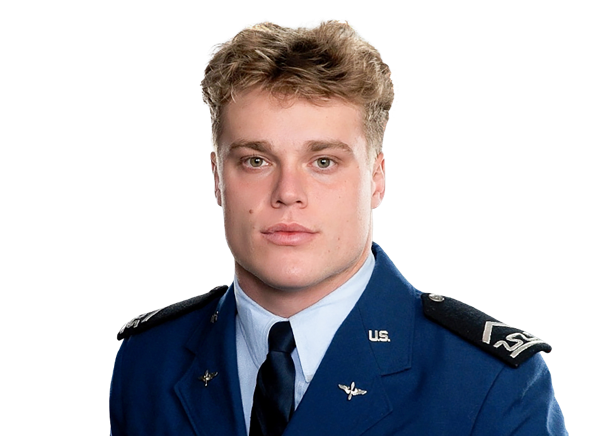 M. Long WR
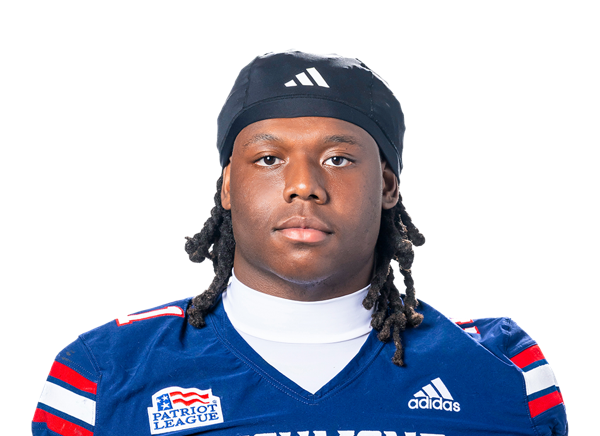 Z. Chambers LB
Tackles
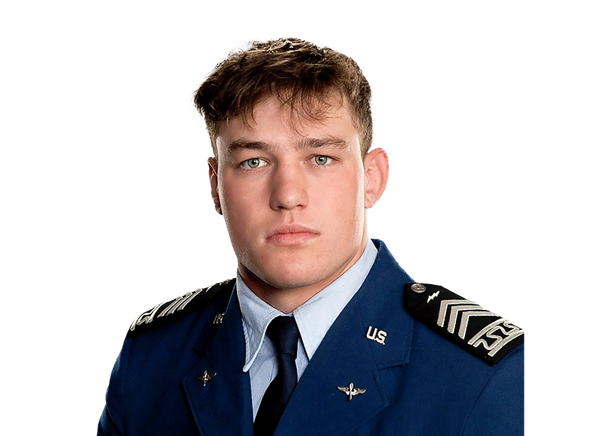 B. Fletcher LB
—
Sacks
B. Fletcher LBPlayer Box Score
Duquesne| Player | C/ATT | YDS | AVG | TD | INT |
|---|---|---|---|---|---|
| Carson Camp#18 | 7/18 | 42 | 2.3 | 0 | 2 |
 Logan Kushner#7 | 2/4 | 11 | 2.8 | 0 | 0 |
Air Force| Player | C/ATT | YDS | AVG | TD | INT |
|---|---|---|---|---|---|
| Liam Szarka#9 | 3/5 | 19 | 3.8 | 0 | 0 |
 Evan Medders#5 | 0/2 | 0 | 0.0 | 0 | 0 |
Duquesne| Player | CAR | YDS | AVG | TD | LONG |
|---|---|---|---|---|---|
| Ness Davis#32 | 11 | 32 | 2.9 | 0 | 12 |
 Dazhaun Hopkins | 5 | 15 | 3.0 | 0 | 8 |
| Carson Camp#18 | 3 | 4 | 1.3 | 0 | 11 |
 Shawn Solomon Jr#4 | 1 | 3 | 3.0 | 0 | 3 |
| Logan Kushner#7 | 1 | 0 | 0.0 | 0 | 0 |
Air Force| Player | CAR | YDS | AVG | TD | LONG |
|---|---|---|---|---|---|
| Rocco Conti#44 | 10 | 74 | 7.4 | 0 | 15 |
 Kemper Hodges#4 | 6 | 72 | 12.0 | 1 | 29 |
| Liam Szarka#9 | 13 | 51 | 3.9 | 2 | 8 |
| Evan Medders#5 | 7 | 48 | 6.9 | 1 | 13 |
 Owen Allen#2 | 10 | 38 | 3.8 | 0 | 14 |
| Matt Long#3 | 4 | 33 | 8.3 | 0 | 11 |
 Luke Rauh#24 | 2 | 19 | 9.5 | 0 | 17 |
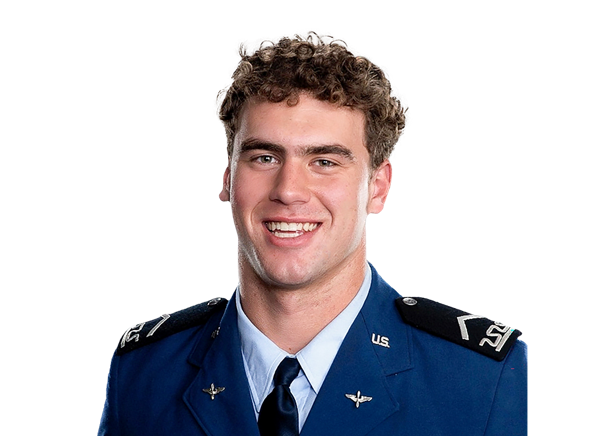 Gage LaDue#28 | 5 | 17 | 3.4 | 0 | 5 |
 Keegan Sack#20 | 3 | 13 | 4.3 | 0 | 7 |
 Mason Hayes#18 | 1 | 12 | 12.0 | 0 | 12 |
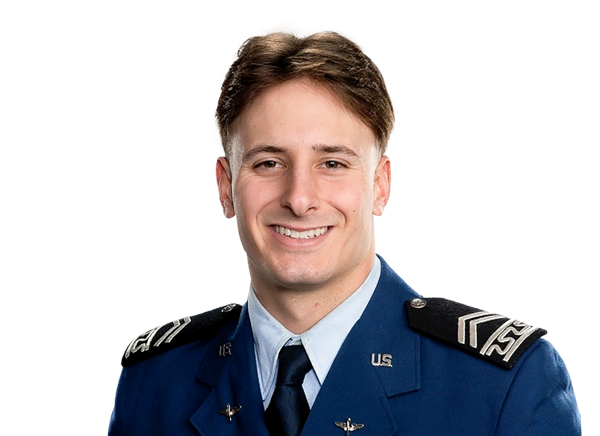 Owen Chambers | 1 | 9 | 9.0 | 0 | 9 |
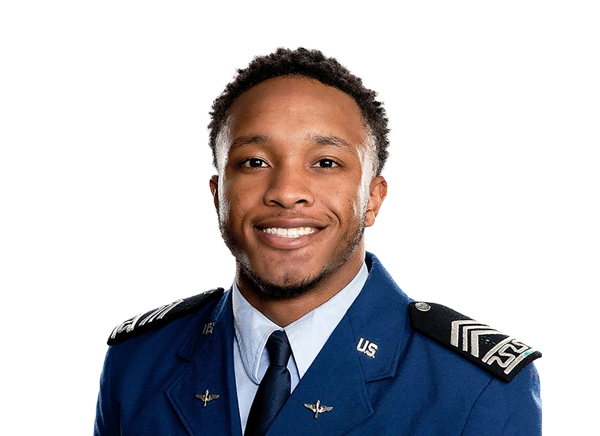 Jalen Rashad Turner#26 | 1 | 9 | 9.0 | 0 | 9 |
 Mason Lowe#33 | 1 | 7 | 7.0 | 0 | 7 |
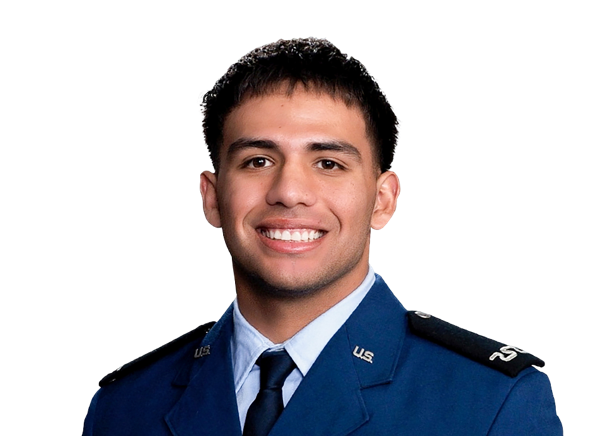 Oswaldo Morales#34 | 1 | 7 | 7.0 | 0 | 7 |
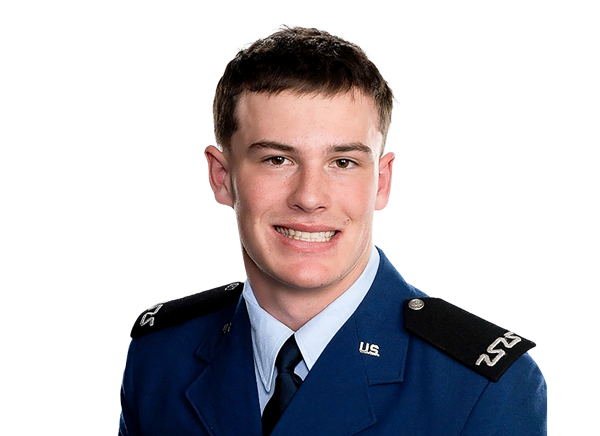 Price Davis#27 | 1 | 5 | 5.0 | 0 | 5 |
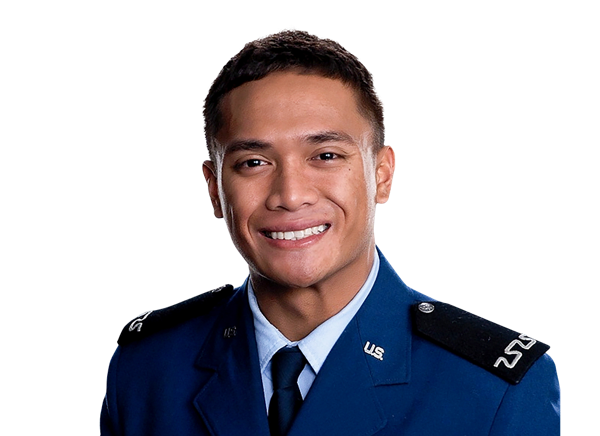 Sylas Maiava-Alaimalo#29 | 1 | 4 | 4.0 | 0 | 4 |
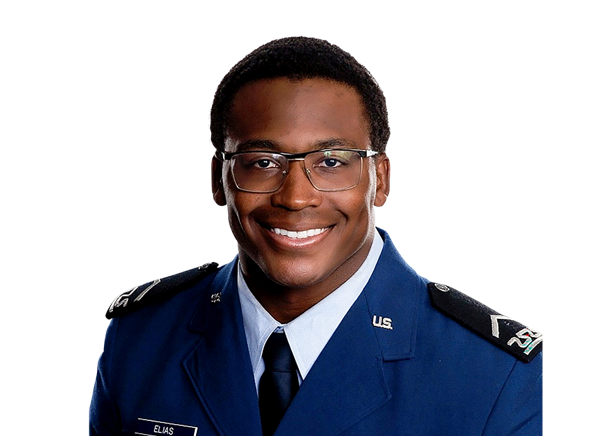 Omari Elias#45 | 2 | 4 | 2.0 | 0 | 2 |
Duquesne| Player | REC | YDS | AVG | TD | LONG |
|---|---|---|---|---|---|
| Ryan Petras#14 | 3 | 16 | 5.3 | 0 | 9 |
 Zae-Mear Correll#6 | 1 | 5 | 5.0 | 0 | 5 |
| Ness Davis#32 | 1 | 4 | 4.0 | 0 | 4 |
 Dewey Byrd | 1 | 1 | 1.0 | 0 | 1 |
Air Force| Player | REC | YDS | AVG | TD | LONG |
|---|---|---|---|---|---|
| Matt Long#3 | 1 | 18 | 18.0 | 0 | 18 |
| Mason Hayes#18 | 1 | 1 | 1.0 | 0 | 1 |
| Rocco Conti#44 | 1 | 0 | 0.0 | 0 | 0 |
Duquesne| Player | TOT | SOLO | SACKS | TFL | PD | QB HUR | TD |
|---|---|---|---|---|---|---|---|
| Zach Chambers#11 | 9 | 4 | 0 | 0 | 0 | 0 | 0 |
 Nico Pate#27 | 7 | 4 | 0 | 0 | 1 | 0 | 0 |
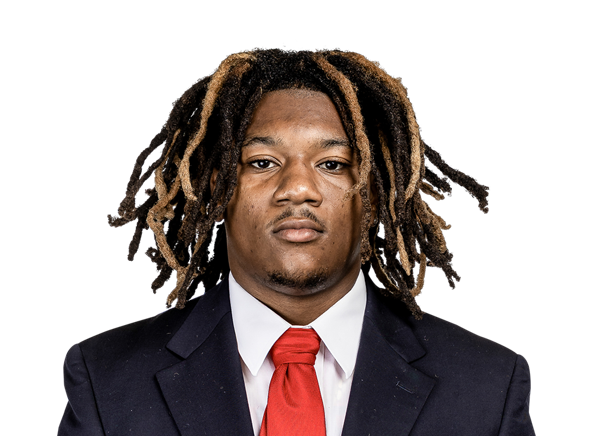 Jeff Banks#18 | 7 | 4 | 0 | 0 | 0 | 0 | 0 |
 Caleb Jones#21 | 6 | 1 | 0 | 0 | 1 | 0 | 0 |
 Luke Miller#55 | 5 | 3 | 0 | 0 | 0 | 0 | 0 |
 Carter Lance#52 | 4 | 3 | 0 | 0 | 0 | 0 | 0 |
 DJ Cerisier#2 | 3 | 2 | 0 | 0 | 0 | 0 | 0 |
 Charlie Stec#99 | 3 | 1 | 0 | 0 | 0 | 0 | 0 |
 AJ Forehand#12 | 3 | 0 | 0 | 0 | 0 | 0 | 0 |
 Dallas Harper#5 | 2 | 2 | 0 | 0 | 0 | 0 | 0 |
 Sage Thomas#23 | 2 | 2 | 0 | 0 | 0 | 0 | 0 |
 Isaiah Summerlin#19 | 2 | 1 | 0 | 0 | 0 | 0 | 0 |
 Zion Patillo#44 | 2 | 1 | 0 | 0 | 0 | 0 | 0 |
 Bernard Blakey#88 | 2 | 1 | 0 | 0 | 0 | 0 | 0 |
 Deshaun Harper#28 | 2 | 1 | 0 | 0 | 0 | 0 | 0 |
 Nick Collins Jr#25 | 2 | 1 | 0 | 0 | 0 | 0 | 0 |
 Kevin O'Donnell#30 | 2 | 0 | 0 | 0 | 0 | 0 | 0 |
| Carson Camp#18 | 1 | 1 | 0 | 0 | 0 | 0 | 0 |
 Adrian Ramirez#3 | 1 | 1 | 0 | 0 | 0 | 0 | 0 |
 Jacob Stephens#93 | 1 | 1 | 0 | 0 | 0 | 0 | 0 |
 Jordan Holmes#9 | 1 | 0 | 0 | 0 | 0 | 0 | 0 |
 Jackson Farrell#54 | 1 | 0 | 0 | 0 | 0 | 0 | 0 |
Air Force| Player | TOT | SOLO | SACKS | TFL | PD | QB HUR | TD |
|---|---|---|---|---|---|---|---|
| Blake Fletcher#6 | 7 | 2 | 1 | 1.5 | 1 | 0 | 0 |
 Cade Paterson#23 | 5 | 5 | 0 | 0 | 0 | 0 | 0 |
 Korey Johnson#2 | 3 | 2 | 0 | 0.5 | 1 | 0 | 0 |
 Alexander Perez#26 | 3 | 2 | 0 | 0 | 0 | 0 | 0 |
| Mikey Inweh | 2 | 2 | 0 | 0 | 0 | 0 | 0 |
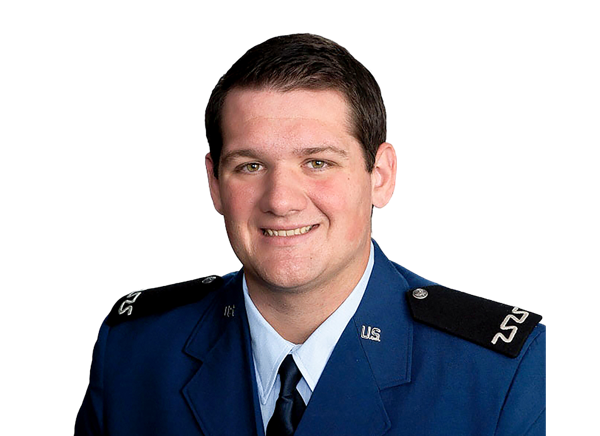 Andrew Tillett#93 | 2 | 1 | 0 | 0 | 0 | 1 | 0 |
 Ehimen Oyamendan#22 | 2 | 1 | 0 | 0 | 1 | 0 | 0 |
 Jayden Oquendo#99 | 2 | 0 | 0 | 0 | 0 | 0 | 0 |
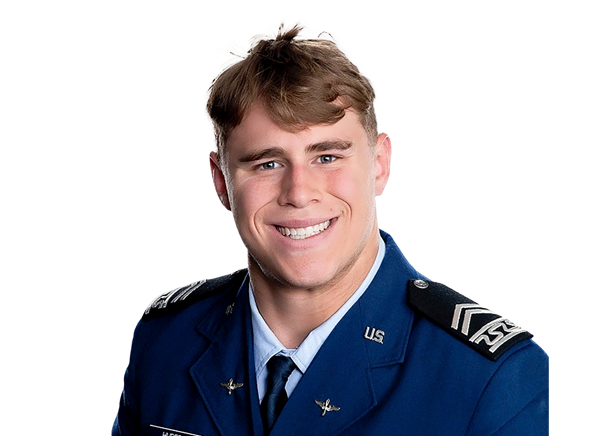 Isaac Hubert#30 | 1 | 1 | 0 | 0 | 0 | 1 | 0 |
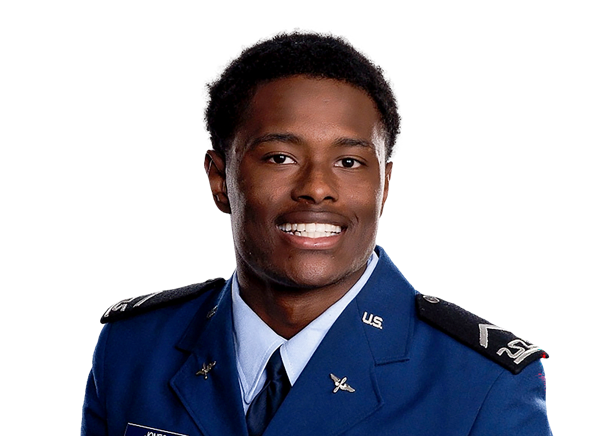 Roger Jones Jr.#5 | 1 | 1 | 0 | 0 | 0 | 0 | 0 |
 Chaz Barnett#59 | 1 | 1 | 0 | 0 | 0 | 1 | 0 |
 Dallas Daley#8 | 1 | 0 | 0 | 0 | 0 | 1 | 0 |
 Brody Whitson#42 | 1 | 0 | 0 | 0 | 0 | 0 | 0 |
 Nick Beckwith#7 | 1 | 0 | 0 | 0 | 1 | 0 | 0 |
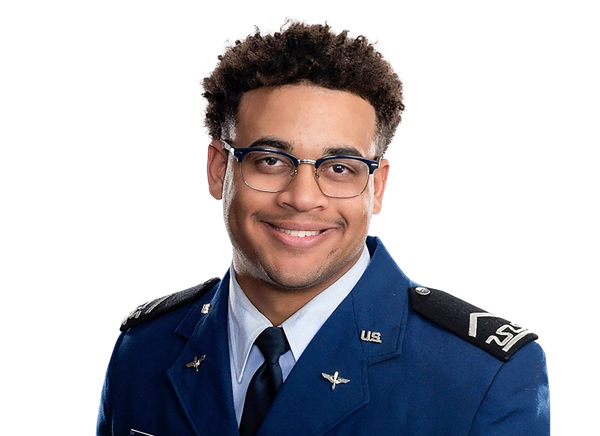 Jaylin Reese#45 | 1 | 0 | 0 | 0 | 0 | 0 | 0 |
 Grady Forsythe#50 | 1 | 0 | 0 | 0 | 0 | 0 | 0 |
 Muhammad Alcine#90 | 1 | 0 | 0 | 0 | 0 | 0 | 0 |
 Noah Daniels#95 | 1 | 0 | 0 | 0 | 0 | 0 | 0 |
Air Force| Player | FG | PCT | LONG | XP | PTS |
|---|---|---|---|---|---|
 Carter Cremascoli#90 | 2/2 | 100.0 | 52 | 4/4 | 10 |
Duquesne| Player | NO | YDS | AVG | TB | In 20 | LONG |
|---|---|---|---|---|---|---|
 Andrew Graham#81 | 4 | 179 | 44.8 | 1 | 1 | 59 |
Air Force| Player | NO | YDS | AVG | TB | In 20 | LONG |
|---|---|---|---|---|---|---|
 Will Duncan#94 | 2 | 113 | 56.5 | 0 | 1 | 62 |
Air Force| Player | NO | YDS | AVG | LONG | TD |
|---|---|---|---|---|---|
| Matt Long#3 | 1 | 0 | 0.0 | 7 | 0 |
Air Force| Player | INT | YDS | TD |
|---|---|---|---|
 Max Mustell#36 | 1 | 26 | 0 |
| Korey Johnson#2 | 1 | 0 | 0 |
Drive Summary
AFA
Touchdown
75
DUQ
Punt
16
AFA
Touchdown
80
DUQ
Interception
7
AFA
Field Goal
6
DUQ
Punt
4
AFA
Field Goal
37
DUQ
Punt
6
AFA
Punt
8
DUQ
End Of Half
36
DUQ
Punt
8
AFA
Punt
0
DUQ
Punt
12
AFA
Touchdown
84
DUQ
Punt
12
AFA
Touchdown
75
DUQ
Punt
16
AFA
End Of Quarter
60
Injury Report
No current injury report is available for this matchup.
Head-to-Head
Historical meetings are not available for this matchup.
Game Information
StageWeek 1
Season2026
KickoffSat, Sep 5, 1:00 pm
VenueFalcon Stadium
LocationUSAF Academy, CO
SurfaceArtificial Turf
BroadcastMW+
Division Standings
FCS — Northeast Conference
| Team | W | L | T | Pct | PF | PA | Home | Away | Strk |
|---|---|---|---|---|---|---|---|---|---|
 Robert Morris | 0 | 2 | 0 | 0.000 | 38 | 76 | 0-0 | 0-2 | L2 |
 Stonehill | 0 | 2 | 0 | 0.000 | 21 | 71 | 0-0 | 0-2 | L2 |
 Central Connecticut | 0 | 1 | 0 | 0.000 | 10 | 63 | 0-0 | 0-1 | L1 |
| Duquesne | 0 | 2 | 0 | 0.000 | 7 | 82 | 0-0 | 0-2 | L2 |
 Mercyhurst | 0 | 3 | 0 | 0.000 | 28 | 173 | 0-0 | 0-3 | L3 |
 Long Island University | 0 | 2 | 0 | 0.000 | 9 | 71 | 0-0 | 0-2 | L2 |
 New Haven | 0 | 0 | 0 | .000 | 0 | 0 | — | — | — |
 Wagner | 0 | 2 | 0 | 0.000 | 10 | 136 | 0-0 | 0-2 | L2 |
FBS — Mountain West Conference
| Team | W | L | T | Pct | PF | PA | Home | Away | Strk |
|---|---|---|---|---|---|---|---|---|---|
| Air Force | 6 | 2 | 0 | 0.750 | 234 | 172 | 4-1 | 2-1 | W1 |
 North Dakota State | 7 | 2 | 0 | 0.778 | 253 | 107 | 5-0 | 2-2 | W1 |
 San José State | 4 | 5 | 0 | 0.444 | 179 | 201 | 1-3 | 3-2 | L2 |
 Nevada | 3 | 5 | 0 | 0.375 | 184 | 181 | 2-2 | 1-3 | L1 |
 New Mexico | 7 | 1 | 0 | 0.875 | 280 | 95 | 4-0 | 3-1 | W5 |
 Northern Illinois | 0 | 8 | 0 | 0.000 | 130 | 301 | 0-3 | 0-5 | L8 |
 Wyoming | 5 | 3 | 0 | 0.625 | 156 | 160 | 4-0 | 1-3 | W3 |
 Hawai'i | 2 | 6 | 0 | 0.250 | 166 | 196 | 1-3 | 1-3 | W1 |
 UNLV | 5 | 3 | 0 | 0.625 | 200 | 190 | 3-1 | 2-2 | W1 |
 UTEP | 1 | 7 | 0 | 0.125 | 113 | 292 | 1-3 | 0-4 | L6 |
Duquesne
2nd in NEC
VS
Air Force
5th in Mountain West
Quarterbacks & Specialists
#18
Carson Camp
#81
Andrew Graham
#7
Logan Kushner
Receivers & Backs
#13
Dewey Byrd
#6
Zae-Mear Correll
#32
Ness Davis
Dazhaun Hopkins
#14
Ryan Petras
#4
Shawn Solomon Jr
Defensive Line & Linebackers
#88
Bernard Blakey
#11
Zach Chambers
#54
Jackson Farrell
#28
Deshaun Harper
#52
Carter Lance
#55
Luke Miller
#30
Kevin O'Donnell
#27
Nico Pate
#44
Zion Patillo
#3
Adrian Ramirez
#99
Charlie Stec
#93
Jacob Stephens
#23
Sage Thomas
Defensive Backs
#18
Jeff Banks
#2
DJ Cerisier
#25
Nick Collins Jr
#12
AJ Forehand
#5
Dallas Harper
#9
Jordan Holmes
#21
Caleb Jones
#19
Isaiah Summerlin
Quarterbacks & Specialists
#94
Will Duncan
#4
Kemper Hodges
#5
Evan Medders
#9
Liam Szarka
Receivers & Backs
#2
Owen Allen
Owen Chambers
#44
Rocco Conti
#27
Price Davis
#45
Omari Elias
#18
Mason Hayes
#28
Gage LaDue
#3
Matt Long
#33
Mason Lowe
#29
Sylas Maiava-Alaimalo
#34
Oswaldo Morales
#24
Luke Rauh
#20
Keegan Sack
#26
Jalen Rashad Turner
Defensive Line & Linebackers
#90
Muhammad Alcine
#59
Chaz Barnett
#8
Dallas Daley
#95
Noah Daniels
#6
Blake Fletcher
#50
Grady Forsythe
#30
Isaac Hubert
#99
Jayden Oquendo
#45
Jaylin Reese
#93
Andrew Tillett
#42
Brody Whitson
Defensive Backs
#7
Nick Beckwith
#15
Mikey Inweh
#2
Korey Johnson
#5
Roger Jones Jr.
#36
Max Mustell
#22
Ehimen Oyamendan
#23
Cade Paterson
#26
Alexander Perez
Other
#90
Carter Cremascoli
Duquesne
2nd in NEC
VS
Air Force
5th in Mountain West
Passing
54.1
Completion Percentage
47.8
99
Completions
33
5.50
Interception Percentage
5.80
10
Interceptions
4
56
Longest Pass
35
1,376
Net Passing Yards
473
172.0
Net Passing Yards Per Game
59.1
183
Passing Attempts
69
5.50
Passing Touchdown %
5.80
10
Passing Touchdowns
4
124.1
Passer Rating
113.3
9
Total Sacks
6
86
Sack Yards Lost
36
7.5
Yards Per Pass Attempt
6.9
1,376
Passing Yards
473
0
Passing Fumbles Lost
0
8
Team Games Played
8
319.5
Yards Per Game
400.1
24.3
Total Points Per Game
29.3
194
Total Points
234
26
Total Touchdowns
30
172.0
Passing Yards Per Game
59.1
99-183
Comp-Att
33-69
9-86
Sacks-Yards Lost
6-36
Rushing
286
Rushing Attempts
517
1,180
Rushing Yards
2,728
4.1
Yards Per Rush Attempt
5.3
54
Long Rushing
62
0
20+ Yard Rushing Plays
0
14
Rushing Touchdowns
25
147.5
Rushing Yards Per Game
341.0
0
Rushing Fumbles
0
0
Rushing Fumbles Lost
0
62
Rushing 1st downs
154
8
Team Games Played
8
2,556
Total Yards
3,201
478
Total Offensive Plays
592
24.3
Total Points Per Game
29.3
194
Total Points
234
26
Total Touchdowns
30
Receiving
99
Receptions
33
0
Receiving Targets
0
1,376
Receiving Yards
473
1,376
Receiving Yards
473
10
Receiving Touchdowns
4
56
Long Reception
35
0
20+ Yard Receiving Plays
0
172.0
Receiving Yards Per Game
59.1
0
Receiving Fumbles
0
0
Receiving Fumbles Lost
0
59
Receiving Yards After Catch
139
58
Receiving First Downs
24
8
Team Games Played
8
13.9
Yards Per Reception
14.3
24.3
Total Points Per Game
29.3
194
Total Points
234
26
Total Touchdowns
30
Miscellaneous
137
Total 1st downs
188
62
Rushing 1st downs
154
58
Passing 1st downs
24
17
1st downs by penalty
10
37
Third Down Conversions
61
97
Third Down Attempts
118
38.14
3rd down %
51.69
6
Fourth Down Conversions
20
7
First Downs Attempts
24
85.71
4th down %
83.33
55
Total Penalties
41
451
Total Penalty Yards
369
14129
Possession Time Seconds
17629
0.00
Red Zone Field Goal Percentage
0.00
0.00
Red Zone Scoring Percentage
0.00
0.00
Red Zone Efficiency Percentage
0.00
0.00
Red Zone Touchdown Percentage
0.00
16
Total Takeaways
6
14
Total Giveaways
7
2
Turnover Ratio
-1
0
Fumbles Lost
0
37-97
3rd down efficiency
61-118
6-7
4th down efficiency
20-24
55-451
Total-Yards
41-369
Defense
307
Solo Tackles
196
236
Assist Tackles
192
543
Total Tackles
388
16
Sacks
12
110
Sack Yards
78
68
Stuffs
45
29
Passes Defended
23
23.8
Average Interception Yards
23.2
55
Long Interception
85
0
Miscellaneous Touchdowns
0
1
Kicks Blocked
0
39
Tackles For Loss
20
8
Team Games Played
8
Defensive Interceptions
5
Interceptions
5
119
Interception Yards
116
1
Interception Touchdowns
1
5-119
INT: Total
5-116
General
13
Fumbles
3
6
Forced Fumbles
3
6
Fumbles Recovered
2
1
Fumbles Touchdowns
0
8
Games Played
8
13-0
Fumbles-Lost
3-0
Returning
16
Kick Returns
2
265
Kick Return Yards
39
16.6
Yards Per Kick Return
19.5
29
Long Kick Return
21
0
Kick Return Touchdowns
0
8
Punt Returns
1
68
Punt Return Yards
0
8.5
Yards Per Punt Return
0.0
16
Long Punt Return
0
0
Punt Return Touchdowns
0
0
Punt Return Fair Catches
0
0
Kick Return Fumbles Lost
0
0
Punt Return Fumbles Lost
0
8
Team Games Played
8
8-68
Punt: Total
1-0
Kicking
4
Field Goal Made
9
6
Field Goal Attempts
10
66.7
Field Goal Percentage
90.0
49
Long Field Goal Made
52
0
Field Goal Attempts 1-19
0
4
Field Goal Attempts 20-29
3
0
Field Goal Attempts 30-39
4
2
Field Goal Attempts 40-49
2
0
Field Goal Attempts 50+
1
24
Extra Points Made
25
26
Extra Point Attempts
26
92.3
Extra Point Percentage
96.2
0
Field Goals Made 1-19
0
2
Field Goals Made 20-29
2
0
Field Goals Made 30-39
4
2
Field Goals Made 40-49
2
0
Field Goals Made 50+
1
36
Total Kicking Points
52
8
Team Games Played
8
26
Touchback Percentage
98
0.0
Average Kickoff Return Yards
0.0
0
Kickoff Return Yards
0
0
Kickoff Returns
0
0-0
Kickoffs: Total
0-0
4-6
FG: Good-Attempts
9-10
Punting
41
Punts
18
1,636
Punt Yards
861
59
Long Punt
68
39.9
Gross Average Punt Yards
47.8
39.9
Net Average Punt Yards
47.8
0
Punts Blocked
0
12
Punts Inside 20
8
4
Touchbacks
2
11
Fair Catches
3
15
Punt Returns
5
0
Punt Return Yards
0
0.0
Average Punt Return Yards
0.0
8
Team Games Played
8
41-1,636
Punt: Total Yards
18-861
Scoring
14
Rushing Touchdowns
25
10
Receiving Touchdowns
4
0
Return Touchdowns
0
25
Total Touchdowns
29
4
Field Goals
9
24
Kick Extra Points
25
0
Total Two Point Conversions
1
194
Total Points
234
24.3
Total Points Per Game
29.3