

East Carolina vs Old Dominion Live Score (19 Sep, 2026)
Score by Quarter
| Team | Q1 | Q2 | Q3 | Q4 | Final |
|---|---|---|---|---|---|
 East Carolina |
7 | 3 | 7 | 3 | 20 |
 Old Dominion |
0 | 17 | 0 | 0 | 17 |
Scoring Plays
Q1
6:44
6:44
J. Dickerson pass to J. Hamilton for 25 yds, for a TD (N. Perez KICK)
Passing Touchdown
7 – 0
Q2
9:17
9:17
N. Eichner 38 yd FG GOOD
Field Goal Good
7 – 3
Q2
8:12
8:12
E. Williams pass to D. Iles for 23 yds, for a TD, K. Hamlett fumbled, forced by J. Watts, recovered by D. Iles, return for 23 yds for a TD (N. Eichn
Fumble Return Touchdown
7 – 10
Q2
4:14
4:14
Q. Henicle run for 18 yds, for a TD (N. Eichner KICK)
Rushing Touchdown
7 – 17
Q2
0:02
0:02
N. Perez 36 yd FG GOOD
Field Goal Good
10 – 17
Q3
12:36
12:36
Q. Henicle pass intercepted, A. Duncanson return for 67 yds, for a TD (N. Perez KICK)
Interception Return Touchdown
17 – 17
Q4
9:39
9:39
N. Perez 24 yd FG GOOD
Field Goal Good
20 – 17
Game Leaders
East CarolinaOld Dominion
 M. Griffis QB
Passing Yards
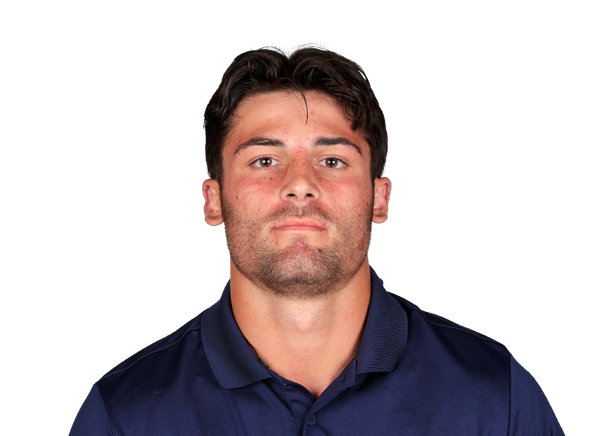 Q. Henicle QB
 T. Engleman Jr. RB
Rushing Yards
 D. Roche RB
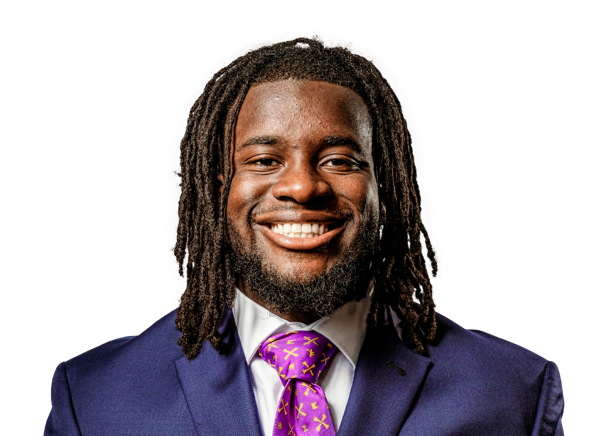
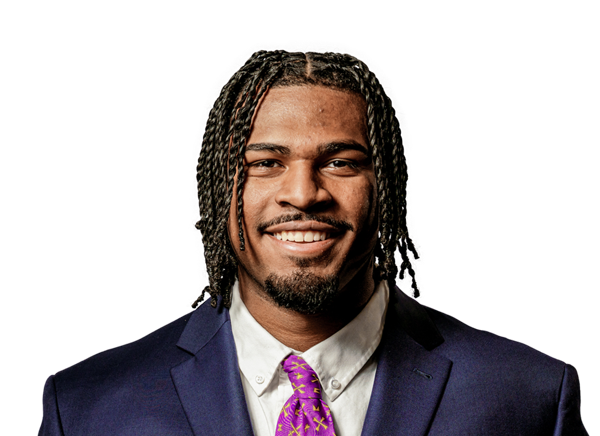 I. Smith Flores TE
Receiving Yards
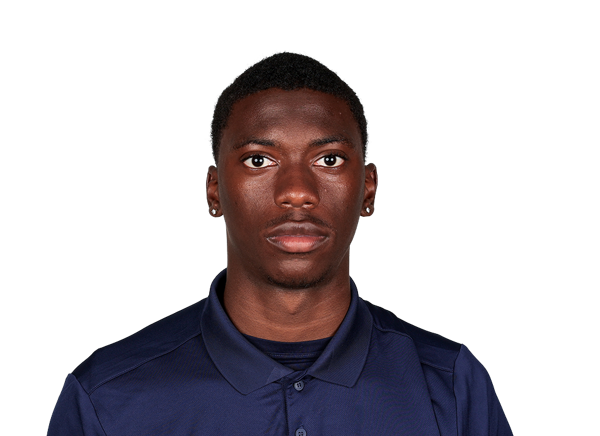 Z. Blackmon WR
 J. Davis LB
Tackles
 M. Thompson LB
—
Sacks
M. Thompson LBPlayer Box Score
East Carolina| Player | C/ATT | YDS | AVG | TD | INT |
|---|---|---|---|---|---|
| Mitch Griffis#12 | 4/12 | 58 | 4.8 | 0 | 0 |
 Jason Dickerson#24 | 1/1 | 25 | 25.0 | 1 | 0 |
 Emory Williams#9 | 5/7 | 22 | 3.1 | 0 | 0 |
 Kyler Pearson | 1/1 | -2 | -2.0 | 0 | 0 |
Old Dominion| Player | C/ATT | YDS | AVG | TD | INT |
|---|---|---|---|---|---|
| Quinn Henicle#10 | 8/20 | 94 | 4.7 | 0 | 1 |
East Carolina| Player | CAR | YDS | AVG | TD | LONG |
|---|---|---|---|---|---|
| TJ Engleman Jr.#4 | 16 | 99 | 6.2 | 0 | 40 |
 Ashton Gray#3 | 10 | 36 | 3.6 | 0 | 7 |
| Mitch Griffis#12 | 6 | 22 | 3.7 | 0 | 13 |
 Michael Allen#21 | 8 | 21 | 2.6 | 0 | 8 |
| Emory Williams#9 | 5 | -1 | -0.2 | 0 | 9 |
 Team | 2 | -4 | -2.0 | 0 | 0 |
Old Dominion| Player | CAR | YDS | AVG | TD | LONG |
|---|---|---|---|---|---|
| Devin Roche#3 | 18 | 102 | 5.7 | 0 | 41 |
| Quinn Henicle#10 | 16 | 73 | 4.6 | 1 | 19 |
 Trey Hall#6 | 4 | 17 | 4.3 | 0 | 8 |
 Maurki James#5 | 4 | 9 | 2.3 | 0 | 10 |
| Team | 2 | -21 | -10.5 | 0 | -19 |
East Carolina| Player | REC | YDS | AVG | TD | LONG |
|---|---|---|---|---|---|
 Dillon Lorick#14 | 1 | 27 | 27.0 | 0 | 27 |
| Ismael Smith Flores#8 | 3 | 27 | 9.0 | 0 | 15 |
 Ja'Keith Hamilton#15 | 1 | 25 | 25.0 | 1 | 25 |
 Ray Ray Joseph Jr.#1 | 2 | 24 | 12.0 | 0 | 12 |
 Kanen Hamlett#6 | 1 | 1 | 1.0 | 0 | 1 |
| Jason Dickerson#24 | 1 | 0 | 0.0 | 0 | 15 |
| Michael Allen#21 | 2 | -1 | -0.5 | 0 | 1 |
Old Dominion| Player | REC | YDS | AVG | TD | LONG |
|---|---|---|---|---|---|
| Zialis Blackmon#14 | 1 | 42 | 42.0 | 0 | 42 |
| Devin Roche#3 | 1 | 25 | 25.0 | 0 | 25 |
 Josh Rodriguez#8 | 3 | 11 | 3.7 | 0 | 5 |
 Kendall Harris#7 | 1 | 10 | 10.0 | 0 | 10 |
 JJ Harrell#1 | 1 | 4 | 4.0 | 0 | 4 |
 Leon Haughton Jr.#86 | 1 | 2 | 2.0 | 0 | 2 |
East Carolina| Player | TOT | SOLO | SACKS | TFL | PD | QB HUR | TD |
|---|---|---|---|---|---|---|---|
 Zyeir Gamble#3 | 8 | 3 | 0 | 0.5 | 0 | 0 | 0 |
| Julien Davis#42 | 8 | 2 | 0 | 1.5 | 0 | 0 | 0 |
 Jackson Barker#1 | 7 | 3 | 0 | 0 | 0 | 0 | 0 |
 Kieran Davis#5 | 7 | 2 | 0 | 2 | 0 | 0 | 0 |
 Kevon Merrell Jr.#4 | 7 | 2 | 0 | 0 | 0 | 0 | 0 |
 DJ Johnson Jr.#11 | 6 | 0 | 0 | 0 | 0 | 2 | 0 |
 Jasiyah Robinson | 4 | 2 | 0 | 0 | 0 | 2 | 0 |
 DeMarius Hines#6 | 4 | 2 | 0 | 0 | 0 | 0 | 0 |
 Kamaurri McKinley#8 | 4 | 1 | 0 | 0 | 0 | 0 | 0 |
 Cade Law#20 | 4 | 0 | 0 | 0 | 0 | 0 | 0 |
 Torin Brazell#98 | 4 | 0 | 0 | 1 | 0 | 2 | 0 |
 Myles Pollard#12 | 3 | 1 | 0 | 0.5 | 0 | 0 | 0 |
 Crews Law#10 | 3 | 0 | 0 | 0.5 | 0 | 0 | 0 |
 Ayden Duncanson#13 | 2 | 0 | 0 | 0 | 0 | 0 | 1 |
 Christian Peterson#15 | 2 | 0 | 0 | 0 | 0 | 0 | 0 |
 Rion Roseborough#88 | 2 | 0 | 0 | 0 | 0 | 0 | 0 |
| Ashton Levells-Mitchell#7 | 1 | 1 | 0 | 0 | 1 | 0 | 0 |
 LJ Porter#32 | 1 | 1 | 0 | 0 | 0 | 0 | 0 |
| Kanen Hamlett#6 | 1 | 0 | 0 | 0 | 0 | 0 | 0 |
 Blake Shirley#53 | 1 | 0 | 0 | 0 | 0 | 0 | 0 |
 Adam Cole#34 | 1 | 0 | 0 | 0 | 0 | 0 | 0 |
 Stephen Collier#25 | 1 | 0 | 0 | 0 | 0 | 0 | 0 |
 Angelo Ross#22 | 1 | 0 | 0 | 0 | 1 | 0 | 0 |
 Miles Parker#91 | 1 | 0 | 0 | 0 | 0 | 0 | 0 |
 Evan Powell#50 | 1 | 0 | 0 | 0 | 0 | 0 | 0 |
Old Dominion| Player | TOT | SOLO | SACKS | TFL | PD | QB HUR | TD |
|---|---|---|---|---|---|---|---|
| Mario Thompson | 9 | 3 | 1 | 1.5 | 0 | 2 | 0 |
 Zion Frink#1 | 8 | 5 | 0 | 1 | 1 | 0 | 0 |
 Jackson Forrest#18 | 8 | 1 | 1 | 2.5 | 0 | 1 | 0 |
 Lucas Struck#19 | 8 | 1 | 0 | 0 | 0 | 0 | 0 |
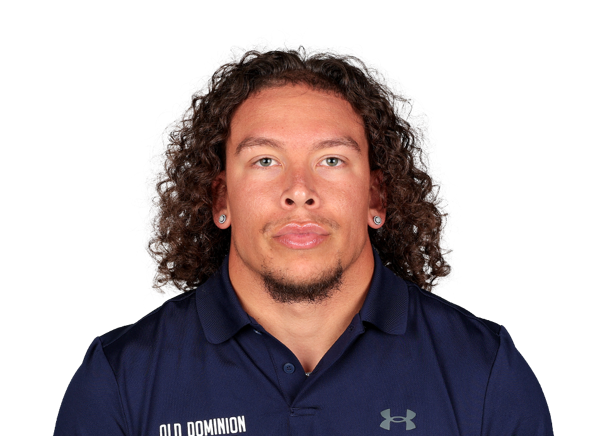 Mario Easterly#3 | 7 | 2 | 0 | 0 | 0 | 0 | 0 |
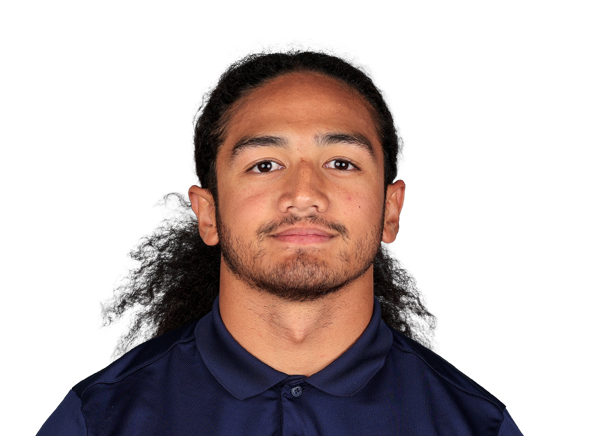 Koa Naotala#10 | 5 | 1 | 0 | 0 | 0 | 0 | 0 |
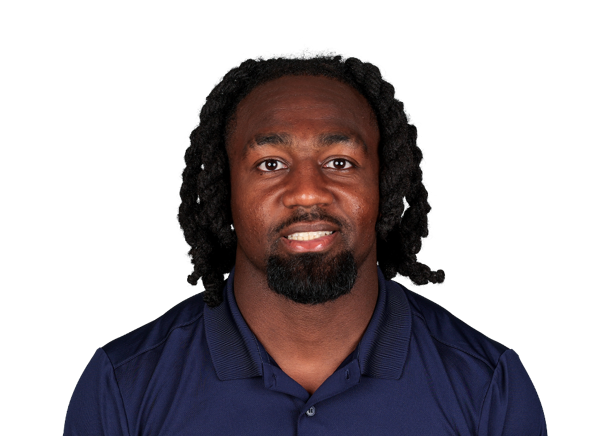 Montrell Chapman#6 | 4 | 1 | 0 | 0 | 0 | 0 | 0 |
 DeAndre Lynch#9 | 4 | 0 | 0 | 0 | 0 | 0 | 0 |
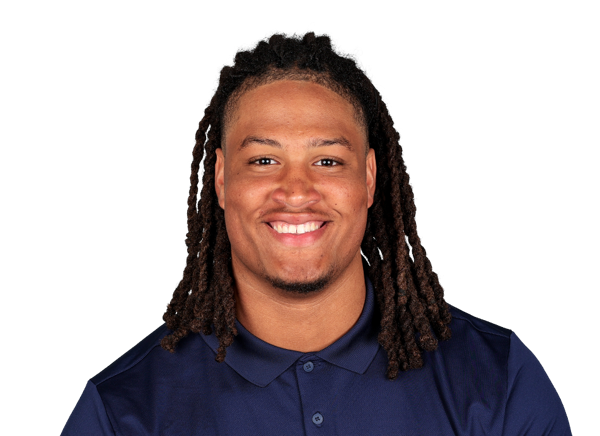 Ahmaad Foster#95 | 4 | 0 | 0 | 1 | 0 | 0 | 0 |
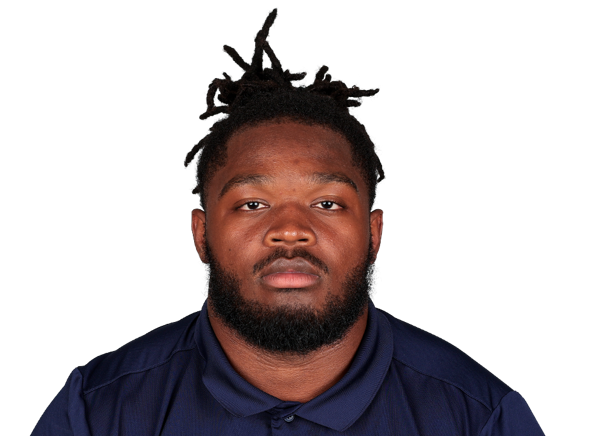 Chris Forbes#90 | 3 | 1 | 0 | 0 | 0 | 0 | 0 |
 Greg Johnson#8 | 3 | 1 | 0 | 0 | 0 | 0 | 0 |
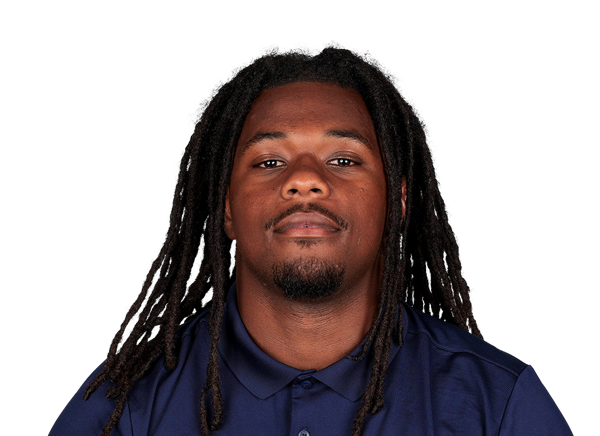 Javen Gibson#4 | 3 | 0 | 0 | 0 | 0 | 0 | 0 |
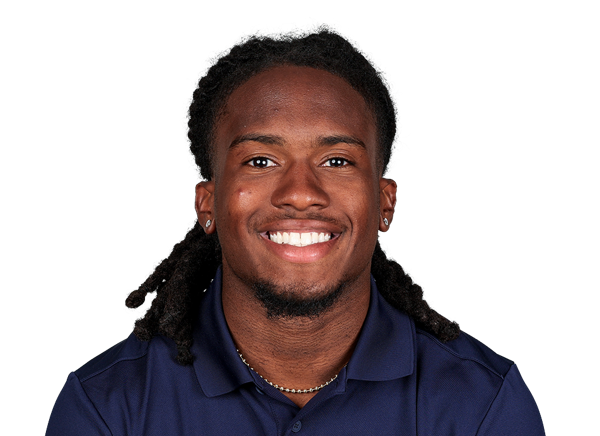 Brandon Crutchfield#5 | 2 | 2 | 0 | 0 | 0 | 0 | 0 |
 Bucci Farmer#44 | 2 | 0 | 0 | 0 | 0 | 0 | 0 |
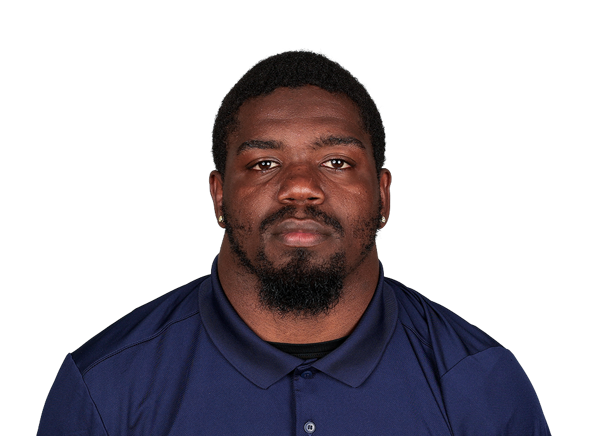 Ja'Mez Drummer#32 | 2 | 0 | 0 | 0 | 0 | 0 | 0 |
 Hunter Malecki#40 | 2 | 0 | 0 | 0 | 0 | 0 | 0 |
 Justin Watts#26 | 1 | 1 | 0 | 0 | 0 | 0 | 0 |
 Lorenzo McFadden-Pressley#94 | 1 | 0 | 0 | 0 | 0 | 0 | 0 |
 Kollin Collier#11 | 1 | 0 | 0 | 0 | 0 | 0 | 0 |
 Malachi Harris#88 | 1 | 0 | 0 | 0 | 0 | 0 | 0 |
 Asher Horn#12 | 1 | 0 | 0 | 0 | 0 | 0 | 0 |
 Daevon Iles#2 | 0 | 0 | 0 | 0 | 1 | 0 | 1 |
East Carolina| Player | FUM | LOST | REC |
|---|---|---|---|
| Kanen Hamlett#6 | 1 | 1 | 0 |
| Emory Williams#9 | 1 | 0 | 0 |
| Miles Parker#91 | 0 | 0 | 1 |
Old Dominion| Player | FUM | LOST | REC |
|---|---|---|---|
| Devin Roche#3 | 2 | 1 | 0 |
| Team | 1 | 0 | 0 |
| Quinn Henicle#10 | 1 | 0 | 0 |
| Daevon Iles#2 | 0 | 0 | 1 |
East Carolina| Player | FG | PCT | LONG | XP | PTS |
|---|---|---|---|---|---|
 Noah Perez#43 | 2/2 | 100.0 | 36 | 2/2 | 8 |
Old Dominion| Player | FG | PCT | LONG | XP | PTS |
|---|---|---|---|---|---|
 Nathanial Eichner#93 | 1/1 | 100.0 | 38 | 2/2 | 5 |
East Carolina| Player | NO | YDS | AVG | TB | In 20 | LONG |
|---|---|---|---|---|---|---|
 Tomas O'Halloran#48 | 6 | 289 | 48.2 | 0 | 2 | 55 |
Old Dominion| Player | NO | YDS | AVG | TB | In 20 | LONG |
|---|---|---|---|---|---|---|
 Ian Brandt#96 | 7 | 250 | 35.7 | 0 | 1 | 41 |
Old Dominion| Player | NO | YDS | AVG | LONG | TD |
|---|---|---|---|---|---|
| Zion Frink#1 | 2 | 34 | 17.0 | 18 | 0 |
East Carolina| Player | NO | YDS | AVG | LONG | TD |
|---|---|---|---|---|---|
| Kyler Pearson | 1 | 7 | 7.0 | 7 | 0 |
Old Dominion| Player | NO | YDS | AVG | LONG | TD |
|---|---|---|---|---|---|
| Devin Roche#3 | 3 | 38 | 12.7 | 38 | 0 |
East Carolina| Player | INT | YDS | TD |
|---|---|---|---|
| Ayden Duncanson#13 | 1 | 67 | 1 |
Drive Summary
ECU
Punt
4
ODU
Punt
32
ECU
Punt
13
ODU
Fumble
12
ECU
Touchdown
28
ODU
Punt
9
ECU
Downs
33
ODU
Punt
9
ECU
Punt
26
ODU
Field Goal
60
ECU
Fumble Return Touchdown
-25
ECU
Punt
-7
ODU
Touchdown
35
ECU
Punt
16
ODU
Punt
21
ECU
Field Goal
56
ODU
End Of Half
-2
ODU
Interception Touchdown
37
ODU
Punt
13
ECU
Punt
-3
ODU
Fumble
56
ECU
Field Goal
77
ODU
Punt
3
ECU
Downs
40
ODU
Punt
4
ECU
End Of Quarter
25
Injury Report
No current injury report is available for this matchup.
Head-to-Head
Historical meetings are not available for this matchup.
Game Information
StageWeek 3
Season2026
KickoffSat, Sep 19, 6:00 pm
VenueS.B. Ballard Stadium
LocationNorfolk, VA
SurfaceArtificial Turf
BroadcastESPN+
Division Standings
FBS — American Conference
| Team | W | L | T | Pct | PF | PA | Home | Away | Strk |
|---|---|---|---|---|---|---|---|---|---|
 South Florida | 6 | 4 | 0 | 0.600 | 274 | 188 | 4-2 | 2-2 | L2 |
 Florida Atlantic | 6 | 4 | 0 | 0.600 | 383 | 353 | 5-0 | 1-4 | L1 |
 Tulsa | 6 | 4 | 0 | 0.600 | 336 | 226 | 3-2 | 3-2 | W2 |
 UTSA | 7 | 2 | 0 | 0.778 | 297 | 268 | 4-0 | 3-2 | L1 |
 Memphis | 8 | 2 | 0 | 0.800 | 390 | 253 | 5-0 | 3-2 | W3 |
 Rice | 2 | 9 | 0 | 0.182 | 239 | 353 | 1-4 | 1-5 | W1 |
 UAB | 6 | 4 | 0 | 0.600 | 232 | 224 | 5-0 | 1-4 | W2 |
| East Carolina | 6 | 4 | 0 | 0.600 | 229 | 226 | 4-1 | 2-3 | W3 |
 North Texas | 7 | 2 | 0 | 0.778 | 402 | 278 | 5-0 | 2-2 | W6 |
 Temple | 2 | 9 | 0 | 0.182 | 261 | 322 | 1-6 | 1-3 | L6 |
 Tulane | 5 | 5 | 0 | 0.500 | 210 | 280 | 3-2 | 2-3 | W1 |
 Charlotte | 1 | 9 | 0 | 0.100 | 193 | 362 | 0-5 | 1-4 | L3 |
 Army | 5 | 4 | 0 | 0.556 | 290 | 228 | 3-2 | 2-2 | L2 |
 Navy | 3 | 6 | 0 | 0.333 | 263 | 274 | 3-2 | 0-4 | W1 |
East Carolina
VS
Old Dominion
14th in Sun Belt
Quarterbacks & Specialists
#12
Mitch Griffis
#48
Tomas O'Halloran
#53
Blake Shirley
#9
Emory Williams
Receivers & Backs
#21
Michael Allen
#25
Stephen Collier
#24
Jason Dickerson
#4
TJ Engleman Jr.
#3
Ashton Gray
#15
Ja'Keith Hamilton
#6
Kanen Hamlett
#1
Ray Ray Joseph Jr.
#14
Dillon Lorick
Kyler Pearson
#8
Ismael Smith Flores
Defensive Line & Linebackers
#1
Jackson Barker
#98
Torin Brazell
#42
Julien Davis
#5
Kieran Davis
#11
DJ Johnson Jr.
#20
Cade Law
#10
Crews Law
#91
Miles Parker
#32
LJ Porter
#50
Evan Powell
Jasiyah Robinson
#88
Rion Roseborough
Defensive Backs
#34
Adam Cole
#13
Ayden Duncanson
#3
Zyeir Gamble
#6
DeMarius Hines
#7
Ashton Levells-Mitchell
#8
Kamaurri McKinley
#4
Kevon Merrell Jr.
#15
Christian Peterson
#12
Myles Pollard
#22
Angelo Ross
Other
#43
Noah Perez
Quarterbacks & Specialists
#96
Ian Brandt
#10
Quinn Henicle
Receivers & Backs
#14
Zialis Blackmon
#6
Trey Hall
#1
JJ Harrell
#7
Kendall Harris
#86
Leon Haughton Jr.
#5
Maurki James
#3
Devin Roche
#8
Josh Rodriguez
Defensive Line & Linebackers
#6
Montrell Chapman
#32
Ja'Mez Drummer
#44
Bucci Farmer
#90
Chris Forbes
#18
Jackson Forrest
#95
Ahmaad Foster
#4
Javen Gibson
#88
Malachi Harris
#9
DeAndre Lynch
#40
Hunter Malecki
#94
Lorenzo McFadden-Pressley
#10
Koa Naotala
Mario Thompson
Defensive Backs
#11
Kollin Collier
#5
Brandon Crutchfield
#3
Mario Easterly
#1
Zion Frink
#12
Asher Horn
#2
Daevon Iles
#8
Greg Johnson
#19
Lucas Struck
#26
Justin Watts
Other
#93
Nathanial Eichner
East Carolina
4th in American
VS
Old Dominion
7th in Sun Belt - East
Passing
59.1
Completion Percentage
53.8
188
Completions
150
2.80
Interception Percentage
3.60
9
Interceptions
10
68
Longest Pass
71
1,858
Net Passing Yards
1,746
185.8
Net Passing Yards Per Game
174.6
318
Passing Attempts
279
4.40
Passing Touchdown %
2.50
14
Passing Touchdowns
7
116.7
Passer Rating
107.8
20
Total Sacks
44
123
Sack Yards Lost
264
5.8
Yards Per Pass Attempt
6.3
1,858
Passing Yards
1,746
0
Passing Fumbles Lost
0
10
Team Games Played
10
347.6
Yards Per Game
268.2
22.9
Total Points Per Game
16.8
229
Total Points
168
27
Total Touchdowns
20
185.8
Passing Yards Per Game
174.6
188-318
Comp-Att
150-279
20-123
Sacks-Yards Lost
44-264
Rushing
381
Rushing Attempts
358
1,618
Rushing Yards
936
4.2
Yards Per Rush Attempt
2.6
88
Long Rushing
76
0
20+ Yard Rushing Plays
0
11
Rushing Touchdowns
9
161.8
Rushing Yards Per Game
93.6
0
Rushing Fumbles
0
0
Rushing Fumbles Lost
0
83
Rushing 1st downs
53
10
Team Games Played
10
3,476
Total Yards
2,682
719
Total Offensive Plays
681
22.9
Total Points Per Game
16.8
229
Total Points
168
27
Total Touchdowns
20
Receiving
188
Receptions
150
0
Receiving Targets
0
1,858
Receiving Yards
1,746
1,858
Receiving Yards
1,746
14
Receiving Touchdowns
7
68
Long Reception
71
0
20+ Yard Receiving Plays
0
185.8
Receiving Yards Per Game
174.6
0
Receiving Fumbles
0
0
Receiving Fumbles Lost
0
966
Receiving Yards After Catch
649
85
Receiving First Downs
76
10
Team Games Played
10
9.9
Yards Per Reception
11.6
22.9
Total Points Per Game
16.8
229
Total Points
168
27
Total Touchdowns
20
Miscellaneous
190
Total 1st downs
148
83
Rushing 1st downs
53
85
Passing 1st downs
76
22
1st downs by penalty
19
49
Third Down Conversions
50
144
Third Down Attempts
142
34.03
3rd down %
35.21
10
Fourth Down Conversions
3
20
First Downs Attempts
14
50.00
4th down %
21.43
62
Total Penalties
75
541
Total Penalty Yards
648
16647
Possession Time Seconds
16072
0.00
Red Zone Field Goal Percentage
0.00
0.00
Red Zone Scoring Percentage
0.00
0.00
Red Zone Efficiency Percentage
0.00
0.00
Red Zone Touchdown Percentage
0.00
16
Total Takeaways
22
19
Total Giveaways
21
-3
Turnover Ratio
1
0
Fumbles Lost
0
49-144
3rd down efficiency
50-142
10-20
4th down efficiency
3-14
62-541
Total-Yards
75-648
Defense
307
Solo Tackles
298
404
Assist Tackles
504
711
Total Tackles
802
29
Sacks
25
213
Sack Yards
187
130
Stuffs
99
27
Passes Defended
23
12.7
Average Interception Yards
8.3
67
Long Interception
44
0
Miscellaneous Touchdowns
0
1
Kicks Blocked
0
61
Tackles For Loss
50
10
Team Games Played
10
Defensive Interceptions
10
Interceptions
10
127
Interception Yards
83
2
Interception Touchdowns
1
10-127
INT: Total
10-83
General
24
Fumbles
19
7
Forced Fumbles
8
7
Fumbles Recovered
12
0
Fumbles Touchdowns
2
10
Games Played
10
24-0
Fumbles-Lost
19-0
Returning
8
Kick Returns
21
189
Kick Return Yards
417
23.6
Yards Per Kick Return
19.9
56
Long Kick Return
36
0
Kick Return Touchdowns
0
21
Punt Returns
16
60
Punt Return Yards
191
2.9
Yards Per Punt Return
11.9
11
Long Punt Return
78
0
Punt Return Touchdowns
1
0
Punt Return Fair Catches
0
0
Kick Return Fumbles Lost
0
0
Punt Return Fumbles Lost
0
10
Team Games Played
10
21-60
Punt: Total
16-191
Kicking
13
Field Goal Made
8
16
Field Goal Attempts
13
81.3
Field Goal Percentage
61.5
55
Long Field Goal Made
51
0
Field Goal Attempts 1-19
0
3
Field Goal Attempts 20-29
2
7
Field Goal Attempts 30-39
5
5
Field Goal Attempts 40-49
4
1
Field Goal Attempts 50+
2
26
Extra Points Made
16
26
Extra Point Attempts
16
100.0
Extra Point Percentage
100.0
0
Field Goals Made 1-19
0
3
Field Goals Made 20-29
2
4
Field Goals Made 30-39
4
5
Field Goals Made 40-49
1
1
Field Goals Made 50+
1
65
Total Kicking Points
40
10
Team Games Played
10
67
Touchback Percentage
65
0.0
Average Kickoff Return Yards
0.0
0
Kickoff Return Yards
0
0
Kickoff Returns
0
0-0
Kickoffs: Total
0-0
13-16
FG: Good-Attempts
8-13
Punting
53
Punts
60
2,429
Punt Yards
2,478
64
Long Punt
67
45.8
Gross Average Punt Yards
41.3
45.8
Net Average Punt Yards
41.3
0
Punts Blocked
0
18
Punts Inside 20
13
3
Touchbacks
5
25
Fair Catches
19
15
Punt Returns
12
0
Punt Return Yards
0
0.0
Average Punt Return Yards
0.0
10
Team Games Played
10
53-2,429
Punt: Total Yards
60-2,478
Scoring
11
Rushing Touchdowns
9
14
Receiving Touchdowns
7
0
Return Touchdowns
1
25
Total Touchdowns
19
13
Field Goals
8
26
Kick Extra Points
16
1
Total Two Point Conversions
3
229
Total Points
168
22.9
Total Points Per Game
16.8