

East Carolina vs UAB Live Score (15 Oct, 2026)
Score by Quarter
| Team | Q1 | Q2 | Q3 | Q4 | OT | Final |
|---|---|---|---|---|---|---|
 East Carolina | 7 | 7 | 0 | 3 | 0 | 17 |
 UAB | 0 | 3 | 6 | 8 | 13 | 30 |
Scoring Plays
Q1
10:07
10:07
Ray Ray Joseph Jr. 3 Yd pass from Emory Williams (Noah Perez Kick)
Passing Touchdown
7 – 0
Q2
14:13
14:13
Dawson Quarterman 0 Yd pass from Emory Williams (Noah Perez Kick)
Passing Touchdown
14 – 0
Q2
6:00
6:00
Jonah Delange 41 Yd Field Goal
Field Goal Good
14 – 3
Q3
6:44
6:44
Jonah Delange 26 Yd Field Goal
Field Goal Good
14 – 6
Q3
1:26
1:26
Jonah Delange 50 Yd Field Goal
Field Goal Good
14 – 9
Q4
9:24
9:24
Noah Perez 43 Yd Field Goal
Field Goal Good
17 – 9
Q4
0:35
0:35
Bam McReynolds 17 Yd pass from Bam McReynolds (Ryder Burton Run for Two-Point Conversion)
Passing Touchdown
17 – 15
OT
0:00
0:00
Rod Robinson II 6 Yd pass from Ryder Burton (Jonah Delange Kick)
Passing Touchdown
17 – 24
OT
0:00
0:00
Delvon Gulley 80 Yd Interception Return
Interception Return Touchdown
17 – 30
Game Leaders
East CarolinaUAB
 E. Williams QB
Passing Yards
 R. Burton QB
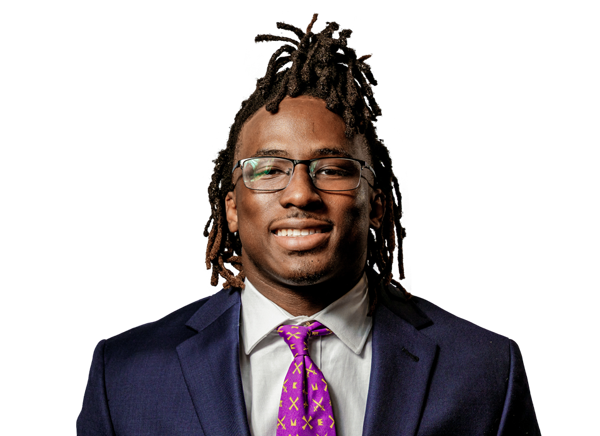 T. Engleman Jr. RB
Rushing Yards
 R. Robinson II RB
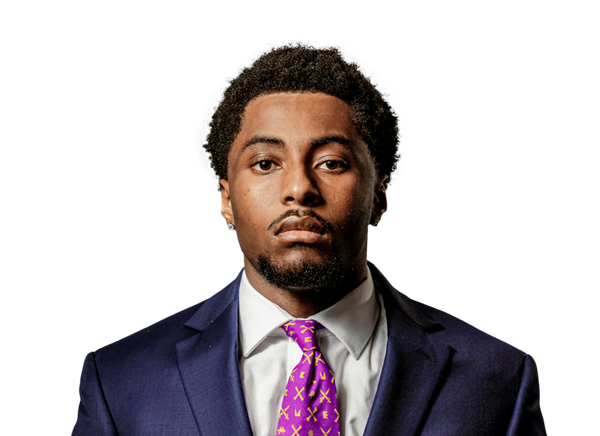 J. Dickerson WR
Receiving Yards
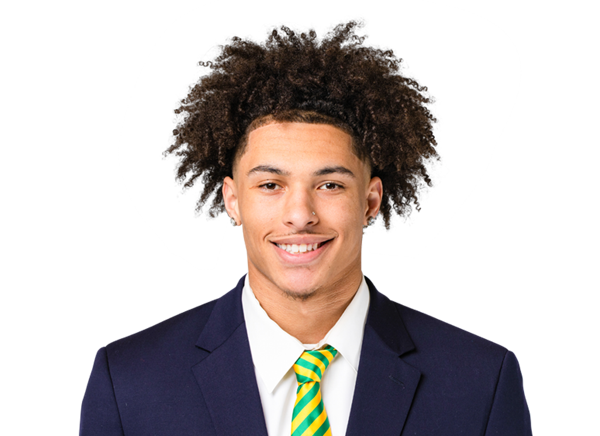 C. Smith WR
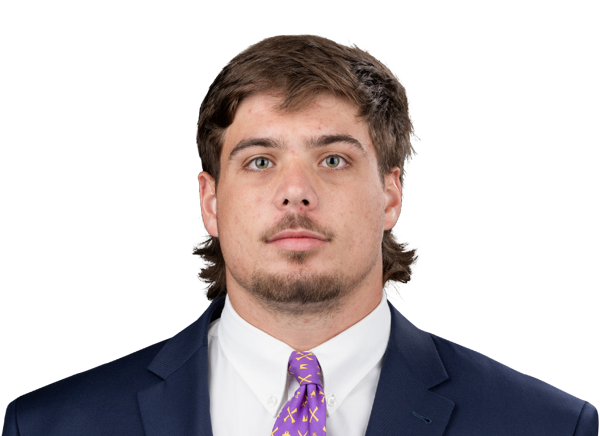 J.D. Lampley DL
Sacks
 B. Gold LB
 A. Levells-Mitchell DB
Tackles
 J. Pierce DB
Player Box Score
East Carolina| Player | C/ATT | YDS | AVG | TD | INT | QBR |
|---|---|---|---|---|---|---|
| Emory Williams#9 | 18/27 | 126 | 4.7 | 2 | 1 | 24.2 |
UAB| Player | C/ATT | YDS | AVG | TD | INT | QBR |
|---|---|---|---|---|---|---|
| Ryder Burton#5 | 19/37 | 262 | 7.1 | 2 | 0 | 47.3 |
East Carolina| Player | CAR | YDS | AVG | TD | LONG |
|---|---|---|---|---|---|
| TJ Engleman Jr.#4 | 26 | 104 | 4.0 | 0 | 12 |
| Emory Williams#9 | 12 | 42 | 3.5 | 0 | 13 |
 Ashton Gray#3 | 9 | 26 | 2.9 | 0 | 12 |
 Michael Allen#21 | 1 | 13 | 13.0 | 0 | 13 |
 Ismael Smith Flores#8 | 0 | 4 | 0.0 | 0 | 4 |
 Mitch Griffis#12 | 1 | 2 | 2.0 | 0 | 2 |
 Ray Ray Joseph Jr.#1 | 1 | 0 | 0.0 | 0 | 0 |
UAB| Player | CAR | YDS | AVG | TD | LONG |
|---|---|---|---|---|---|
| Rod Robinson II#2 | 8 | 33 | 4.1 | 0 | 22 |
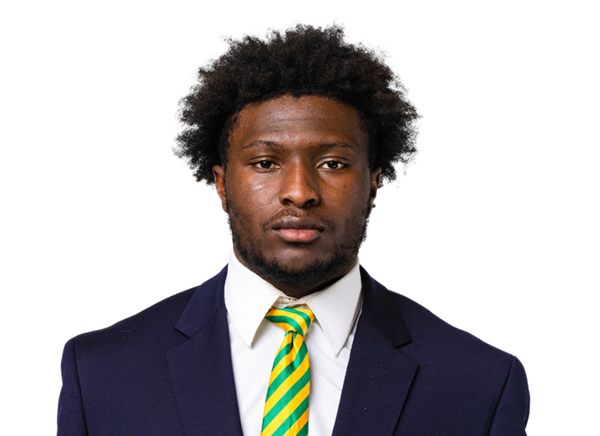 Ja'Vin Simpkins#7 | 4 | 31 | 7.8 | 0 | 22 |
| CJ Smith#1 | 1 | 22 | 22.0 | 0 | 22 |
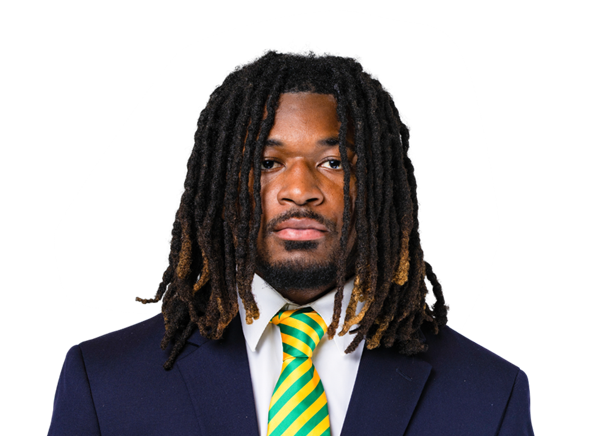 Bam McReynolds#3 | 9 | 19 | 2.1 | 0 | 7 |
 Nate Rogers#16 | 1 | 6 | 6.0 | 0 | 6 |
 EJ Reid#4 | 1 | 3 | 3.0 | 0 | 3 |
| JR Mosley#28 | 1 | 1 | 1.0 | 0 | 1 |
| Ryder Burton#5 | 7 | -16 | -2.3 | 0 | 8 |
East Carolina| Player | REC | YDS | AVG | TD | LONG |
|---|---|---|---|---|---|
| Jason Dickerson#24 | 3 | 26 | 8.7 | 0 | 19 |
| Ismael Smith Flores#8 | 2 | 22 | 11.0 | 0 | 16 |
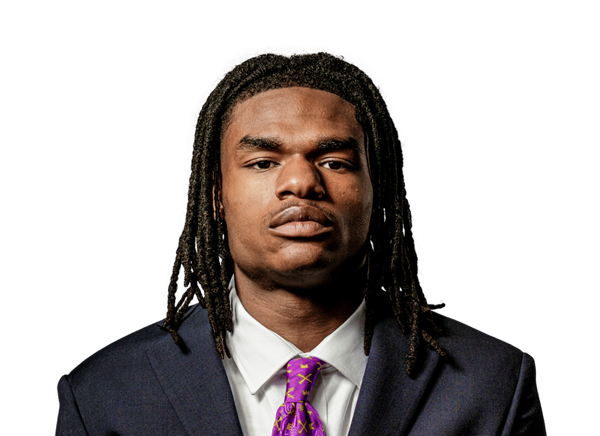 Jeremiah Melvin#11 | 1 | 21 | 21.0 | 0 | 21 |
| TJ Engleman Jr.#4 | 3 | 17 | 5.7 | 0 | 16 |
 Landon Sides#7 | 2 | 16 | 8.0 | 0 | 10 |
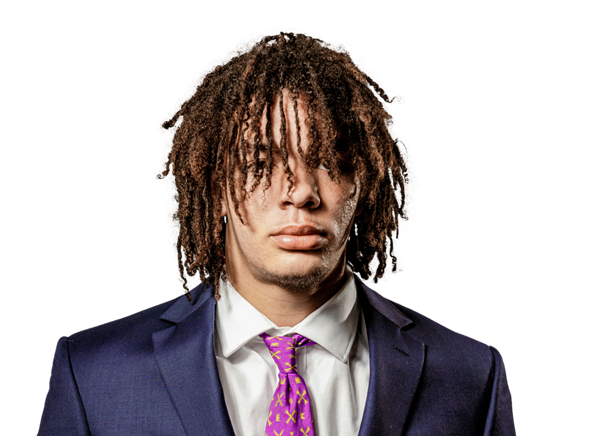 Dawson Quarterman#88 | 2 | 13 | 6.5 | 1 | 8 |
 Tyler Johnson#2 | 1 | 6 | 6.0 | 0 | 6 |
| Ray Ray Joseph Jr.#1 | 4 | 5 | 1.3 | 1 | 7 |
UAB| Player | REC | YDS | AVG | TD | LONG |
|---|---|---|---|---|---|
| CJ Smith#1 | 8 | 119 | 14.9 | 0 | 21 |
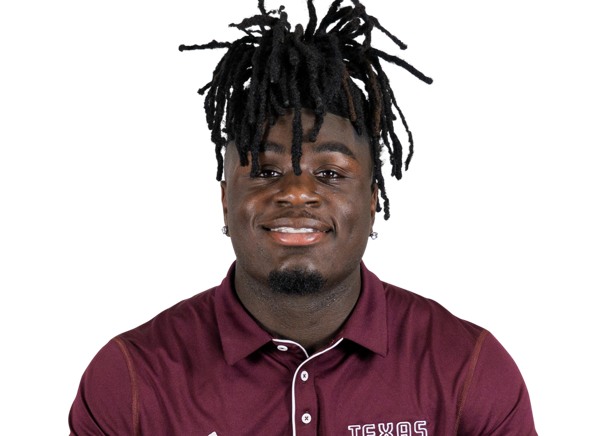 Ty Mims | 3 | 47 | 15.7 | 0 | 20 |
 Kaleb Brown#8 | 1 | 32 | 32.0 | 0 | 32 |
| Rod Robinson II#2 | 2 | 22 | 11.0 | 1 | 16 |
| Bam McReynolds#3 | 2 | 19 | 9.5 | 1 | 17 |
| EJ Reid#4 | 2 | 14 | 7.0 | 0 | 9 |
 Sean Persson#87 | 1 | 9 | 9.0 | 0 | 9 |
East Carolina| Player | TOT | SOLO | SACKS | TFL | PD | QB HUR | TD |
|---|---|---|---|---|---|---|---|
| Ashton Levells-Mitchell#7 | 6 | 4 | 0 | 1 | 0 | 0 | 0 |
 Kamaurri McKinley#8 | 5 | 3 | 0 | 0.5 | 1 | 0 | 0 |
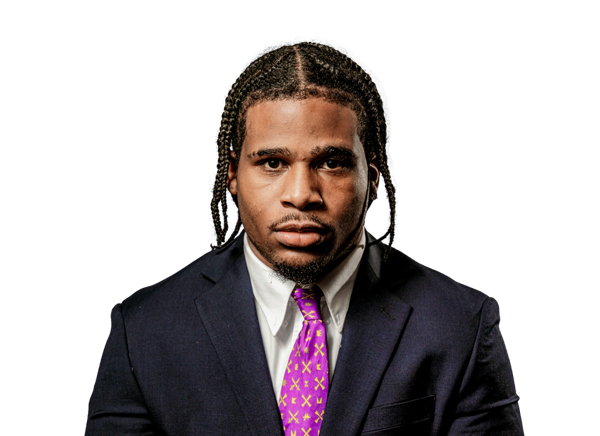 DJ Johnson Jr.#11 | 5 | 3 | 0 | 1 | 0 | 0 | 0 |
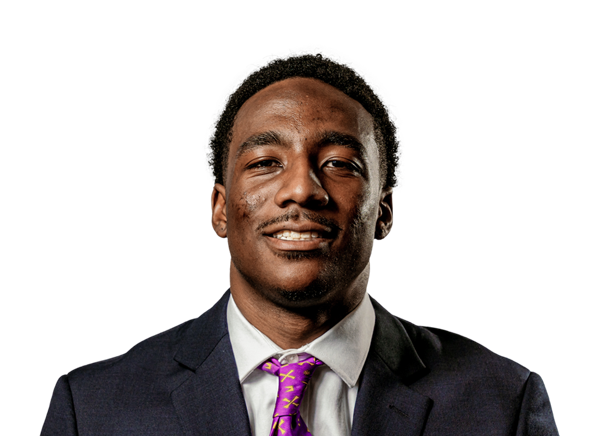 Myles Pollard#12 | 5 | 2 | 0 | 0 | 0 | 0 | 0 |
 Crews Law#10 | 5 | 0 | 0 | 1 | 0 | 1 | 0 |
 Zyeir Gamble#3 | 4 | 4 | 0 | 0 | 0 | 0 | 0 |
 Jasiyah Robinson | 3 | 2 | 0 | 0 | 0 | 1 | 0 |
 Kieran Davis#5 | 3 | 1 | 0 | 2 | 1 | 0 | 0 |
 Kendrick DuJour#9 | 3 | 1 | 0 | 0.5 | 0 | 0 | 0 |
 Kevon Merrell Jr.#4 | 3 | 1 | 0 | 0 | 1 | 0 | 0 |
| J.D. Lampley#9 | 2 | 2 | 1 | 1 | 0 | 0 | 0 |
 Preston Carr#44 | 2 | 2 | 1 | 1 | 0 | 1 | 0 |
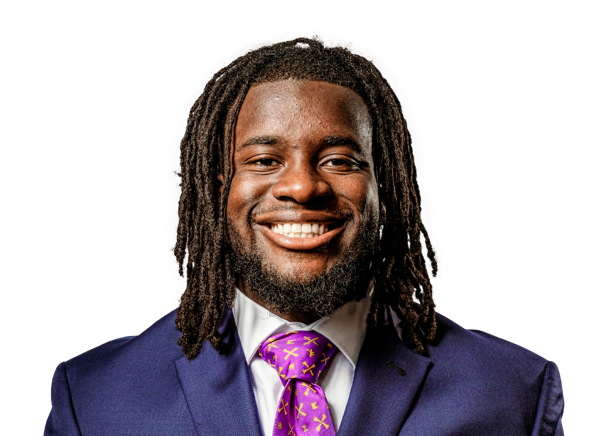 Julien Davis#42 | 2 | 2 | 0 | 0 | 0 | 1 | 0 |
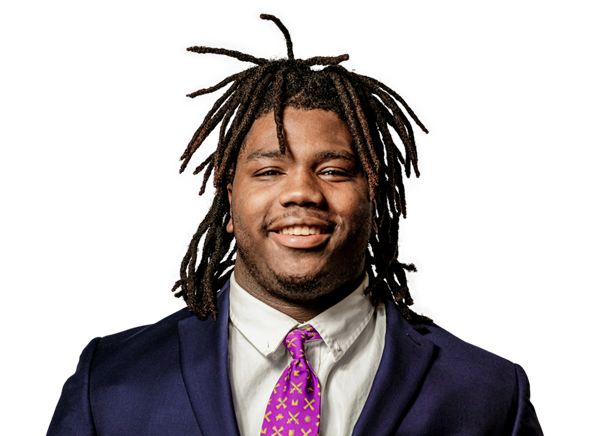 Torin Brazell#98 | 2 | 1 | 0 | 0.5 | 0 | 0 | 0 |
 Josh Benton#23 | 1 | 1 | 1 | 1 | 0 | 0 | 0 |
 Christian Peterson#15 | 1 | 1 | 0 | 0 | 1 | 0 | 0 |
 Rae'mon Mosby#17 | 1 | 1 | 0 | 0 | 0 | 0 | 0 |
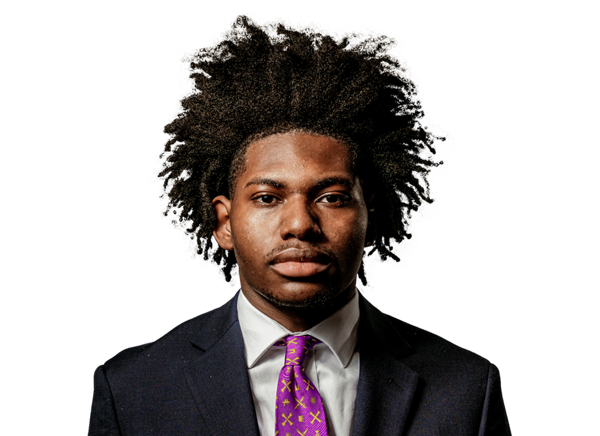 Angelo Ross#22 | 1 | 1 | 0 | 0 | 2 | 0 | 0 |
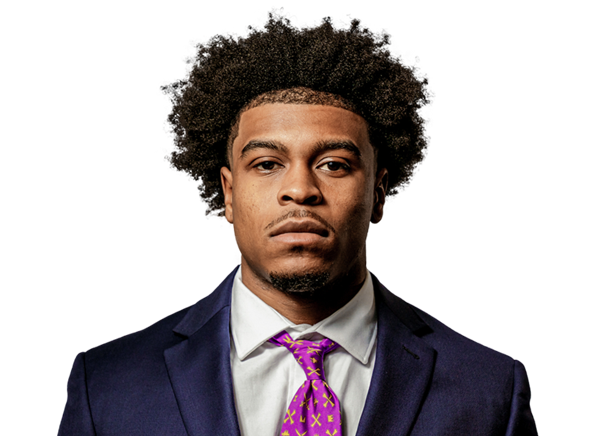 Ayden Duncanson#13 | 1 | 0 | 0 | 0 | 0 | 0 | 0 |
 Rion Roseborough#88 | 1 | 0 | 0 | 0.5 | 0 | 0 | 0 |
UAB| Player | TOT | SOLO | SACKS | TFL | PD | QB HUR | TD |
|---|---|---|---|---|---|---|---|
| Jo'Tavion Pierce | 16 | 10 | 0 | 1.5 | 1 | 1 | 0 |
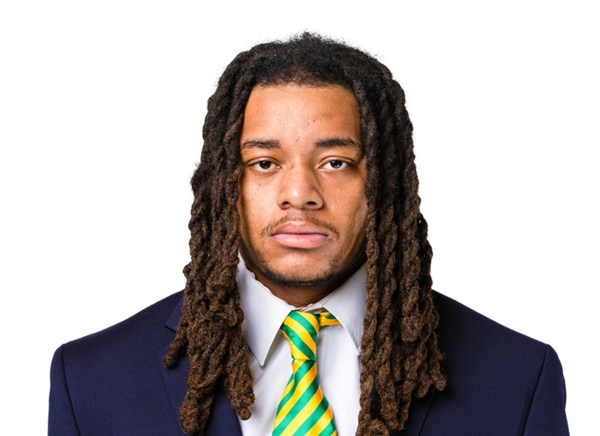 Muaaz Byard#35 | 15 | 6 | 0 | 1.5 | 0 | 0 | 0 |
 Ike Esonwune#3 | 9 | 5 | 0 | 0 | 0 | 0 | 0 |
 Anta'Veon McKenzie#11 | 8 | 4 | 0 | 1 | 0 | 1 | 0 |
 Jeremiah Jordan#13 | 7 | 2 | 0 | 0 | 0 | 0 | 0 |
 Marlin Dean#4 | 6 | 1 | 1 | 1 | 0 | 1 | 0 |
 Delvon Gulley#5 | 5 | 4 | 0 | 0 | 2 | 0 | 1 |
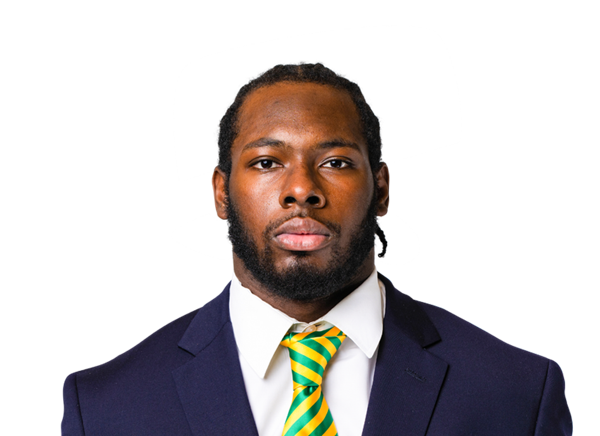 Chris Spencer#90 | 5 | 1 | 0 | 0.5 | 0 | 0 | 0 |
| Blanche Gold#7 | 3 | 2 | 1 | 1.5 | 0 | 1 | 0 |
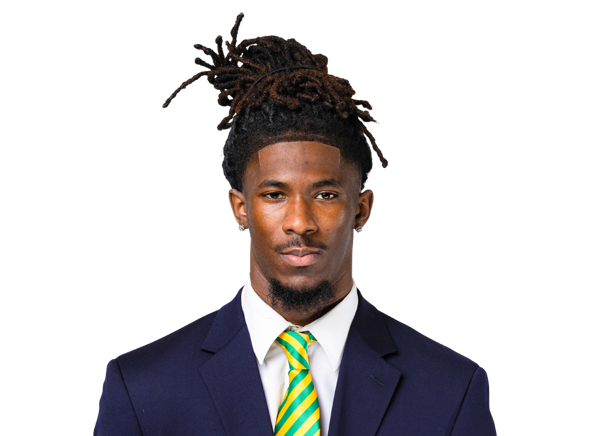 Darrell Sweeting#1 | 3 | 1 | 0 | 0 | 0 | 0 | 0 |
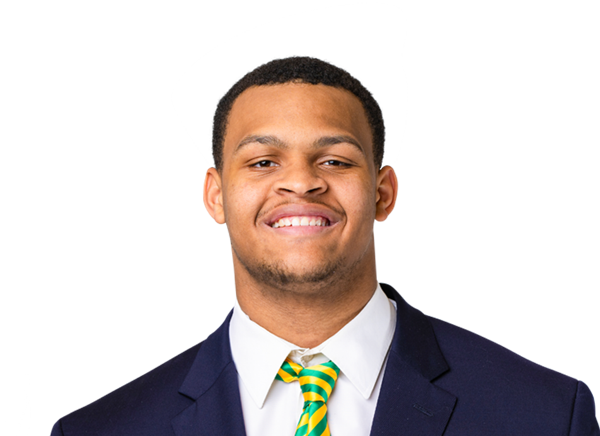 Tylin Jackson#17 | 3 | 1 | 0 | 0 | 0 | 0 | 0 |
 Braden Sullivan#33 | 3 | 1 | 0 | 0 | 0 | 0 | 0 |
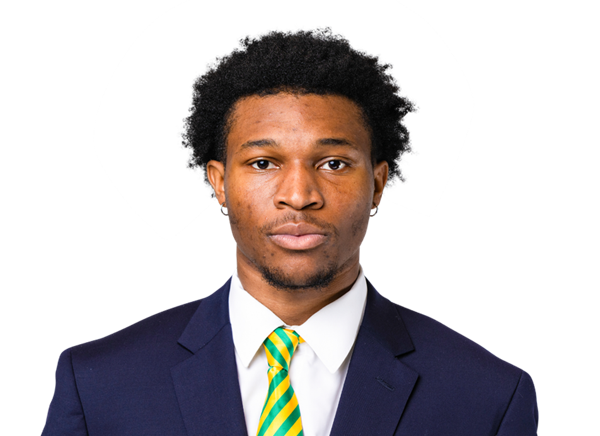 Que Billingsley#6 | 2 | 2 | 0 | 0 | 0 | 0 | 0 |
 Raymond Macias#99 | 2 | 1 | 0 | 0 | 0 | 0 | 0 |
 Sterling Sanders#52 | 2 | 1 | 0 | 0 | 0 | 0 | 0 |
 Cam Cunningham#29 | 2 | 0 | 0 | 0 | 0 | 0 | 0 |
 Draden Fullbright#21 | 1 | 1 | 0 | 0 | 0 | 0 | 0 |
 Elijah Pratt#12 | 1 | 1 | 0 | 0 | 0 | 0 | 0 |
 Chris Burge#59 | 1 | 1 | 0 | 0 | 0 | 0 | 0 |
 Mantrez Walker#14 | 1 | 0 | 0 | 0 | 0 | 0 | 0 |
East Carolina| Player | FUM | LOST | REC |
|---|---|---|---|
| Michael Allen#21 | 1 | 1 | 0 |
| Emory Williams#9 | 1 | 0 | 0 |
| Ismael Smith Flores#8 | 1 | 0 | 0 |
UAB| Player | FUM | LOST | REC |
|---|---|---|---|
| Chris Burge#59 | 0 | 0 | 1 |
East Carolina| Player | FG | PCT | LONG | XP | PTS |
|---|---|---|---|---|---|
 Noah Perez#43 | 1/1 | 100.0 | 43 | 2/2 | 5 |
UAB| Player | FG | PCT | LONG | XP | PTS |
|---|---|---|---|---|---|
 Jonah Delange#39 | 3/3 | 100.0 | 50 | 1/1 | 10 |
East Carolina| Player | NO | YDS | AVG | TB | In 20 | LONG |
|---|---|---|---|---|---|---|
 Elliot Huether#83 | 4 | 200 | 50.0 | 0 | 3 | 64 |
| Noah Perez#43 | 1 | 33 | 33.0 | 0 | 1 | 33 |
UAB| Player | NO | YDS | AVG | TB | In 20 | LONG |
|---|---|---|---|---|---|---|
 Oliver Straw#46 | 6 | 273 | 45.5 | 0 | 2 | 59 |
East Carolina| Player | NO | YDS | AVG | LONG | TD |
|---|---|---|---|---|---|
 Kyler Pearson | 3 | 3 | 1.0 | 2 | 0 |
UAB| Player | INT | YDS | TD |
|---|---|---|---|
| Delvon Gulley#5 | 1 | 80 | 1 |
Drive Summary
ECU
Touchdown
75
UAB
Punt
9
ECU
Fumble
39
UAB
Punt
4
ECU
Touchdown
60
UAB
Punt
-1
ECU
Punt
8
UAB
Field Goal
61
ECU
Punt
5
UAB
Punt
-4
ECU
Punt
-1
UAB
Punt
32
ECU
End of Half
2
UAB
Punt
11
ECU
Downs
36
UAB
Field Goal
38
ECU
Punt
5
UAB
Field Goal
36
ECU
Field Goal
50
UAB
Downs
44
ECU
Punt
29
UAB
Touchdown
93
ECU
End of Half
24
UAB
Touchdown
25
ECU
Interception Touchdown
3
Injury Report
No current injury report is available for this matchup.
Head-to-Head
Historical meetings are not available for this matchup.
Game Information
StageWeek 7
Season2026
KickoffThu, Oct 15, 7:30 pm
VenueProtective Stadium
LocationBirmingham, AL
SurfaceGrass
BroadcastESPN
Attendance19,834
Division Standings
FBS — American Conference
| Team | W | L | T | Pct | PF | PA | Home | Away | Strk |
|---|---|---|---|---|---|---|---|---|---|
 UTSA | 7 | 1 | 0 | 0.875 | 268 | 208 | 4-0 | 3-1 | W5 |
 North Texas | 6 | 2 | 0 | 0.750 | 350 | 255 | 4-0 | 2-2 | W5 |
 Army | 5 | 3 | 0 | 0.625 | 269 | 204 | 3-1 | 2-2 | L1 |
 Memphis | 7 | 2 | 0 | 0.778 | 338 | 212 | 5-0 | 2-2 | W2 |
| UAB | 4 | 4 | 0 | 0.500 | 173 | 202 | 4-0 | 0-4 | L1 |
 Florida Atlantic | 5 | 3 | 0 | 0.625 | 302 | 286 | 4-0 | 1-3 | L1 |
| East Carolina | 4 | 4 | 0 | 0.500 | 192 | 193 | 3-1 | 1-3 | W1 |
 Tulane | 4 | 4 | 0 | 0.500 | 180 | 203 | 3-1 | 1-3 | W1 |
 Charlotte | 1 | 7 | 0 | 0.125 | 165 | 322 | 0-4 | 1-3 | L1 |
 Temple | 2 | 6 | 0 | 0.250 | 189 | 213 | 1-4 | 1-2 | L3 |
 South Florida | 6 | 2 | 0 | 0.750 | 216 | 116 | 4-1 | 2-1 | W2 |
 Tulsa | 4 | 4 | 0 | 0.500 | 238 | 195 | 2-2 | 2-2 | L1 |
 Navy | 2 | 6 | 0 | 0.250 | 221 | 239 | 2-2 | 0-4 | L3 |
 Rice | 1 | 7 | 0 | 0.125 | 168 | 254 | 1-3 | 0-4 | L7 |
East Carolina
VS
UAB
Quarterbacks & Specialists
#12
Mitch Griffis
#83
Elliot Huether
#9
Emory Williams
Receivers & Backs
#21
Michael Allen
#24
Jason Dickerson
#4
TJ Engleman Jr.
#3
Ashton Gray
#2
Tyler Johnson
#1
Ray Ray Joseph Jr.
#11
Jeremiah Melvin
Kyler Pearson
#88
Dawson Quarterman
#7
Landon Sides
#8
Ismael Smith Flores
Defensive Line & Linebackers
#98
Torin Brazell
#44
Preston Carr
#42
Julien Davis
#5
Kieran Davis
#9
Kendrick DuJour
#11
DJ Johnson Jr.
#9
J.D. Lampley
#10
Crews Law
Jasiyah Robinson
#88
Rion Roseborough
Defensive Backs
#23
Josh Benton
#13
Ayden Duncanson
#3
Zyeir Gamble
#7
Ashton Levells-Mitchell
#8
Kamaurri McKinley
#4
Kevon Merrell Jr.
#17
Rae'mon Mosby
#15
Christian Peterson
#12
Myles Pollard
#22
Angelo Ross
Other
#43
Noah Perez
Quarterbacks & Specialists
#5
Ryder Burton
#16
Nate Rogers
#46
Oliver Straw
Receivers & Backs
#8
Kaleb Brown
#3
Bam McReynolds
Ty Mims
#28
JR Mosley
#87
Sean Persson
#4
EJ Reid
#2
Rod Robinson II
#7
Ja'Vin Simpkins
#1
CJ Smith
Defensive Line & Linebackers
#59
Chris Burge
#35
Muaaz Byard
#29
Cam Cunningham
#4
Marlin Dean
#3
Ike Esonwune
#7
Blanche Gold
#17
Tylin Jackson
#99
Raymond Macias
#52
Sterling Sanders
#90
Chris Spencer
#33
Braden Sullivan
#14
Mantrez Walker
Defensive Backs
#6
Que Billingsley
#21
Draden Fullbright
#5
Delvon Gulley
#13
Jeremiah Jordan
#11
Anta'Veon McKenzie
Jo'Tavion Pierce
#12
Elijah Pratt
#1
Darrell Sweeting
Other
#39
Jonah Delange
East Carolina
5th in American
VS
UAB
5th in American
Passing
58.8
Completion Percentage
53.0
144
Completions
106
2.90
Interception Percentage
2.50
7
Interceptions
5
68
Longest Pass
56
1,492
Net Passing Yards
1,357
186.5
Net Passing Yards Per Game
169.6
245
Passing Attempts
200
4.90
Passing Touchdown %
3.00
12
Passing Touchdowns
6
120.4
Passer Rating
115.0
16
Total Sacks
25
97
Sack Yards Lost
168
6.1
Yards Per Pass Attempt
6.8
1,492
Passing Yards
1,357
0
Passing Fumbles Lost
0
8
Team Games Played
8
351.0
Yards Per Game
318.8
24.0
Total Points Per Game
21.6
192
Total Points
173
23
Total Touchdowns
17
186.5
Passing Yards Per Game
169.6
144-245
Comp-Att
106-200
16-97
Sacks-Yards Lost
25-168
Rushing
300
Rushing Attempts
330
1,316
Rushing Yards
1,193
4.4
Yards Per Rush Attempt
3.6
88
Long Rushing
48
0
20+ Yard Rushing Plays
0
9
Rushing Touchdowns
9
164.5
Rushing Yards Per Game
149.1
0
Rushing Fumbles
0
0
Rushing Fumbles Lost
0
64
Rushing 1st downs
75
8
Team Games Played
8
2,808
Total Yards
2,550
561
Total Offensive Plays
555
24.0
Total Points Per Game
21.6
192
Total Points
173
23
Total Touchdowns
17
Receiving
144
Receptions
106
0
Receiving Targets
0
1,492
Receiving Yards
1,357
1,492
Receiving Yards
1,357
12
Receiving Touchdowns
6
68
Long Reception
56
0
20+ Yard Receiving Plays
0
186.5
Receiving Yards Per Game
169.6
0
Receiving Fumbles
0
0
Receiving Fumbles Lost
0
780
Receiving Yards After Catch
491
66
Receiving First Downs
62
8
Team Games Played
8
10.4
Yards Per Reception
12.8
24.0
Total Points Per Game
21.6
192
Total Points
173
23
Total Touchdowns
17
Miscellaneous
145
Total 1st downs
145
64
Rushing 1st downs
75
66
Passing 1st downs
62
15
1st downs by penalty
8
35
Third Down Conversions
48
111
Third Down Attempts
121
31.53
3rd down %
39.67
9
Fourth Down Conversions
6
17
First Downs Attempts
16
52.94
4th down %
37.50
47
Total Penalties
47
432
Total Penalty Yards
410
13430
Possession Time Seconds
14614
0.00
Red Zone Field Goal Percentage
0.00
0.00
Red Zone Scoring Percentage
0.00
0.00
Red Zone Efficiency Percentage
0.00
0.00
Red Zone Touchdown Percentage
0.00
13
Total Takeaways
10
14
Total Giveaways
12
-1
Turnover Ratio
-2
0
Fumbles Lost
0
35-111
3rd down efficiency
48-121
9-17
4th down efficiency
6-16
47-432
Total-Yards
47-410
Defense
255
Solo Tackles
314
330
Assist Tackles
208
585
Total Tackles
522
21
Sacks
17
148
Sack Yards
97
104
Stuffs
56
21
Passes Defended
22
13.0
Average Interception Yards
17.6
67
Long Interception
80
0
Miscellaneous Touchdowns
0
1
Kicks Blocked
0
42
Tackles For Loss
32
8
Team Games Played
8
Defensive Interceptions
8
Interceptions
5
104
Interception Yards
88
2
Interception Touchdowns
1
8-104
INT: Total
5-88
General
17
Fumbles
9
7
Forced Fumbles
9
6
Fumbles Recovered
5
0
Fumbles Touchdowns
1
8
Games Played
8
17-0
Fumbles-Lost
9-0
Returning
6
Kick Returns
11
144
Kick Return Yards
184
24.0
Yards Per Kick Return
16.7
56
Long Kick Return
27
0
Kick Return Touchdowns
0
16
Punt Returns
12
36
Punt Return Yards
149
2.3
Yards Per Punt Return
12.4
9
Long Punt Return
42
0
Punt Return Touchdowns
0
0
Punt Return Fair Catches
0
0
Kick Return Fumbles Lost
0
0
Punt Return Fumbles Lost
0
8
Team Games Played
8
16-36
Punt: Total
12-149
Kicking
10
Field Goal Made
18
12
Field Goal Attempts
22
83.3
Field Goal Percentage
81.8
49
Long Field Goal Made
57
0
Field Goal Attempts 1-19
0
3
Field Goal Attempts 20-29
5
6
Field Goal Attempts 30-39
4
3
Field Goal Attempts 40-49
10
0
Field Goal Attempts 50+
3
22
Extra Points Made
15
22
Extra Point Attempts
15
100.0
Extra Point Percentage
100.0
0
Field Goals Made 1-19
0
3
Field Goals Made 20-29
5
4
Field Goals Made 30-39
3
3
Field Goals Made 40-49
8
0
Field Goals Made 50+
2
52
Total Kicking Points
69
8
Team Games Played
8
60
Touchback Percentage
76
0.0
Average Kickoff Return Yards
0.0
0
Kickoff Return Yards
0
0
Kickoff Returns
0
0-0
Kickoffs: Total
0-0
10-12
FG: Good-Attempts
18-22
Punting
43
Punts
28
2,007
Punt Yards
1,298
64
Long Punt
59
46.7
Gross Average Punt Yards
46.4
46.7
Net Average Punt Yards
46.4
0
Punts Blocked
0
14
Punts Inside 20
10
2
Touchbacks
0
19
Fair Catches
7
14
Punt Returns
12
0
Punt Return Yards
0
0.0
Average Punt Return Yards
0.0
8
Team Games Played
8
43-2,007
Punt: Total Yards
28-1,298
Scoring
9
Rushing Touchdowns
9
12
Receiving Touchdowns
6
0
Return Touchdowns
0
21
Total Touchdowns
16
10
Field Goals
18
22
Kick Extra Points
15
1
Total Two Point Conversions
1
192
Total Points
173
24.0
Total Points Per Game
21.6