

Florida International vs South Florida Live Score (5 Sep, 2026)
Score by Quarter
| Team | Q1 | Q2 | Q3 | Q4 | Final |
|---|---|---|---|---|---|
 Florida International | 0 | 0 | 3 | 6 | 9 |
 South Florida | 3 | 3 | 0 | 13 | 19 |
Scoring Plays
Q1
5:27
5:27
N. Gramatica 37 yd FG GOOD
Field Goal Good
0 – 3
Q2
10:26
10:26
N. Gramatica 53 yd FG GOOD
Field Goal Good
0 – 6
Q3
9:04
9:04
R. Czeremcha 29 yd FG GOOD
Field Goal Good
3 – 6
Q4
13:07
13:07
D.J. Crowther run for 1 yd, for a TD (N. Gramatica KICK)
Rushing Touchdown
3 – 13
Q4
7:03
7:03
N. Gramatica 30 yd FG GOOD
Field Goal Good
3 – 16
Q4
1:44
1:44
N. Gramatica 29 yd FG GOOD
Field Goal Good
3 – 19
Q4
1:40
1:40
JJ Kohl pass to M. Anderson for 21 yds, for a TD
Passing Touchdown
9 – 19
Game Leaders
Florida InternationalSouth Florida
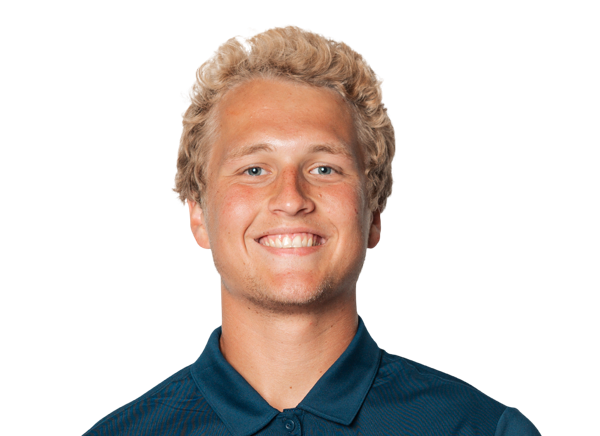 J. Kohl QB
Passing Yards
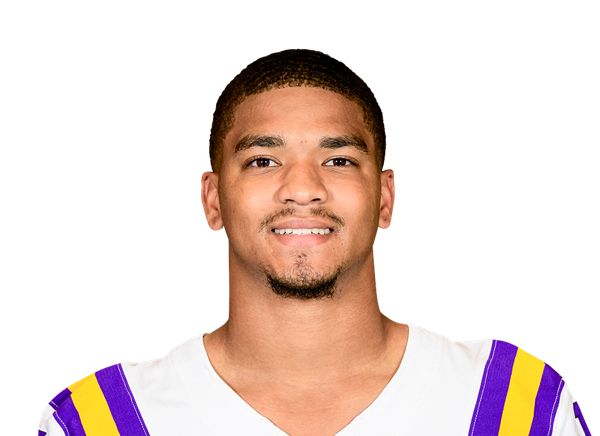 M. Van Buren Jr. QBJ. Kohl QB
Rushing Yards
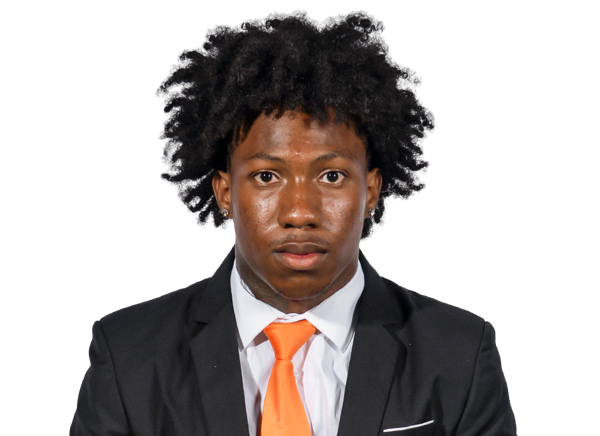 J. Collins Jr. RB
 M. Anderson WR
Receiving Yards
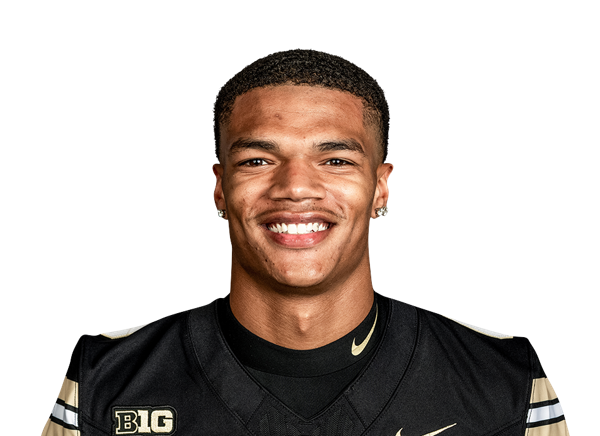 A. Branch WR
 D. Holmes Jr. DL
Sacks
 M. Williams II DE
 D. Boykins DB
Tackles
 R. Hill LB
Player Box Score
Florida International| Player | C/ATT | YDS | AVG | TD | INT |
|---|---|---|---|---|---|
| JJ Kohl#17 | 31/50 | 301 | 6.0 | 1 | 2 |
South Florida| Player | C/ATT | YDS | AVG | TD | INT |
|---|---|---|---|---|---|
| Michael Van Buren Jr.#3 | 11/18 | 100 | 5.6 | 0 | 0 |
Florida International| Player | CAR | YDS | AVG | TD | LONG |
|---|---|---|---|---|---|
| JJ Kohl#17 | 6 | 31 | 5.2 | 0 | 15 |
 Anthony Carrie#1 | 10 | 31 | 3.1 | 0 | 14 |
 Devonte Lyons#3 | 8 | 20 | 2.5 | 0 | 7 |
 Kyle McNeal#7 | 1 | -2 | -2.0 | 0 | 0 |
South Florida| Player | CAR | YDS | AVG | TD | LONG |
|---|---|---|---|---|---|
| Jason Collins Jr.#2 | 17 | 59 | 3.5 | 0 | 12 |
 D.J. Crowther#5 | 14 | 42 | 3.0 | 1 | 10 |
| Michael Van Buren Jr.#3 | 7 | 7 | 1.0 | 0 | 6 |
Florida International| Player | REC | YDS | AVG | TD | LONG |
|---|---|---|---|---|---|
| Maguire Anderson#2 | 9 | 108 | 12.0 | 1 | 21 |
| Kyle McNeal#7 | 5 | 44 | 8.8 | 0 | 18 |
 Eric Nelson Jr.#6 | 4 | 43 | 10.8 | 0 | 16 |
 Jojo Stone | 5 | 43 | 8.6 | 0 | 21 |
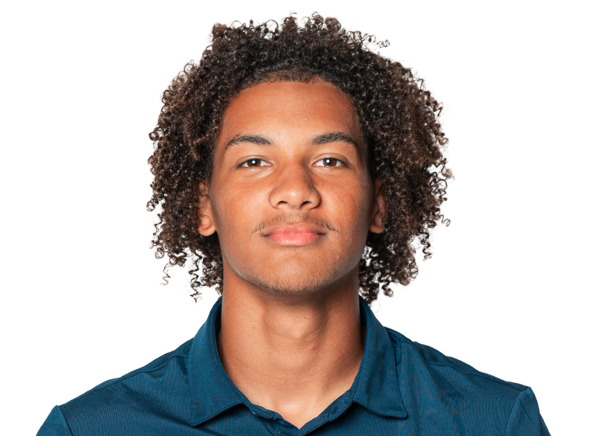 Tyson Carter#13 | 1 | 29 | 29.0 | 0 | 29 |
 Jackson Verdugo#9 | 1 | 15 | 15.0 | 0 | 15 |
 James Resar#4 | 2 | 10 | 5.0 | 0 | 7 |
 Greg Gaines III#8 | 2 | 8 | 4.0 | 0 | 9 |
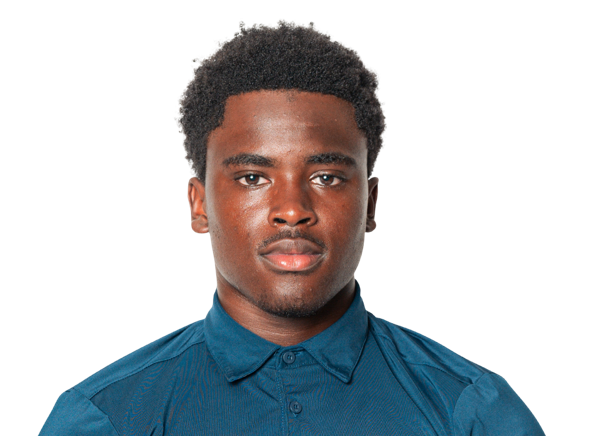 Sterling Joseph#22 | 2 | 1 | 0.5 | 0 | 4 |
South Florida| Player | REC | YDS | AVG | TD | LONG |
|---|---|---|---|---|---|
| Arhmad Branch#4 | 5 | 47 | 9.4 | 0 | 14 |
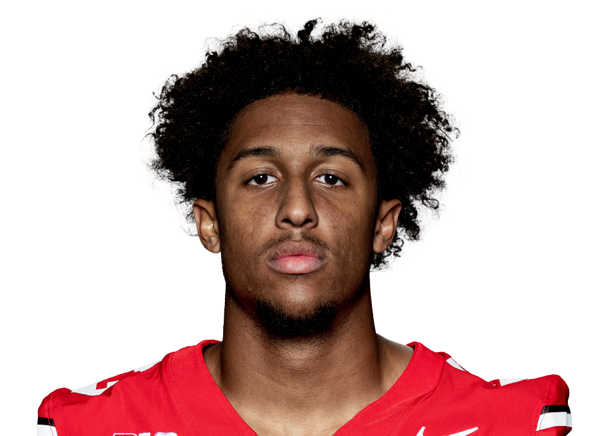 Bryson Rodgers#1 | 3 | 25 | 8.3 | 0 | 10 |
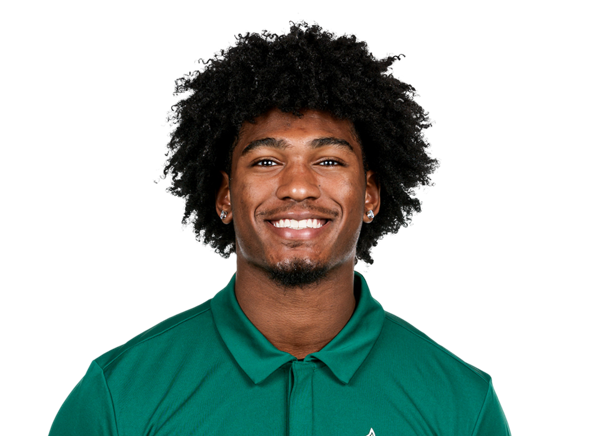 Wyatt Sullivan#8 | 1 | 12 | 12.0 | 0 | 12 |
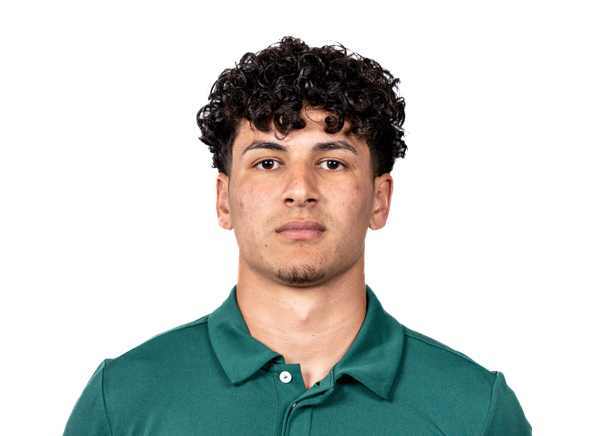 Joshua Porter#80 | 1 | 8 | 8.0 | 0 | 8 |
 Luke Clyburn#87 | 1 | 8 | 8.0 | 0 | 8 |
Florida International| Player | TOT | SOLO | SACKS | TFL | PD | QB HUR | TD |
|---|---|---|---|---|---|---|---|
| DeAndre Boykins#2 | 9 | 4 | 0 | 1 | 0 | 0 | 0 |
 Josiah Taylor#9 | 7 | 3 | 0 | 0 | 0 | 0 | 0 |
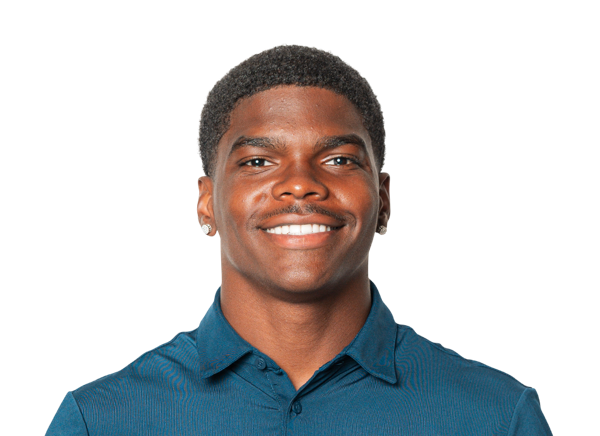 Wesley Miller#4 | 6 | 3 | 0 | 0 | 0 | 0 | 0 |
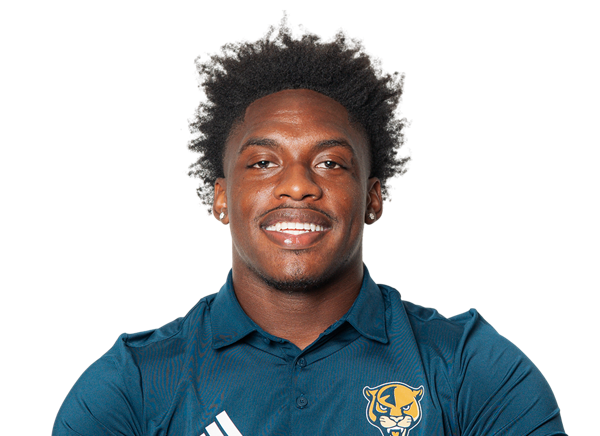 Pickle Stewart#18 | 6 | 2 | 0 | 1 | 0 | 0 | 0 |
 Elisha Baldridge#97 | 5 | 1 | 0 | 2 | 0 | 0 | 0 |
 Brayshawn Littlejohn#22 | 4 | 3 | 0 | 0.5 | 0 | 0 | 0 |
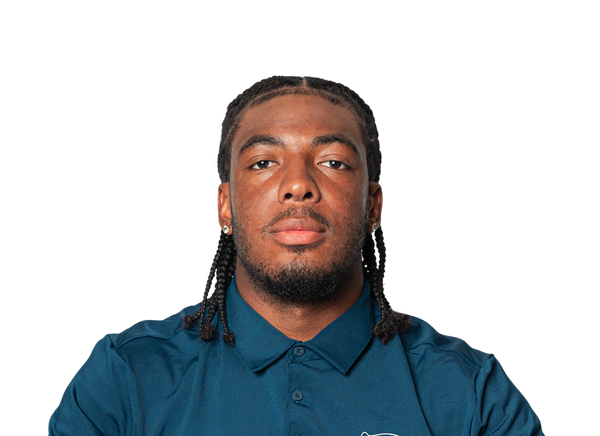 Kenton Simmons#5 | 4 | 2 | 0 | 0 | 0 | 0 | 0 |
| DeeJay Holmes Jr.#33 | 3 | 2 | 1 | 2 | 0 | 0 | 0 |
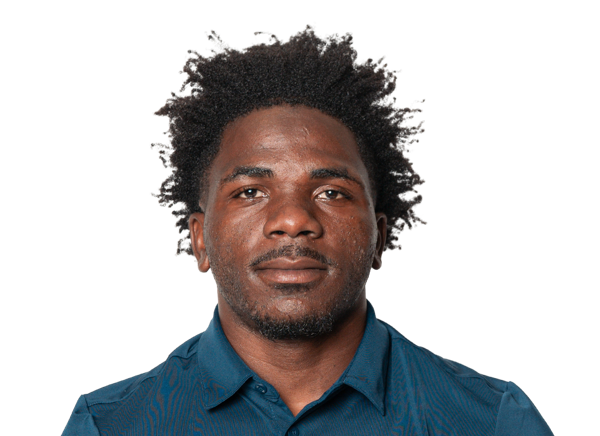 Jai-Ayviauynn Celestine#7 | 3 | 1 | 0 | 0 | 1 | 0 | 0 |
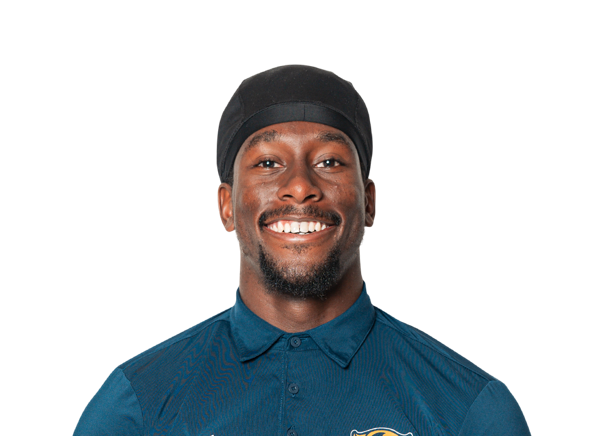 Shamir Sterlin#1 | 3 | 1 | 0 | 0 | 0 | 0 | 0 |
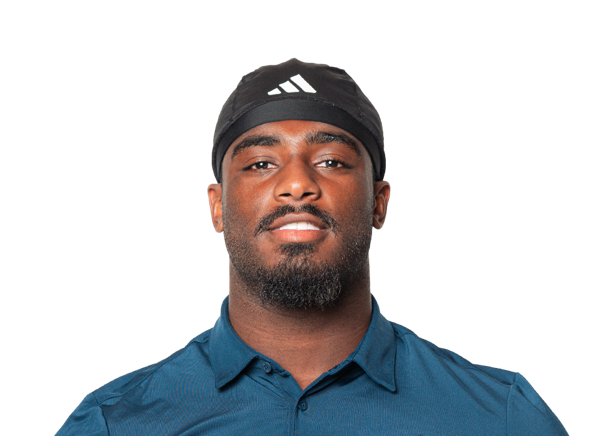 Percy Courtney Jr.#11 | 2 | 1 | 0 | 0 | 0 | 0 | 0 |
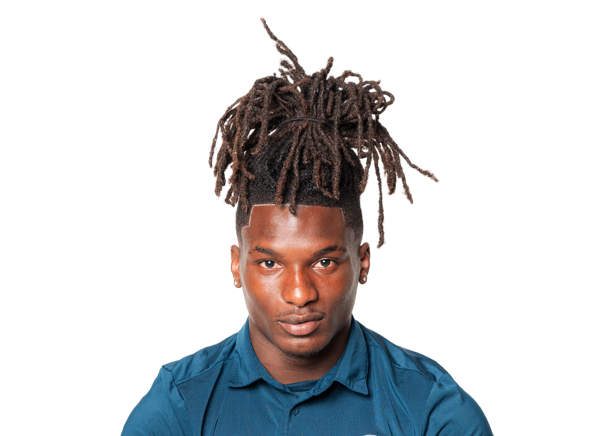 Da'Vontae Floyd | 2 | 1 | 0 | 0 | 0 | 0 | 0 |
 Ryan Gadson#8 | 2 | 1 | 0 | 0 | 1 | 0 | 0 |
 Ormond Wallace#10 | 2 | 1 | 0 | 0 | 0 | 0 | 0 |
 Elijah Simmons#88 | 2 | 0 | 0 | 0 | 0 | 0 | 0 |
 Anthony Smith#95 | 1 | 1 | 0 | 0 | 0 | 0 | 0 |
 Lawrence Johnson#6 | 1 | 1 | 0 | 0 | 0 | 0 | 0 |
| Jojo Stone | 1 | 1 | 0 | 0 | 0 | 0 | 0 |
| Tyson Carter#13 | 1 | 1 | 0 | 0 | 0 | 0 | 0 |
 Anthony Cunningham | 1 | 0 | 0 | 0 | 0 | 0 | 0 |
 Kyrie Samuel#91 | 1 | 0 | 0 | 0.5 | 0 | 0 | 0 |
 Nathan Jennings#15 | 1 | 0 | 0 | 0 | 0 | 0 | 0 |
 RJ Moss Jr.#12 | 1 | 0 | 0 | 0 | 0 | 0 | 0 |
 Nick Watson#16 | 0 | 0 | 0 | 0 | 0 | 1 | 0 |
South Florida| Player | TOT | SOLO | SACKS | TFL | PD | QB HUR | TD |
|---|---|---|---|---|---|---|---|
| Rodney Hill#6 | 6 | 4 | 0 | 0 | 0 | 0 | 0 |
 Ayden Jackson#5 | 6 | 4 | 0 | 0 | 1 | 0 | 0 |
 Tavin Ward#2 | 5 | 3 | 0 | 0 | 0 | 0 | 0 |
 Tayvion Beasley#15 | 4 | 4 | 0 | 1 | 0 | 0 | 0 |
 Teddy Foster#16 | 4 | 4 | 0 | 0 | 0 | 0 | 0 |
 C.J. Hicks#1 | 4 | 3 | 0 | 0 | 1 | 1 | 0 |
| Michael Williams II#4 | 4 | 2 | 0.5 | 0.5 | 0 | 0 | 0 |
 Sam Robinson#7 | 4 | 1 | 0 | 0 | 0 | 0 | 0 |
 Jair Murphy#31 | 3 | 2 | 0 | 0 | 0 | 0 | 0 |
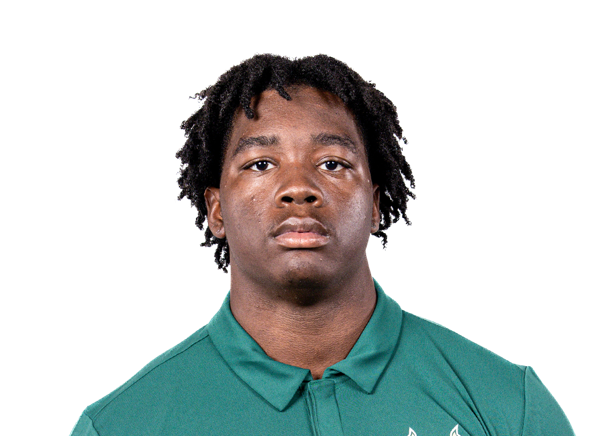 Ryan Jenkins#28 | 3 | 1 | 0 | 0 | 0 | 0 | 0 |
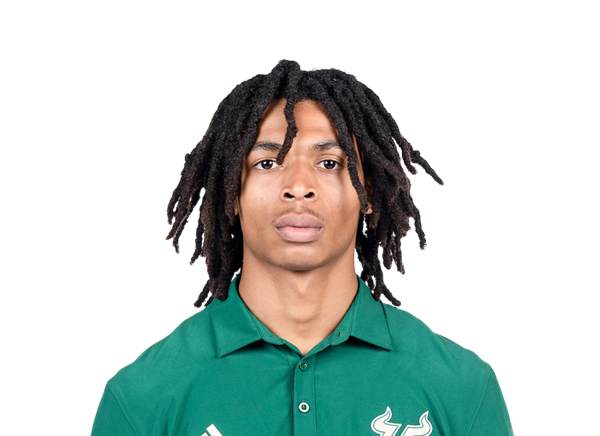 Herlin Perry Jr.#35 | 3 | 1 | 0 | 0 | 0 | 0 | 0 |
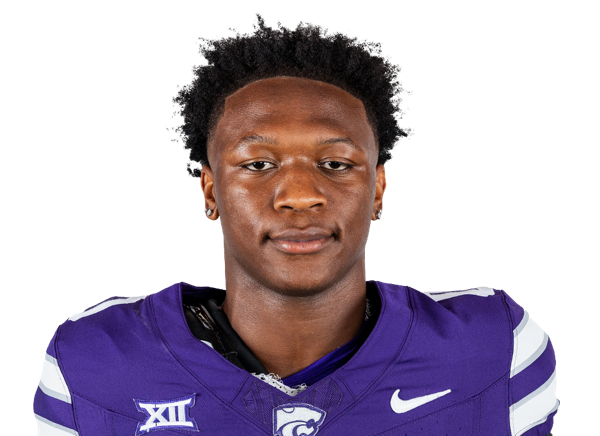 Amarion Fortenberry#8 | 2 | 2 | 0 | 1 | 1 | 0 | 0 |
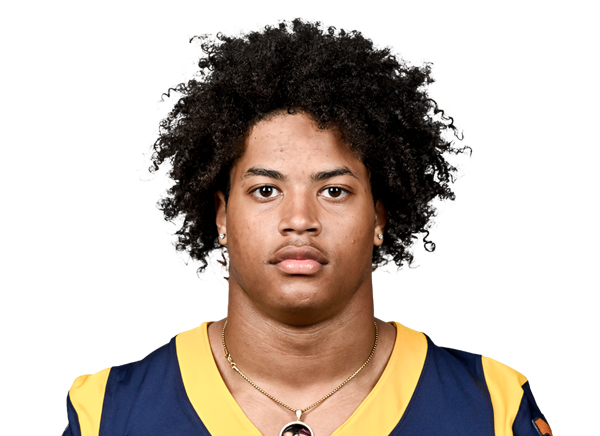 Israel Boyce#9 | 2 | 2 | 0 | 0 | 0 | 0 | 0 |
 Easton Bonnett#49 | 2 | 2 | 0 | 0 | 0 | 0 | 0 |
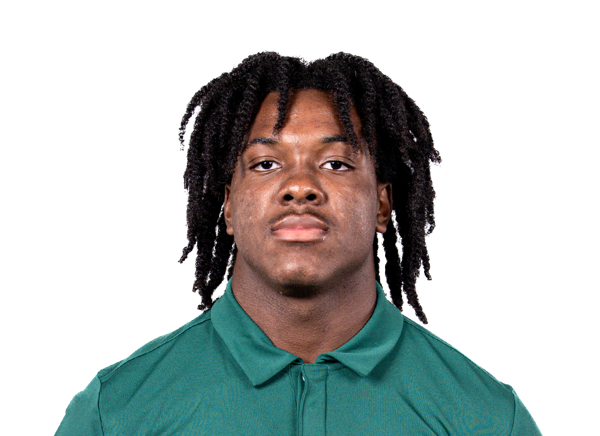 Ashton Mosley#33 | 2 | 1 | 0 | 1 | 0 | 0 | 0 |
 Gavin Leach#53 | 2 | 1 | 0 | 0 | 0 | 0 | 0 |
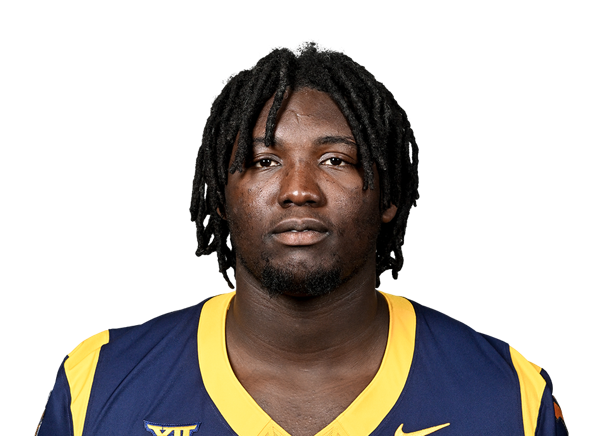 Asani Redwood#11 | 1 | 1 | 0 | 0 | 0 | 0 | 0 |
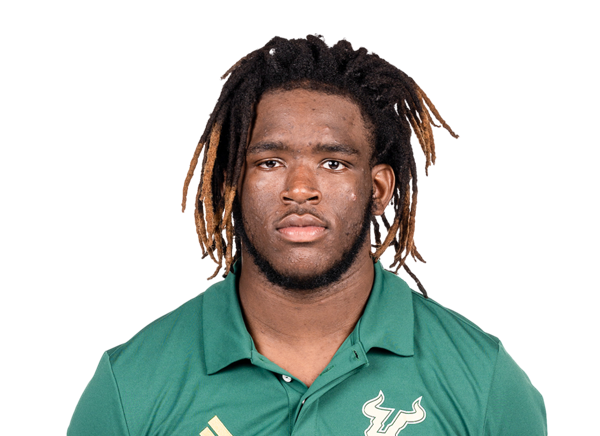 Marcus Williams#98 | 1 | 1 | 0 | 1 | 0 | 0 | 0 |
 Grayson Howard | 1 | 0 | 0 | 0 | 0 | 0 | 0 |
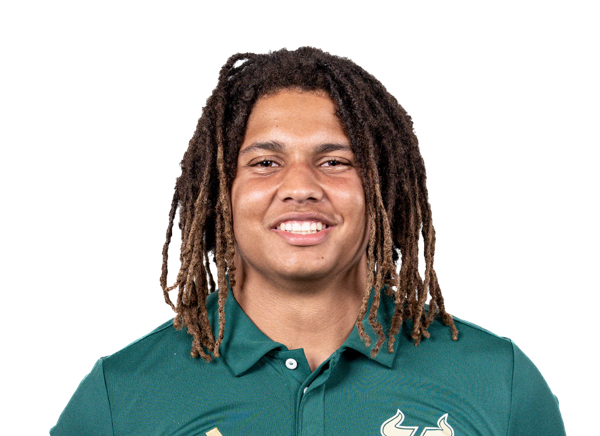 Zavier Hamilton#25 | 1 | 0 | 0 | 0 | 0 | 0 | 0 |
| Major Dillard#77 | 1 | 0 | 0.5 | 0.5 | 0 | 0 | 0 |
 Levi Smiley#18 | 0 | 0 | 0 | 0 | 0 | 3 | 0 |
Florida International| Player | FUM | LOST | REC |
|---|---|---|---|
| JJ Kohl#17 | 1 | 1 | 0 |
 Andre Brown#18 | 1 | 0 | 0 |
Florida International| Player | FG | PCT | LONG | XP | PTS |
|---|---|---|---|---|---|
 Robert Czeremcha#48 | 1/1 | 100.0 | 29 | 0/0 | 3 |
South Florida| Player | FG | PCT | LONG | XP | PTS |
|---|---|---|---|---|---|
 Nico Gramatica#7 | 4/4 | 100.0 | 53 | 1/1 | 13 |
Florida International| Player | NO | YDS | AVG | TB | In 20 | LONG |
|---|---|---|---|---|---|---|
| Felix Visser#43 | 2 | 79 | 39.5 | 1 | 0 | 41 |
South Florida| Player | NO | YDS | AVG | TB | In 20 | LONG |
|---|---|---|---|---|---|---|
 Luke Goater#39 | 4 | 189 | 47.3 | 0 | 2 | 59 |
Florida International| Player | NO | YDS | AVG | LONG | TD |
|---|---|---|---|---|---|
| Andre Brown#18 | 1 | 3 | 3.0 | 3 | 0 |
Florida International| Player | NO | YDS | AVG | LONG | TD |
|---|---|---|---|---|---|
| Maguire Anderson#2 | 2 | 13 | 6.5 | 11 | 0 |
South Florida| Player | INT | YDS | TD |
|---|---|---|---|
| Tavin Ward#2 | 1 | 20 | 0 |
| Tayvion Beasley#15 | 1 | 5 | 0 |
Drive Summary
USF
Punt
35
FIU
Downs
57
USF
Field Goal
39
FIU
Downs
25
USF
Field Goal
15
FIU
Punt
40
USF
Punt
21
FIU
End Of Half
37
FIU
Field Goal
63
USF
Punt
-7
FIU
Punt
12
USF
Punt
5
FIU
Interception
6
USF
Touchdown
35
FIU
Fumble
11
USF
Field Goal
24
FIU
Interception
11
USF
Field Goal
30
FIU
Touchdown
87
Injury Report
No current injury report is available for this matchup.
Head-to-Head
Historical meetings are not available for this matchup.
Game Information
StageWeek 1
Season2026
KickoffSat, Sep 5, 7:00 pm
VenueRaymond James Stadium
LocationTampa, FL
SurfaceGrass
BroadcastESPN+
Division Standings
FBS — Conference USA
| Team | W | L | T | Pct | PF | PA | Home | Away | Strk |
|---|---|---|---|---|---|---|---|---|---|
 Delaware | 4 | 4 | 0 | 0.500 | 233 | 220 | 3-1 | 1-3 | W2 |
 Kennesaw State | 2 | 6 | 0 | 0.250 | 184 | 203 | 1-3 | 1-3 | W1 |
 Middle Tennessee | 4 | 4 | 0 | 0.500 | 191 | 237 | 3-1 | 1-3 | L1 |
 Missouri State | 3 | 5 | 0 | 0.375 | 195 | 247 | 3-1 | 0-4 | W1 |
 Sam Houston | 1 | 7 | 0 | 0.125 | 144 | 201 | 1-3 | 0-4 | L5 |
 Western Kentucky | 3 | 5 | 0 | 0.375 | 170 | 249 | 2-1 | 1-4 | L1 |
| Florida International | 3 | 5 | 0 | 0.375 | 151 | 163 | 3-1 | 0-4 | L3 |
 Jacksonville State | 6 | 2 | 0 | 0.750 | 215 | 159 | 4-0 | 2-2 | W5 |
 Liberty | 7 | 1 | 0 | 0.875 | 270 | 108 | 4-0 | 3-1 | W7 |
 New Mexico State | 3 | 5 | 0 | 0.375 | 172 | 202 | 2-2 | 1-3 | L1 |
FBS — American Conference
| Team | W | L | T | Pct | PF | PA | Home | Away | Strk |
|---|---|---|---|---|---|---|---|---|---|
 Army | 5 | 3 | 0 | 0.625 | 269 | 204 | 3-1 | 2-2 | L1 |
 Memphis | 7 | 2 | 0 | 0.778 | 338 | 212 | 5-0 | 2-2 | W2 |
 Navy | 2 | 6 | 0 | 0.250 | 221 | 239 | 2-2 | 0-4 | L3 |
| South Florida | 6 | 2 | 0 | 0.750 | 216 | 116 | 4-1 | 2-1 | W2 |
 Temple | 2 | 6 | 0 | 0.250 | 189 | 213 | 1-4 | 1-2 | L3 |
 Tulsa | 4 | 4 | 0 | 0.500 | 238 | 195 | 2-2 | 2-2 | L1 |
 UTSA | 7 | 1 | 0 | 0.875 | 268 | 208 | 4-0 | 3-1 | W5 |
 Florida Atlantic | 5 | 3 | 0 | 0.625 | 302 | 286 | 4-0 | 1-3 | L1 |
 Rice | 1 | 7 | 0 | 0.125 | 168 | 254 | 1-3 | 0-4 | L7 |
 Charlotte | 1 | 7 | 0 | 0.125 | 165 | 322 | 0-4 | 1-3 | L1 |
 East Carolina | 4 | 4 | 0 | 0.500 | 192 | 193 | 3-1 | 1-3 | W1 |
 North Texas | 6 | 2 | 0 | 0.750 | 350 | 255 | 4-0 | 2-2 | W5 |
 Tulane | 4 | 4 | 0 | 0.500 | 180 | 203 | 3-1 | 1-3 | W1 |
 UAB | 4 | 4 | 0 | 0.500 | 173 | 202 | 4-0 | 0-4 | L1 |
Florida International
8th in CUSA
VS
South Florida
Quarterbacks & Specialists
#17
JJ Kohl
#43
Felix Visser
Receivers & Backs
#2
Maguire Anderson
#18
Andre Brown
#1
Anthony Carrie
#13
Tyson Carter
#8
Greg Gaines III
#22
Sterling Joseph
#3
Devonte Lyons
#7
Kyle McNeal
#6
Eric Nelson Jr.
#4
James Resar
Jojo Stone
#9
Jackson Verdugo
Defensive Line & Linebackers
#97
Elisha Baldridge
#11
Percy Courtney Jr.
#90
Anthony Cunningham
#33
DeeJay Holmes Jr.
#15
Nathan Jennings
#22
Brayshawn Littlejohn
#12
RJ Moss Jr.
#91
Kyrie Samuel
#88
Elijah Simmons
#5
Kenton Simmons
#95
Anthony Smith
#18
Pickle Stewart
#9
Josiah Taylor
#16
Nick Watson
Defensive Backs
#2
DeAndre Boykins
#7
Jai-Ayviauynn Celestine
Da'Vontae Floyd
#8
Ryan Gadson
#6
Lawrence Johnson
#4
Wesley Miller
#1
Shamir Sterlin
#10
Ormond Wallace
Other
#48
Robert Czeremcha
Quarterbacks & Specialists
#49
Easton Bonnett
#39
Luke Goater
#3
Michael Van Buren Jr.
Receivers & Backs
#4
Arhmad Branch
#87
Luke Clyburn
#2
Jason Collins Jr.
#5
D.J. Crowther
#80
Joshua Porter
#1
Bryson Rodgers
#8
Wyatt Sullivan
Defensive Line & Linebackers
#77
Major Dillard
#25
Zavier Hamilton
#1
C.J. Hicks
#6
Rodney Hill
Grayson Howard
#28
Ryan Jenkins
#40
Gavin Leach
#33
Ashton Mosley
#11
Asani Redwood
#7
Sam Robinson
#18
Levi Smiley
#98
Marcus Williams
#4
Michael Williams II
Defensive Backs
#15
Tayvion Beasley
#9
Israel Boyce
#8
Amarion Fortenberry
#16
Teddy Foster
#5
Ayden Jackson
#31
Jair Murphy
#35
Herlin Perry Jr.
#2
Tavin Ward
Other
#7
Nico Gramatica
Florida International
8th in CUSA
VS
South Florida
7th in American
Passing
57.6
Completion Percentage
63.9
140
Completions
117
3.30
Interception Percentage
0.00
8
Interceptions
0
68
Longest Pass
42
1,755
Net Passing Yards
1,287
250.7
Net Passing Yards Per Game
183.9
243
Passing Attempts
183
4.50
Passing Touchdown %
3.30
11
Passing Touchdowns
6
126.4
Passer Rating
133.5
7
Total Sacks
13
60
Sack Yards Lost
87
7.2
Yards Per Pass Attempt
7.0
1,755
Passing Yards
1,287
0
Passing Fumbles Lost
0
7
Team Games Played
7
377.6
Yards Per Game
325.7
20.1
Total Points Per Game
26.6
141
Total Points
186
15
Total Touchdowns
22
250.7
Passing Yards Per Game
183.9
140-243
Comp-Att
117-183
7-60
Sacks-Yards Lost
13-87
Rushing
243
Rushing Attempts
233
888
Rushing Yards
993
3.7
Yards Per Rush Attempt
4.3
27
Long Rushing
45
0
20+ Yard Rushing Plays
0
4
Rushing Touchdowns
15
126.9
Rushing Yards Per Game
141.9
0
Rushing Fumbles
0
0
Rushing Fumbles Lost
0
45
Rushing 1st downs
57
7
Team Games Played
7
2,643
Total Yards
2,280
493
Total Offensive Plays
429
20.1
Total Points Per Game
26.6
141
Total Points
186
15
Total Touchdowns
22
Receiving
140
Receptions
117
0
Receiving Targets
0
1,755
Receiving Yards
1,287
1,755
Receiving Yards
1,287
11
Receiving Touchdowns
6
68
Long Reception
42
0
20+ Yard Receiving Plays
0
250.7
Receiving Yards Per Game
183.9
0
Receiving Fumbles
0
0
Receiving Fumbles Lost
0
810
Receiving Yards After Catch
761
77
Receiving First Downs
66
7
Team Games Played
7
12.5
Yards Per Reception
11.0
20.1
Total Points Per Game
26.6
141
Total Points
186
15
Total Touchdowns
22
Miscellaneous
131
Total 1st downs
136
45
Rushing 1st downs
57
77
Passing 1st downs
66
9
1st downs by penalty
13
51
Third Down Conversions
31
110
Third Down Attempts
77
46.36
3rd down %
40.26
8
Fourth Down Conversions
5
19
First Downs Attempts
8
42.11
4th down %
62.50
50
Total Penalties
36
388
Total Penalty Yards
272
13590
Possession Time Seconds
11724
0.00
Red Zone Field Goal Percentage
0.00
0.00
Red Zone Scoring Percentage
0.00
0.00
Red Zone Efficiency Percentage
0.00
0.00
Red Zone Touchdown Percentage
0.00
14
Total Takeaways
5
10
Total Giveaways
4
4
Turnover Ratio
1
0
Fumbles Lost
0
51-110
3rd down efficiency
31-77
8-19
4th down efficiency
5-8
50-388
Total-Yards
36-272
Defense
249
Solo Tackles
268
172
Assist Tackles
194
421
Total Tackles
462
14
Sacks
14
90
Sack Yards
75
53
Stuffs
69
21
Passes Defended
13
10.4
Average Interception Yards
12.5
24
Long Interception
20
0
Miscellaneous Touchdowns
0
1
Kicks Blocked
0
36
Tackles For Loss
42
7
Team Games Played
7
Defensive Interceptions
5
Interceptions
2
52
Interception Yards
25
0
Interception Touchdowns
0
5-52
INT: Total
2-25
General
8
Fumbles
6
4
Forced Fumbles
3
6
Fumbles Recovered
5
0
Fumbles Touchdowns
1
7
Games Played
7
8-0
Fumbles-Lost
6-0
Returning
9
Kick Returns
8
177
Kick Return Yards
147
19.7
Yards Per Kick Return
18.4
54
Long Kick Return
33
0
Kick Return Touchdowns
0
14
Punt Returns
5
92
Punt Return Yards
40
6.6
Yards Per Punt Return
8.0
13
Long Punt Return
27
0
Punt Return Touchdowns
0
0
Punt Return Fair Catches
0
0
Kick Return Fumbles Lost
0
0
Punt Return Fumbles Lost
0
7
Team Games Played
7
14-92
Punt: Total
5-40
Kicking
12
Field Goal Made
10
17
Field Goal Attempts
13
70.6
Field Goal Percentage
76.9
52
Long Field Goal Made
53
0
Field Goal Attempts 1-19
0
3
Field Goal Attempts 20-29
3
7
Field Goal Attempts 30-39
5
6
Field Goal Attempts 40-49
3
1
Field Goal Attempts 50+
2
11
Extra Points Made
22
12
Extra Point Attempts
22
91.7
Extra Point Percentage
100.0
0
Field Goals Made 1-19
0
3
Field Goals Made 20-29
3
6
Field Goals Made 30-39
4
2
Field Goals Made 40-49
2
1
Field Goals Made 50+
1
47
Total Kicking Points
52
7
Team Games Played
7
39
Touchback Percentage
42
0.0
Average Kickoff Return Yards
0.0
0
Kickoff Return Yards
0
0
Kickoff Returns
0
0-0
Kickoffs: Total
0-0
12-17
FG: Good-Attempts
10-13
Punting
21
Punts
24
813
Punt Yards
1,092
55
Long Punt
59
38.7
Gross Average Punt Yards
45.5
38.7
Net Average Punt Yards
45.5
0
Punts Blocked
0
7
Punts Inside 20
13
1
Touchbacks
2
9
Fair Catches
8
6
Punt Returns
7
0
Punt Return Yards
0
0.0
Average Punt Return Yards
0.0
7
Team Games Played
7
21-813
Punt: Total Yards
24-1,092
Scoring
4
Rushing Touchdowns
15
11
Receiving Touchdowns
6
0
Return Touchdowns
0
15
Total Touchdowns
22
12
Field Goals
10
11
Kick Extra Points
22
2
Total Two Point Conversions
0
141
Total Points
186
20.1
Total Points Per Game
26.6