

Fresno State vs USC Live Score (5 Sep, 2026)
Score by Quarter
| Team | Q1 | Q2 | Q3 | Q4 | Final |
|---|---|---|---|---|---|
 Fresno State | 0 | 0 | 0 | 0 | 0 |
 USC | 7 | 23 | 2 | 7 | 39 |
Scoring Plays
Q1
9:27
9:27
Tanook Hines 8 Yd pass from Jayden Maiava (Caden Chittenden Kick)
Passing Touchdown
0 – 7
Q2
12:27
12:27
Trent Mosley 68 Yd pass from Jayden Maiava (Caden Chittenden Kick)
Passing Touchdown
0 – 14
Q2
7:09
7:09
Team Safety
Safety
0 – 16
Q2
4:07
4:07
Trent Mosley 9 Yd pass from Jayden Maiava (Caden Chittenden Kick)
Passing Touchdown
0 – 23
Q2
0:14
0:14
Waymond Jordan 2 Yd Run (Caden Chittenden Kick)
Rushing Touchdown
0 – 30
Q3
5:15
5:15
Team Safety
Safety
0 – 32
Q4
5:46
5:46
D. Redeaux run for 5 yds, for a TD (C. Chittenden KICK)
Rushing Touchdown
0 – 39
Game Leaders
Fresno StateUSC
 J. Mandal QB
Passing Yards
 J. Maiava QB
 R. Luke RB
Rushing Yards
 W. Jordan RB
 H. Duvall WR
Receiving Yards
 T. Mosley WR
 K. Thunderbird LB
Tackles
 D. Bryant LB
—
Sacks
 K. Urlacher S
Player Box Score
Fresno State| Player | C/ATT | YDS | AVG | TD | INT | QBR |
|---|---|---|---|---|---|---|
| Jayden Mandal#7 | 7/15 | 77 | 5.1 | 0 | 1 | 9.1 |
USC| Player | C/ATT | YDS | AVG | TD | INT | QBR |
|---|---|---|---|---|---|---|
| Jayden Maiava#14 | 23/25 | 349 | 14.0 | 3 | 0 | 97.9 |
 Jonas Williams#15 | 6/6 | 63 | 10.5 | 0 | 0 | 84.5 |
Fresno State| Player | CAR | YDS | AVG | TD | LONG |
|---|---|---|---|---|---|
| Rayshon Luke#2 | 8 | 21 | 2.6 | 0 | 8 |
 Bryson Donelson#6 | 6 | 15 | 2.5 | 0 | 5 |
 Tariq Thomas#27 | 1 | 9 | 9.0 | 0 | 9 |
 Julius Gillick#24 | 3 | 9 | 3.0 | 0 | 4 |
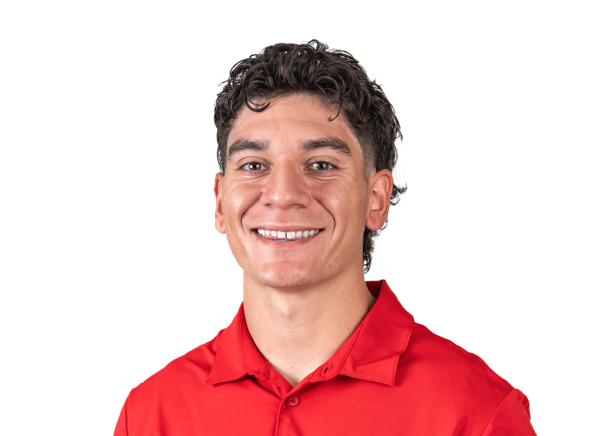 Andrew Chavez#41 | 1 | 3 | 3.0 | 0 | 3 |
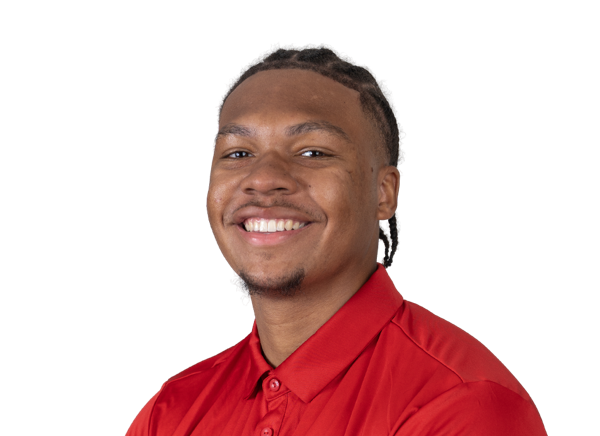 Khristian Martin#3 | 1 | 2 | 2.0 | 0 | 2 |
| Team | 1 | -1 | -1.0 | 0 | 0 |
| Jayden Mandal#7 | 8 | -19 | -2.4 | 0 | 11 |
USC| Player | CAR | YDS | AVG | TD | LONG |
|---|---|---|---|---|---|
| Waymond Jordan#2 | 11 | 67 | 6.1 | 1 | 16 |
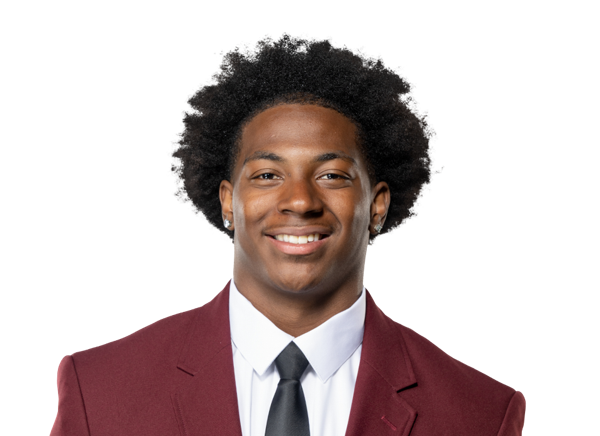 King Miller#8 | 15 | 45 | 3.0 | 0 | 10 |
| Shahn Alston#22 | 4 | 20 | 5.0 | 0 | 10 |
| Deshonne Redeaux#6 | 2 | 7 | 3.5 | 1 | 5 |
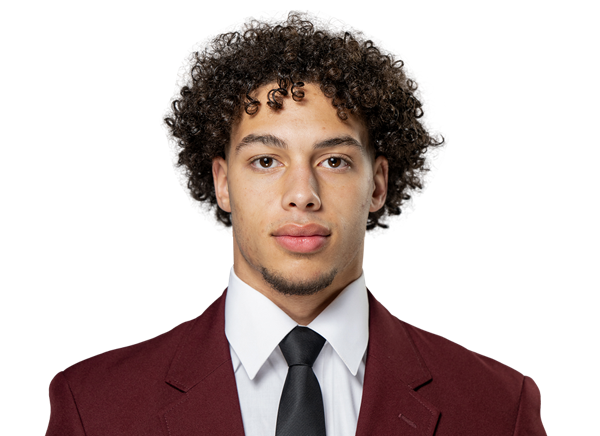 Riley Wormley#27 | 1 | 4 | 4.0 | 0 | 4 |
| Team | 1 | -1 | -1.0 | 0 | 0 |
| Jayden Maiava#14 | 3 | -2 | -0.7 | 0 | 2 |
Fresno State| Player | REC | YDS | AVG | TD | LONG |
|---|---|---|---|---|---|
| Harold Duvall#19 | 2 | 34 | 17.0 | 0 | 17 |
 Jahlil McClain#1 | 1 | 13 | 13.0 | 0 | 13 |
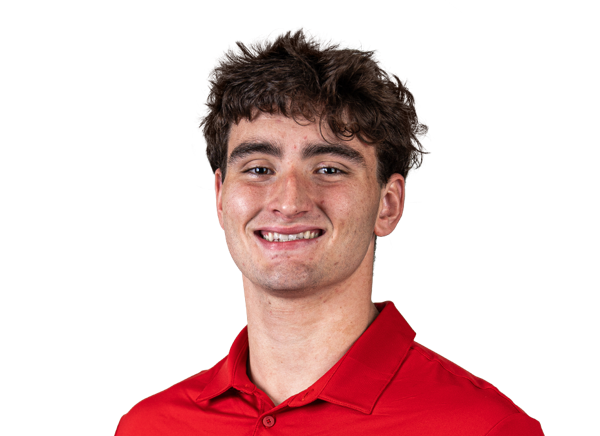 Gavin Correia#86 | 1 | 12 | 12.0 | 0 | 12 |
| Rayshon Luke#2 | 1 | 7 | 7.0 | 0 | 7 |
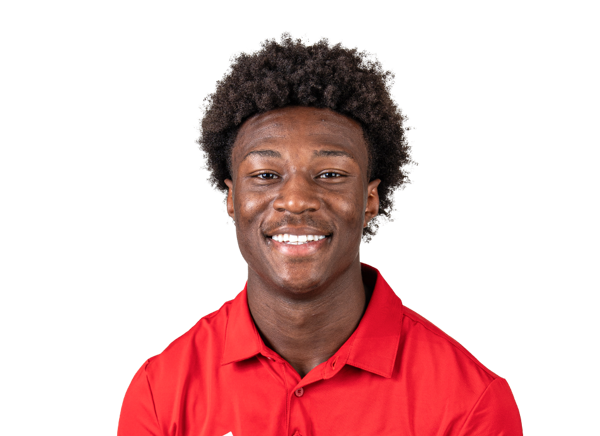 Ezekiel Avit | 1 | 6 | 6.0 | 0 | 6 |
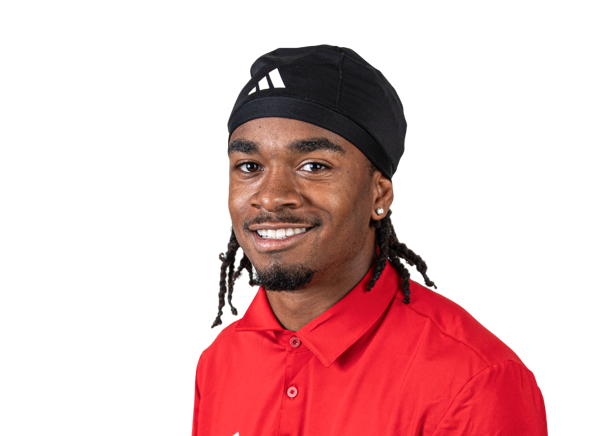 Jayon Farrar#11 | 1 | 5 | 5.0 | 0 | 5 |
USC| Player | REC | YDS | AVG | TD | LONG |
|---|---|---|---|---|---|
| Trent Mosley#4 | 4 | 104 | 26.0 | 2 | 68 |
| Kayden Dixon-Wyatt#17 | 6 | 102 | 17.0 | 0 | 31 |
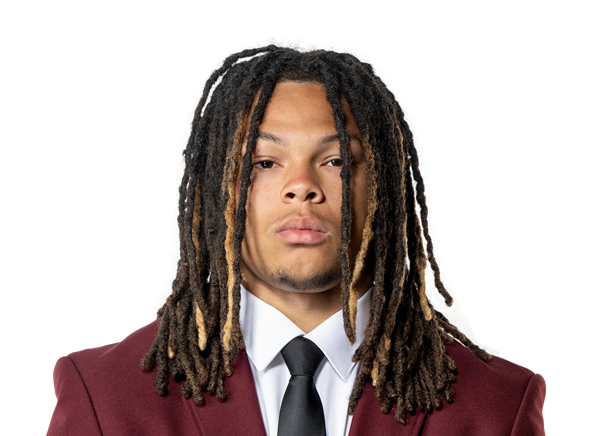 Corey Simms#10 | 2 | 45 | 22.5 | 0 | 34 |
 Zacharyus Williams | 3 | 41 | 13.7 | 0 | 23 |
| Mark Bowman#19 | 3 | 30 | 10.0 | 0 | 15 |
| Tron Baker#85 | 1 | 27 | 27.0 | 0 | 27 |
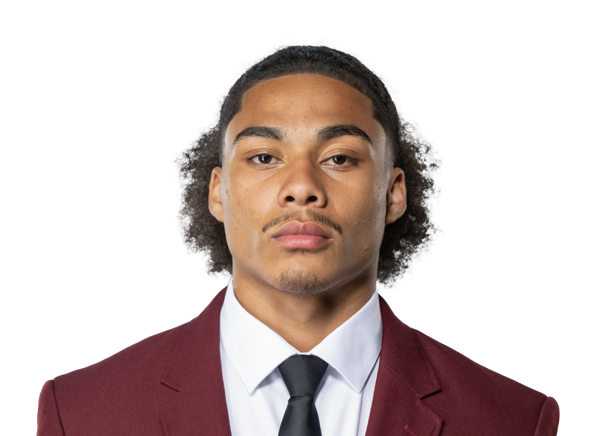 Tanook Hines#16 | 2 | 18 | 9.0 | 1 | 10 |
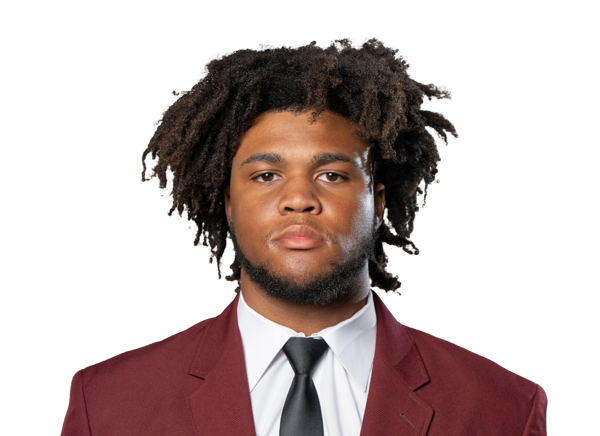 Walter Matthews#23 | 1 | 12 | 12.0 | 0 | 12 |
| Waymond Jordan#2 | 2 | 12 | 6.0 | 0 | 10 |
| Riley Wormley#27 | 1 | 7 | 7.0 | 0 | 7 |
| King Miller#8 | 2 | 6 | 3.0 | 0 | 6 |
 Carson Tabaracci#24 | 1 | 4 | 4.0 | 0 | 4 |
| Ethan Feaster#1 | 1 | 4 | 4.0 | 0 | 4 |
Fresno State| Player | TOT | SOLO | SACKS | TFL | PD | QB HUR | TD |
|---|---|---|---|---|---|---|---|
| K'vion Thunderbird#1 | 9 | 6 | 0 | 2 | 0 | 0 | 0 |
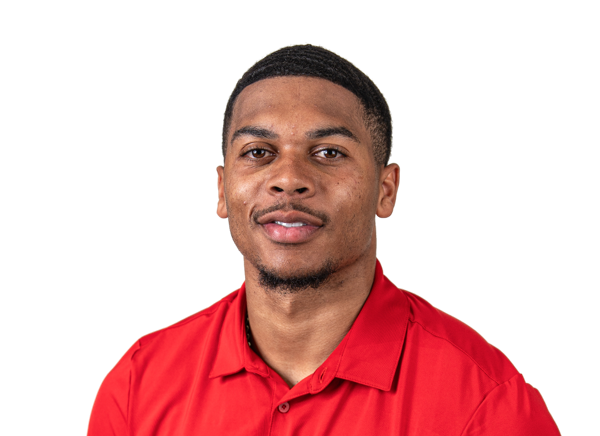 Simeon Harris#5 | 7 | 5 | 0 | 0 | 0 | 0 | 0 |
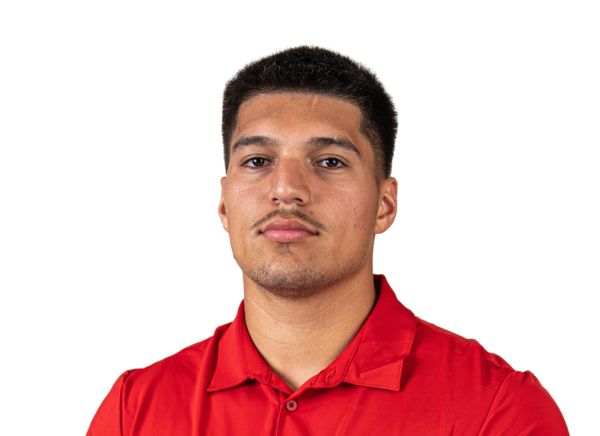 Tytus Khajavi#35 | 7 | 3 | 0 | 0 | 0 | 0 | 0 |
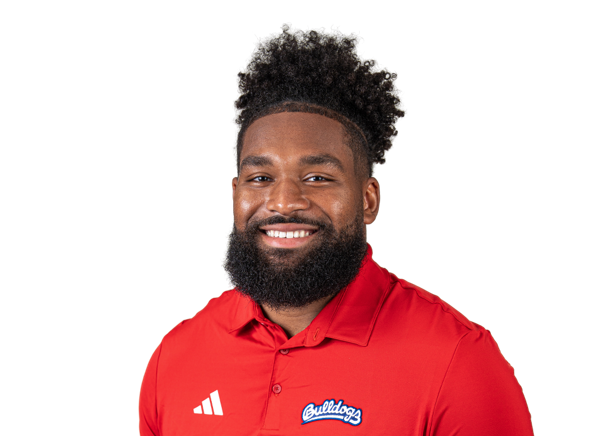 Martin Owusu#8 | 7 | 2 | 0 | 0 | 0 | 0 | 0 |
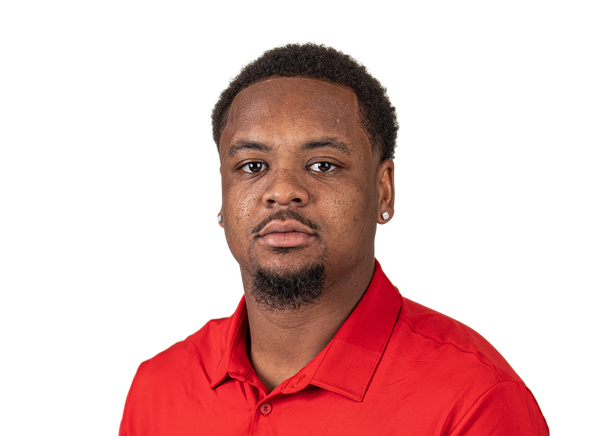 Jahzon Jacks#6 | 7 | 1 | 0 | 1.5 | 0 | 0 | 0 |
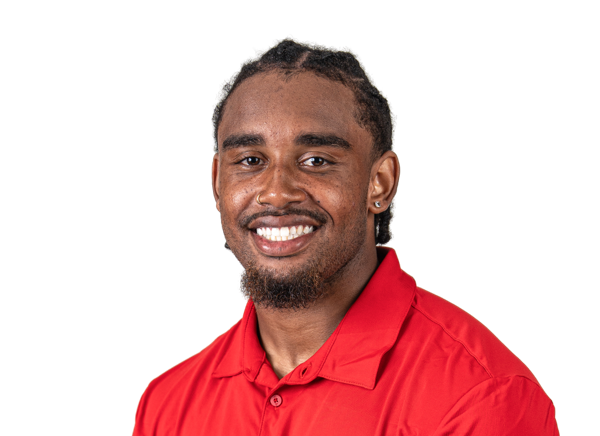 RJ Regan#20 | 5 | 3 | 0 | 0 | 0 | 0 | 0 |
 Ethan Tierney#4 | 5 | 2 | 0 | 0 | 0 | 0 | 0 |
 Deijon Laffitte | 4 | 3 | 0 | 0 | 0 | 0 | 0 |
 Dylan Hampsten#11 | 4 | 3 | 0 | 1 | 0 | 0 | 0 |
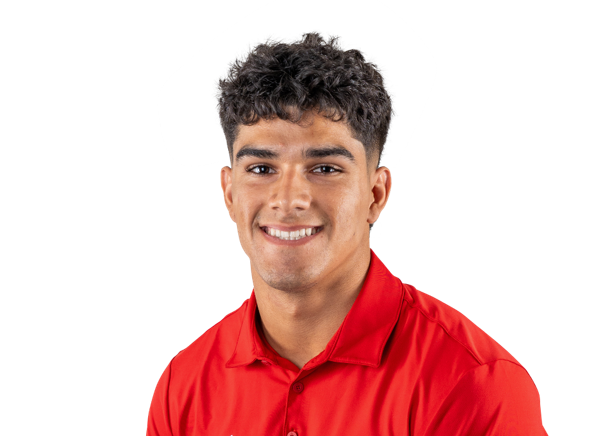 Jaden Carrillo#3 | 4 | 2 | 0 | 0 | 0 | 0 | 0 |
 Logan Studt#18 | 4 | 0 | 0 | 0 | 0 | 0 | 0 |
 Ryan Wilson#37 | 3 | 3 | 0 | 0 | 0 | 0 | 0 |
 Tommy Nix#36 | 3 | 2 | 0 | 0 | 0 | 0 | 0 |
 Taylor Powell#33 | 3 | 1 | 0 | 0.5 | 0 | 0 | 0 |
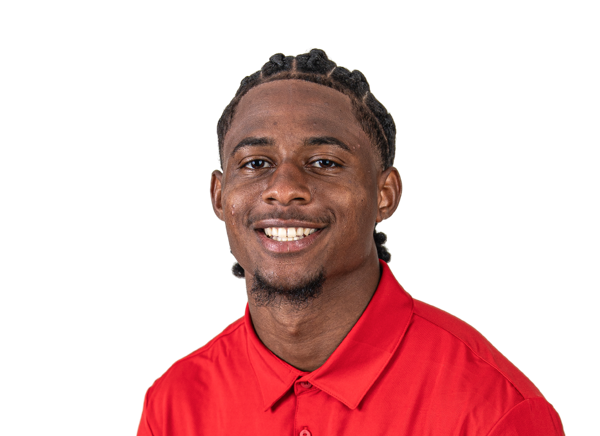 Kiontre Harris#31 | 2 | 2 | 0 | 0 | 0 | 0 | 0 |
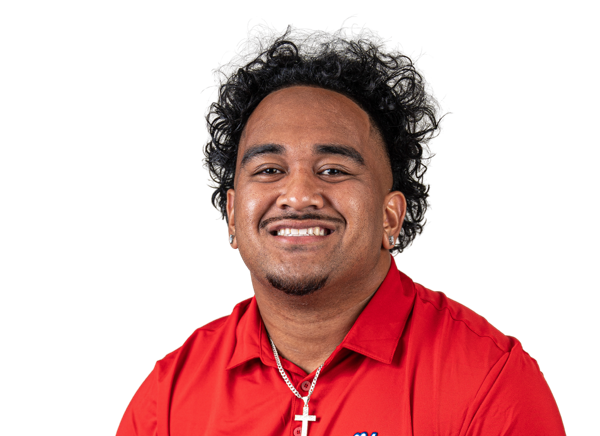 Jairus Satele#56 | 2 | 0 | 0 | 0 | 0 | 0 | 0 |
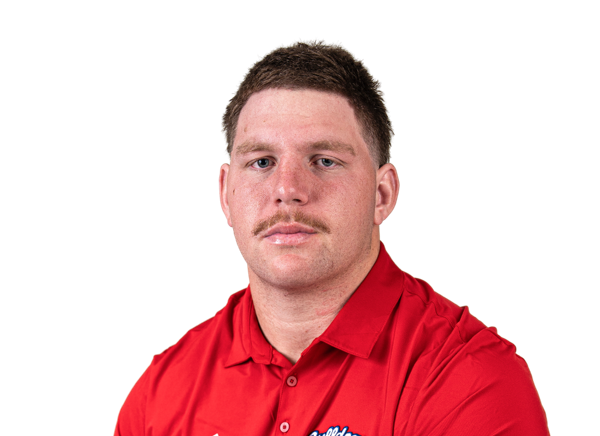 Logan Goodspeed#99 | 2 | 0 | 0 | 0 | 0 | 0 | 0 |
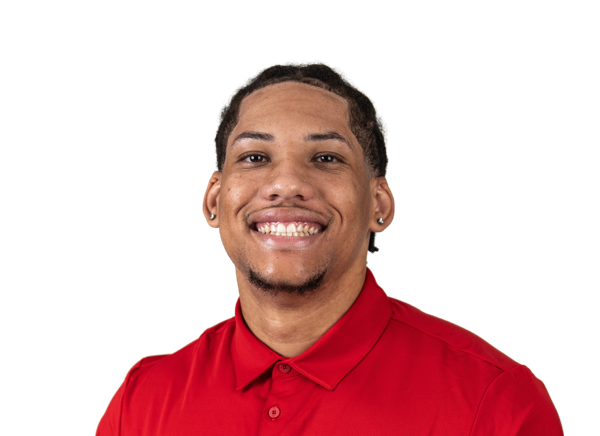 Justin Johnson#25 | 1 | 1 | 0 | 0 | 0 | 0 | 0 |
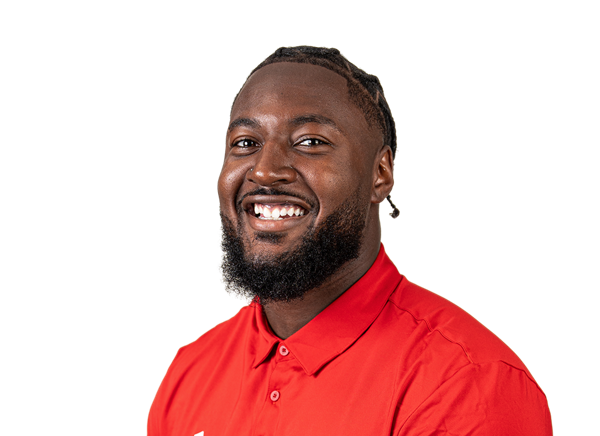 Merhauti Xepera#9 | 1 | 0 | 0 | 0 | 0 | 0 | 0 |
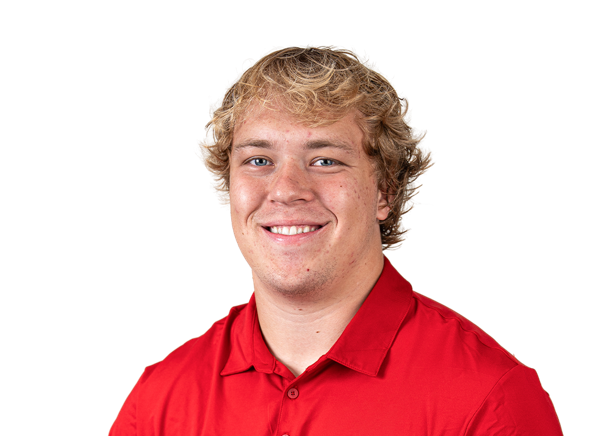 Maverick Noonan#95 | 1 | 0 | 0 | 0 | 0 | 0 | 0 |
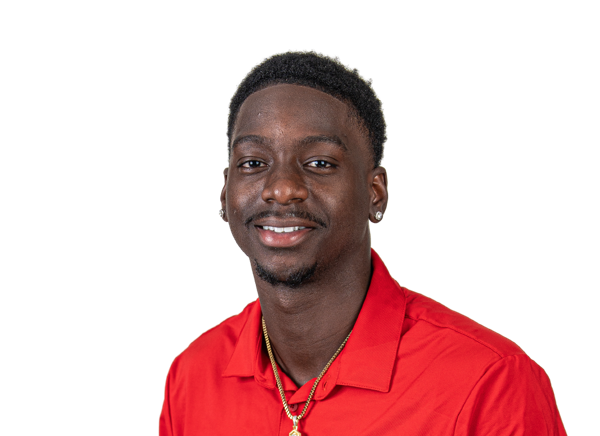 Loyall Mouzon#7 | 1 | 0 | 0 | 0 | 0 | 0 | 0 |
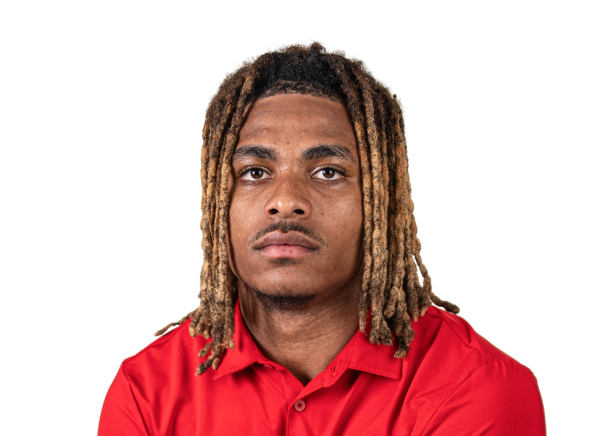 Gerayas Grimes#27 | 1 | 0 | 0 | 0 | 0 | 0 | 0 |
 Lucas Blumling#42 | 1 | 0 | 0 | 0 | 0 | 0 | 0 |
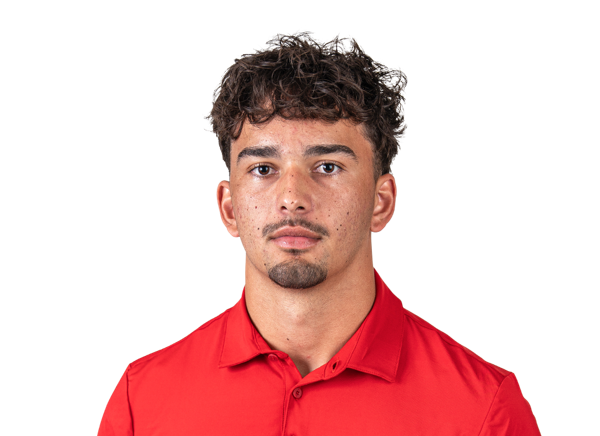 Niko Baumgartner#43 | 1 | 0 | 0 | 0 | 0 | 0 | 0 |
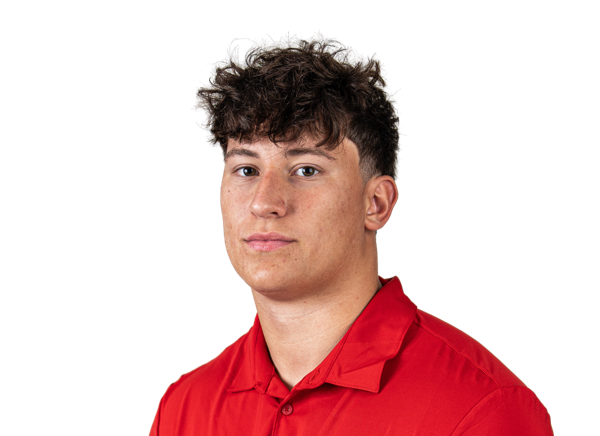 Jaydon Sutko#40 | 1 | 0 | 0 | 0 | 0 | 0 | 0 |
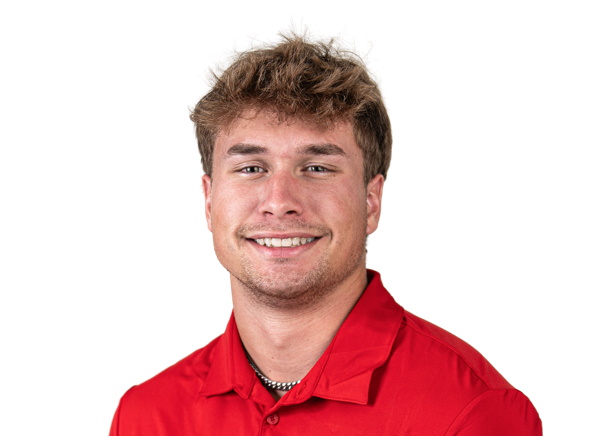 Ethan Rossetti#52 | 1 | 0 | 0 | 0 | 0 | 0 | 0 |
USC| Player | TOT | SOLO | SACKS | TFL | PD | QB HUR | TD |
|---|---|---|---|---|---|---|---|
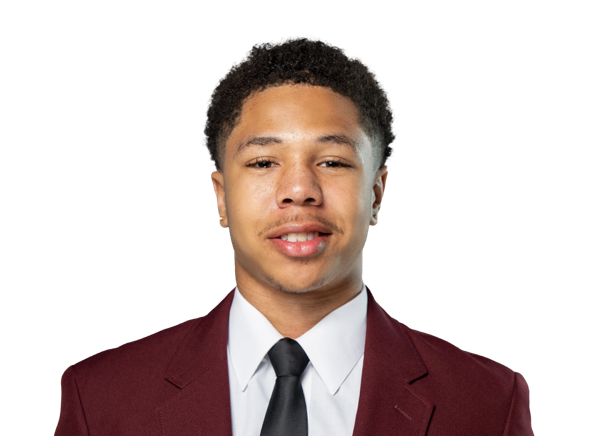 Alex Graham#7 | 4 | 1 | 1 | 1.5 | 0 | 1 | 0 |
| Deven Bryant#17 | 4 | 0 | 0 | 0 | 0 | 0 | 0 |
| Kennedy Urlacher#9 | 3 | 3 | 2 | 2 | 0 | 0 | 0 |
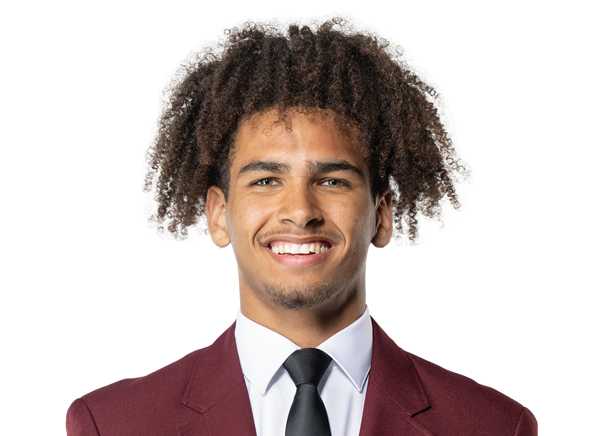 Jadyn Ramos#95 | 3 | 2 | 1 | 1 | 0 | 0 | 0 |
| Talanoa Ili#22 | 3 | 2 | 0 | 0 | 0 | 0 | 0 |
 Desman Stephens II#8 | 3 | 1 | 0 | 0 | 0 | 0 | 0 |
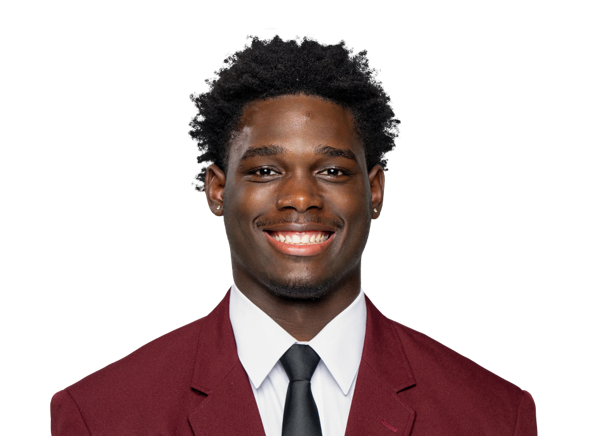 Kameryn Crawford#1 | 3 | 1 | 0 | 0 | 0 | 0 | 0 |
 Jontez Williams | 3 | 0 | 0 | 0 | 0 | 0 | 0 |
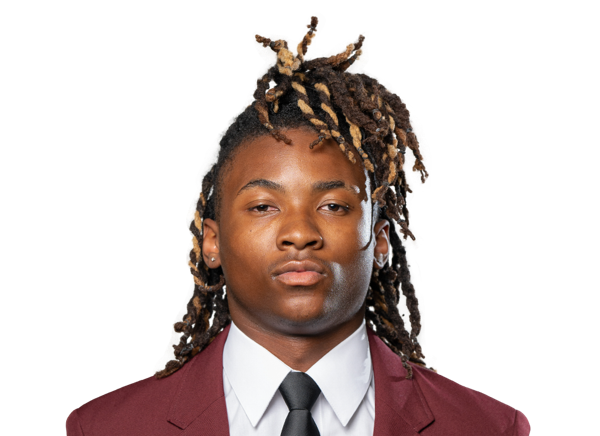 Isaiah Rubin#38 | 2 | 2 | 0 | 1 | 0 | 0 | 0 |
 Jadyn Walker#15 | 2 | 2 | 0 | 0 | 0 | 0 | 0 |
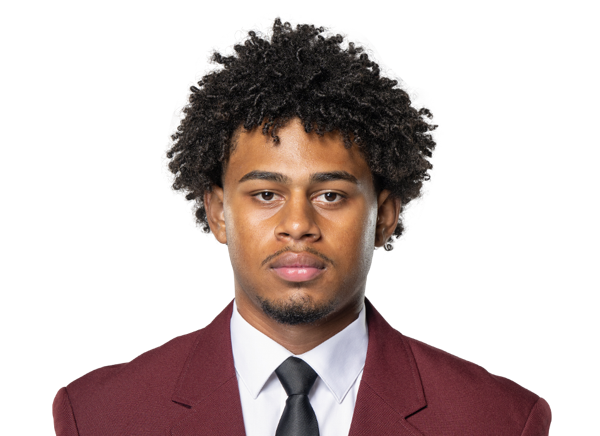 RJ Sermons#21 | 2 | 2 | 0 | 0 | 0 | 0 | 0 |
 Luke Wafle#94 | 2 | 1 | 0 | 0 | 0 | 0 | 0 |
 Carrington Pierce#28 | 2 | 1 | 0 | 0 | 0 | 0 | 0 |
 Zuriah Fisher#18 | 2 | 0 | 0 | 0 | 0 | 0 | 0 |
 Alex VanSumeren#91 | 2 | 0 | 0 | 0.5 | 0 | 0 | 0 |
 Christian Pierce#6 | 2 | 0 | 0 | 0 | 0 | 0 | 0 |
 Floyd Boucard#88 | 2 | 0 | 0 | 0 | 0 | 0 | 0 |
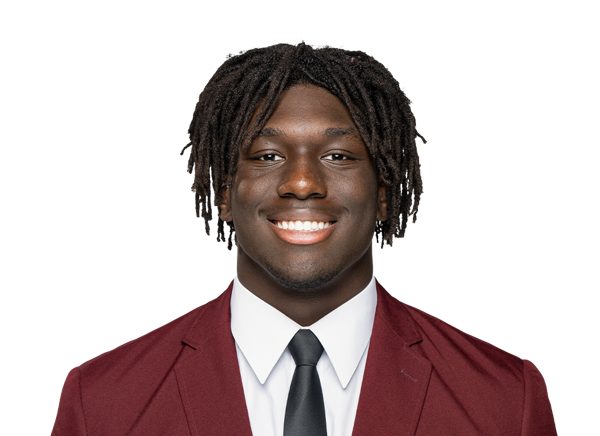 Jide Abasiri#97 | 1 | 1 | 1 | 1 | 0 | 1 | 0 |
 Ta'Mere Robinson#14 | 1 | 1 | 0 | 0 | 0 | 1 | 0 |
 Tomuhini Topui#52 | 1 | 0 | 0 | 0 | 0 | 0 | 0 |
| Simote Katoanga#49 | 1 | 0 | 0 | 0 | 0 | 0 | 0 |
Fresno State| Player | FUM | LOST | REC |
|---|---|---|---|
| Jayden Mandal#7 | 1 | 1 | 0 |
| RJ Regan#20 | 0 | 0 | 1 |
| Tytus Khajavi#35 | 0 | 0 | 1 |
USC| Player | FUM | LOST | REC |
|---|---|---|---|
| Kayden Dixon-Wyatt#17 | 1 | 1 | 0 |
| Waymond Jordan#2 | 1 | 1 | 0 |
| Deshonne Redeaux#6 | 1 | 0 | 0 |
| Floyd Boucard#88 | 0 | 0 | 1 |
USC| Player | FG | PCT | LONG | XP | PTS |
|---|---|---|---|---|---|
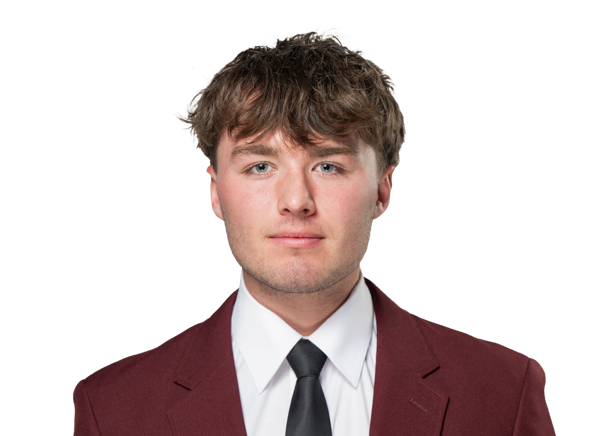 Caden Chittenden#45 | 0/0 | 0.0 | 0 | 5/5 | 5 |
Fresno State| Player | NO | YDS | AVG | TB | In 20 | LONG |
|---|---|---|---|---|---|---|
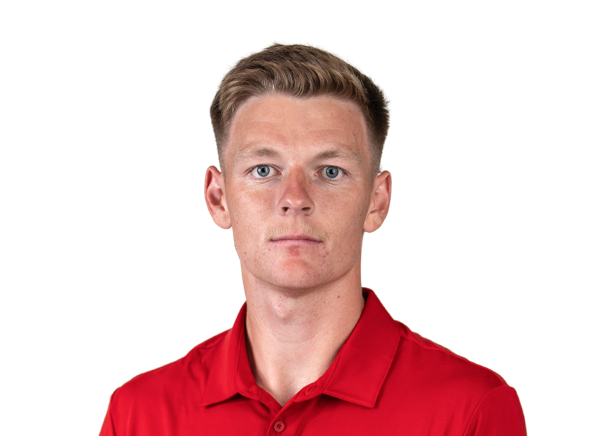 Clay Lawrence#49 | 4 | 162 | 40.5 | 0 | 2 | 48 |
USC| Player | NO | YDS | AVG | TB | In 20 | LONG |
|---|---|---|---|---|---|---|
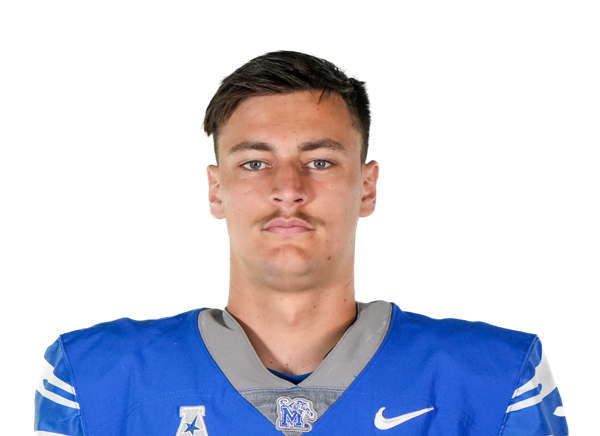 Lachlan Carrigan#35 | 1 | 45 | 45.0 | 1 | 0 | 45 |
Fresno State| Player | NO | YDS | AVG | LONG | TD |
|---|---|---|---|---|---|
 Jordan Malau'ulu#10 | 2 | 23 | 11.5 | 12 | 0 |
USC| Player | NO | YDS | AVG | LONG | TD |
|---|---|---|---|---|---|
| Deshonne Redeaux#6 | 3 | 39 | 13.0 | 20 | 0 |
USC| Player | NO | YDS | AVG | LONG | TD |
|---|---|---|---|---|---|
| Trent Mosley#4 | 2 | 16 | 8.0 | 19 | 0 |
| Zacharyus Williams | 1 | 5 | 5.0 | 5 | 0 |
USC| Player | INT | YDS | TD |
|---|---|---|---|
 Prophet Brown#16 | 1 | 0 | 0 |
Drive Summary
USC
Touchdown
82
FRES
Interception
34
USC
Fumble
42
FRES
Punt
15
USC
Touchdown
83
FRES
Punt
7
USC
Downs
42
FRES
Safety
-13
USC
Touchdown
65
FRES
Fumble
19
USC
Touchdown
38
FRES
End of Half
-1
FRES
Punt
5
USC
Fumble
83
FRES
Safety
-7
USC
Punt
34
FRES
Punt
17
USC
Touchdown
79
FRES
Downs
60
USC
End of Game
-1
Injury Report
No current injury report is available for this matchup.
Head-to-Head
Historical meetings are not available for this matchup.
Game Information
StageWeek 1
Season2026
KickoffFri, Sep 4, 9:00 pm
VenueLos Angeles Memorial Coliseum
LocationLos Angeles, CA
SurfaceGrass
BroadcastFOX
Attendance53,014
Division Standings
FBS — Pac-12 Conference
| Team | W | L | T | Pct | PF | PA | Home | Away | Strk |
|---|---|---|---|---|---|---|---|---|---|
 Colorado State | 3 | 5 | 0 | 0.375 | 284 | 339 | 3-2 | 0-3 | L1 |
 San Diego State | 4 | 5 | 0 | 0.444 | 238 | 309 | 4-1 | 0-4 | W1 |
 Boise State | 7 | 1 | 0 | 0.875 | 287 | 189 | 4-0 | 3-1 | W7 |
| Fresno State | 5 | 3 | 0 | 0.625 | 231 | 168 | 3-1 | 2-2 | W1 |
 Oregon State | 5 | 3 | 0 | 0.625 | 321 | 200 | 3-1 | 2-2 | L1 |
 Texas State | 4 | 4 | 0 | 0.500 | 305 | 256 | 4-1 | 0-3 | L1 |
 Utah State | 3 | 5 | 0 | 0.375 | 135 | 175 | 3-1 | 0-4 | W1 |
 Washington State | 1 | 8 | 0 | 0.111 | 171 | 247 | 1-3 | 0-5 | L6 |
FBS — Big Ten Conference
| Team | W | L | T | Pct | PF | PA | Home | Away | Strk |
|---|---|---|---|---|---|---|---|---|---|
| USC | 7 | 2 | 0 | 0.778 | 292 | 218 | 5-1 | 2-1 | W1 |
 Illinois | 5 | 3 | 0 | 0.625 | 232 | 194 | 3-2 | 2-1 | W3 |
 Indiana | 8 | 1 | 0 | 0.889 | 292 | 112 | 5-1 | 3-0 | W2 |
 Iowa | 6 | 2 | 0 | 0.750 | 226 | 100 | 4-1 | 2-1 | W1 |
 Maryland | 2 | 6 | 0 | 0.250 | 215 | 253 | 1-4 | 1-2 | L6 |
 Michigan | 5 | 3 | 0 | 0.625 | 170 | 131 | 4-2 | 1-1 | W1 |
 Michigan State | 2 | 6 | 0 | 0.250 | 159 | 206 | 2-3 | 0-3 | L6 |
 Minnesota | 5 | 3 | 0 | 0.625 | 202 | 164 | 4-1 | 1-2 | L1 |
 Nebraska | 5 | 3 | 0 | 0.625 | 259 | 125 | 4-2 | 1-1 | L3 |
 Northwestern | 6 | 2 | 0 | 0.750 | 269 | 150 | 5-0 | 1-2 | L1 |
 Ohio State | 6 | 2 | 0 | 0.750 | 293 | 124 | 4-0 | 2-2 | L1 |
 Oregon | 5 | 3 | 0 | 0.625 | 266 | 171 | 4-1 | 1-2 | W1 |
 Penn State | 4 | 4 | 0 | 0.500 | 232 | 149 | 3-2 | 1-2 | W1 |
 Purdue | 3 | 5 | 0 | 0.375 | 236 | 257 | 2-3 | 1-2 | L2 |
 UCLA | 8 | 0 | 0 | 1.000 | 268 | 107 | 5-0 | 3-0 | W8 |
 Washington | 5 | 3 | 0 | 0.625 | 212 | 169 | 3-2 | 2-1 | W2 |
 Rutgers | 2 | 6 | 0 | 0.250 | 222 | 261 | 1-4 | 1-2 | L2 |
 Wisconsin | 5 | 3 | 0 | 0.625 | 189 | 137 | 4-0 | 1-3 | L1 |
Fresno State
5th in Pac-12
VS
USC
7th in Big Ten
Quarterbacks & Specialists
#49
Clay Lawrence
#7
Jayden Mandal
#3
Khristian Martin
#52
Ethan Rossetti
Receivers & Backs
Ezekiel Avit
#41
Andrew Chavez
#86
Gavin Correia
#6
Bryson Donelson
#19
Harold Duvall
#11
Jayon Farrar
#24
Julius Gillick
#2
Rayshon Luke
#10
Jordan Malau'ulu
#1
Jahlil McClain
#27
Tariq Thomas
Defensive Line & Linebackers
#43
Niko Baumgartner
#42
Lucas Blumling
#99
Logan Goodspeed
#11
Dylan Hampsten
#6
Jahzon Jacks
#25
Justin Johnson
#35
Tytus Khajavi
Deijon Laffitte
#36
Tommy Nix
#95
Maverick Noonan
#8
Martin Owusu
#56
Jairus Satele
#18
Logan Studt
#40
Jaydon Sutko
#1
K'vion Thunderbird
#9
Merhauti Xepera
Defensive Backs
#3
Jaden Carrillo
#27
Gerayas Grimes
#31
Kiontre Harris
#5
Simeon Harris
#7
Loyall Mouzon
#33
Taylor Powell
#20
RJ Regan
#4
Ethan Tierney
#37
Ryan Wilson
Quarterbacks & Specialists
#35
Lachlan Carrigan
#14
Jayden Maiava
#15
Jonas Williams
Receivers & Backs
#22
Shahn Alston
#85
Tron Baker
#19
Mark Bowman
#17
Kayden Dixon-Wyatt
#1
Ethan Feaster
#16
Tanook Hines
#2
Waymond Jordan
#23
Walter Matthews
#8
King Miller
#4
Trent Mosley
#6
Deshonne Redeaux
#10
Corey Simms
#24
Carson Tabaracci
Zacharyus Williams
#27
Riley Wormley
Defensive Line & Linebackers
#97
Jide Abasiri
#88
Floyd Boucard
#17
Deven Bryant
#1
Kameryn Crawford
#18
Zuriah Fisher
#22
Talanoa Ili
#49
Simote Katoanga
#95
Jadyn Ramos
#14
Ta'Mere Robinson
#8
Desman Stephens II
#52
Tomuhini Topui
#91
Alex VanSumeren
#94
Luke Wafle
#15
Jadyn Walker
Defensive Backs
#16
Prophet Brown
#7
Alex Graham
#28
Carrington Pierce
#6
Christian Pierce
#38
Isaiah Rubin
#21
RJ Sermons
#9
Kennedy Urlacher
Jontez Williams
Other
#45
Caden Chittenden
Fresno State
5th in Pac-12
VS
USC
7th in Big Ten
Passing
63.2
Completion Percentage
67.5
127
Completions
195
0.50
Interception Percentage
2.10
1
Interceptions
6
73
Longest Pass
68
1,485
Net Passing Yards
2,428
212.1
Net Passing Yards Per Game
303.5
201
Passing Attempts
289
4.50
Passing Touchdown %
6.60
9
Passing Touchdowns
19
139.1
Passer Rating
155.6
15
Total Sacks
12
84
Sack Yards Lost
103
7.4
Yards Per Pass Attempt
8.4
1,485
Passing Yards
2,428
0
Passing Fumbles Lost
0
7
Team Games Played
8
351.1
Yards Per Game
434.5
27.6
Total Points Per Game
32.8
193
Total Points
262
22
Total Touchdowns
34
212.1
Passing Yards Per Game
303.5
127-201
Comp-Att
195-289
15-84
Sacks-Yards Lost
12-103
Rushing
226
Rushing Attempts
271
973
Rushing Yards
1,048
4.3
Yards Per Rush Attempt
3.9
56
Long Rushing
35
0
20+ Yard Rushing Plays
0
13
Rushing Touchdowns
12
139.0
Rushing Yards Per Game
131.0
0
Rushing Fumbles
0
0
Rushing Fumbles Lost
0
47
Rushing 1st downs
69
7
Team Games Played
8
2,458
Total Yards
3,476
442
Total Offensive Plays
572
27.6
Total Points Per Game
32.8
193
Total Points
262
22
Total Touchdowns
34
Receiving
127
Receptions
195
0
Receiving Targets
0
1,485
Receiving Yards
2,428
1,485
Receiving Yards
2,428
9
Receiving Touchdowns
19
73
Long Reception
68
0
20+ Yard Receiving Plays
0
212.1
Receiving Yards Per Game
303.5
0
Receiving Fumbles
0
0
Receiving Fumbles Lost
0
792
Receiving Yards After Catch
1186
69
Receiving First Downs
119
7
Team Games Played
8
11.7
Yards Per Reception
12.5
27.6
Total Points Per Game
32.8
193
Total Points
262
22
Total Touchdowns
34
Miscellaneous
128
Total 1st downs
199
47
Rushing 1st downs
69
69
Passing 1st downs
119
12
1st downs by penalty
11
30
Third Down Conversions
49
84
Third Down Attempts
97
35.71
3rd down %
50.52
2
Fourth Down Conversions
13
7
First Downs Attempts
19
28.57
4th down %
68.42
30
Total Penalties
50
217
Total Penalty Yards
440
12364
Possession Time Seconds
15289
0.00
Red Zone Field Goal Percentage
0.00
0.00
Red Zone Scoring Percentage
0.00
0.00
Red Zone Efficiency Percentage
0.00
0.00
Red Zone Touchdown Percentage
0.00
6
Total Takeaways
10
4
Total Giveaways
8
2
Turnover Ratio
2
0
Fumbles Lost
0
30-84
3rd down efficiency
49-97
2-7
4th down efficiency
13-19
30-217
Total-Yards
50-440
Defense
227
Solo Tackles
272
258
Assist Tackles
144
485
Total Tackles
416
15
Sacks
17
92
Sack Yards
82
58
Stuffs
55
20
Passes Defended
16
9.0
Average Interception Yards
38.3
38
Long Interception
99
0
Miscellaneous Touchdowns
0
0
Kicks Blocked
0
28
Tackles For Loss
32
7
Team Games Played
8
Defensive Interceptions
7
Interceptions
3
63
Interception Yards
115
0
Interception Touchdowns
1
7-63
INT: Total
3-115
General
6
Fumbles
8
3
Forced Fumbles
4
5
Fumbles Recovered
4
0
Fumbles Touchdowns
1
7
Games Played
8
6-0
Fumbles-Lost
8-0
Returning
8
Kick Returns
14
147
Kick Return Yards
219
18.4
Yards Per Kick Return
15.6
27
Long Kick Return
26
0
Kick Return Touchdowns
0
10
Punt Returns
15
95
Punt Return Yards
215
9.5
Yards Per Punt Return
14.3
68
Long Punt Return
86
0
Punt Return Touchdowns
1
0
Punt Return Fair Catches
0
0
Kick Return Fumbles Lost
0
0
Punt Return Fumbles Lost
0
7
Team Games Played
8
10-95
Punt: Total
15-215
Kicking
13
Field Goal Made
7
15
Field Goal Attempts
11
86.7
Field Goal Percentage
63.6
52
Long Field Goal Made
39
0
Field Goal Attempts 1-19
0
4
Field Goal Attempts 20-29
2
3
Field Goal Attempts 30-39
6
4
Field Goal Attempts 40-49
1
4
Field Goal Attempts 50+
2
18
Extra Points Made
31
19
Extra Point Attempts
31
94.7
Extra Point Percentage
100.0
0
Field Goals Made 1-19
0
4
Field Goals Made 20-29
2
2
Field Goals Made 30-39
5
3
Field Goals Made 40-49
0
4
Field Goals Made 50+
0
57
Total Kicking Points
52
7
Team Games Played
8
54
Touchback Percentage
65
0.0
Average Kickoff Return Yards
0.0
0
Kickoff Return Yards
0
0
Kickoff Returns
0
0-0
Kickoffs: Total
0-0
13-15
FG: Good-Attempts
7-11
Punting
29
Punts
13
1,222
Punt Yards
644
55
Long Punt
56
42.1
Gross Average Punt Yards
49.5
42.1
Net Average Punt Yards
49.5
0
Punts Blocked
0
17
Punts Inside 20
5
0
Touchbacks
2
15
Fair Catches
3
8
Punt Returns
5
0
Punt Return Yards
0
0.0
Average Punt Return Yards
0.0
7
Team Games Played
8
29-1,222
Punt: Total Yards
13-644
Scoring
13
Rushing Touchdowns
12
9
Receiving Touchdowns
19
0
Return Touchdowns
1
22
Total Touchdowns
33
13
Field Goals
7
18
Kick Extra Points
31
2
Total Two Point Conversions
1
193
Total Points
262
27.6
Total Points Per Game
32.8