

Georgia Southern vs Clemson Live Score (13 Sep, 2026)
Score by Quarter
| Team | Q1 | Q2 | Q3 | Q4 | Final |
|---|---|---|---|---|---|
 Georgia Southern |
0 | 7 | 0 | 0 | 7 |
 Clemson |
7 | 9 | 0 | 6 | 22 |
Scoring Plays
Q1
11:01
11:01
C. Vizzina pass to T.J. Moore for 10 yds, for a TD (N. Hauser KICK)
Passing Touchdown
0 – 7
Q2
14:57
14:57
N. Hauser 20 yd FG GOOD
Field Goal Good
0 – 10
Q2
4:54
4:54
N. Hauser 34 yd FG GOOD
Field Goal Good
0 – 13
Q2
3:03
3:03
M. Johnson pass to A. Hollins for 42 yds, for a TD (T. Bryant KICK)
Passing Touchdown
7 – 13
Q2
0:01
0:01
N. Hauser 38 yd FG GOOD
Field Goal Good
7 – 16
Q4
6:26
6:26
N. Hauser 50 yd FG GOOD
Field Goal Good
7 – 19
Q4
3:10
3:10
N. Hauser 49 yd FG GOOD
Field Goal Good
7 – 22
Game Leaders
Georgia SouthernClemson
 M. Johnson QB
Passing Yards
 T. Reynolds QB
 D. Mbadinga RB
Rushing Yards
 G. Davidson RB
 A. Hollins WR
Receiving Yards
 T.J. Moore WR
 E. Anders LB
Sacks
 W. Heldt DE
 R. Myles Jr. LB
Tackles
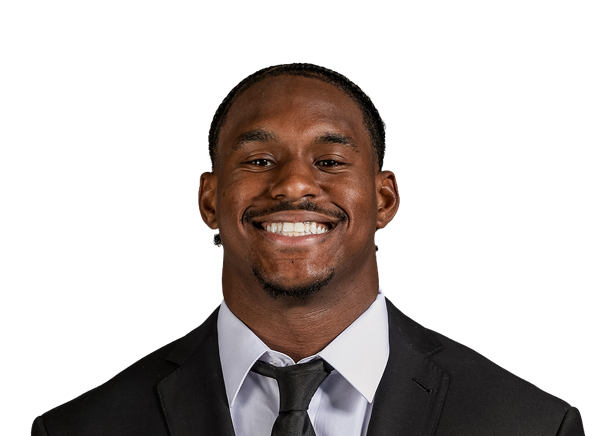 J. Alexander LB
Player Box Score
Georgia Southern| Player | C/ATT | YDS | AVG | TD | INT |
|---|---|---|---|---|---|
| Max Johnson#7 | 27/47 | 244 | 5.2 | 1 | 0 |
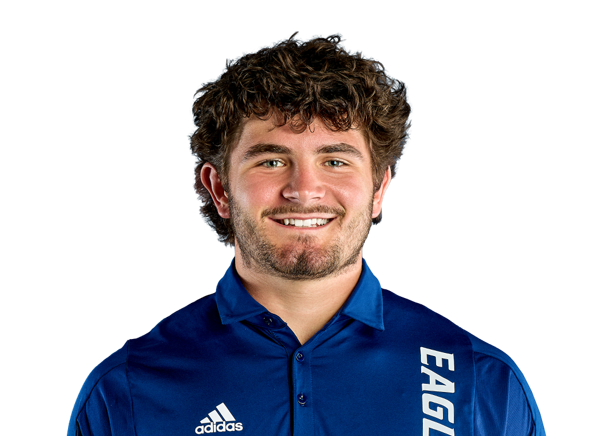 Weston Bryan#9 | 0/1 | 0 | 0.0 | 0 | 0 |
Clemson| Player | C/ATT | YDS | AVG | TD | INT |
|---|---|---|---|---|---|
| Tait Reynolds#2 | 16/27 | 178 | 6.6 | 0 | 0 |
 Christopher Vizzina#17 | 4/7 | 19 | 2.7 | 1 | 1 |
 Team | 0/1 | 0 | 0.0 | 0 | 0 |
Georgia Southern| Player | CAR | YDS | AVG | TD | LONG |
|---|---|---|---|---|---|
| David Mbadinga#6 | 3 | 11 | 3.7 | 0 | 5 |
 Taeo Todd#35 | 4 | 6 | 1.5 | 0 | 5 |
 Josh Dallas#19 | 1 | 4 | 4.0 | 0 | 4 |
| Weston Bryan#9 | 1 | 2 | 2.0 | 0 | 2 |
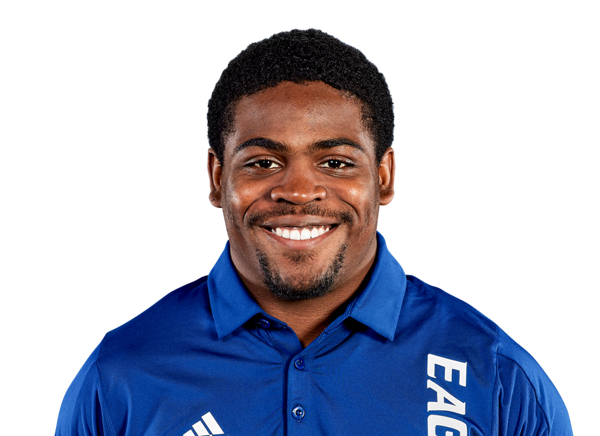 Jamarian Samuel#16 | 3 | 2 | 0.7 | 0 | 3 |
| Max Johnson#7 | 6 | -3 | -0.5 | 0 | 12 |
Clemson| Player | CAR | YDS | AVG | TD | LONG |
|---|---|---|---|---|---|
| Gideon Davidson#8 | 14 | 62 | 4.4 | 0 | 21 |
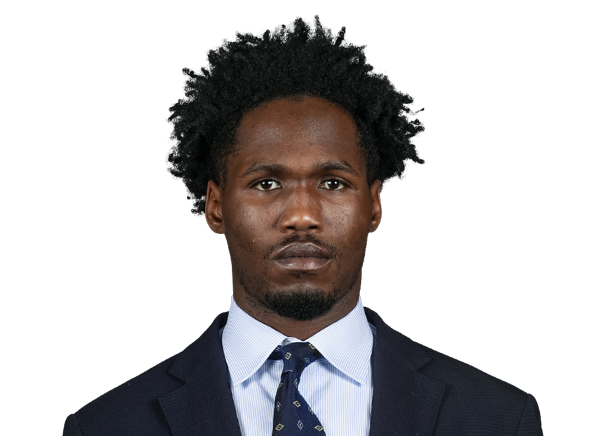 Chris Johnson Jr.#16 | 7 | 53 | 7.6 | 0 | 17 |
| Tait Reynolds#2 | 14 | 38 | 2.7 | 0 | 16 |
 Jarvis Green#21 | 2 | 0 | 0.0 | 0 | 3 |
| Team | 2 | -3 | -1.5 | 0 | 3 |
Georgia Southern| Player | REC | YDS | AVG | TD | LONG |
|---|---|---|---|---|---|
| Ashton Hollins#2 | 5 | 97 | 19.4 | 1 | 42 |
 Jeremiah Ware#81 | 4 | 47 | 11.8 | 0 | 22 |
| Josh Dallas#19 | 9 | 41 | 4.6 | 0 | 11 |
| David Mbadinga#6 | 2 | 30 | 15.0 | 0 | 17 |
 River Helms#87 | 5 | 23 | 4.6 | 0 | 8 |
| Jamarian Samuel#16 | 1 | 4 | 4.0 | 0 | 4 |
 Alex Taylor#88 | 1 | 2 | 2.0 | 0 | 2 |
Clemson| Player | REC | YDS | AVG | TD | LONG |
|---|---|---|---|---|---|
| T.J. Moore#1 | 7 | 103 | 14.7 | 1 | 45 |
 Tyler Brown#6 | 4 | 44 | 11.0 | 0 | 20 |
 Bryant Wesco Jr.#12 | 6 | 35 | 5.8 | 0 | 17 |
 Christian Bentancur#87 | 1 | 9 | 9.0 | 0 | 9 |
 Olsen Patt-Henry#11 | 2 | 6 | 3.0 | 0 | 5 |
Georgia Southern| Player | TOT | SOLO | SACKS | TFL | PD | QB HUR | TD |
|---|---|---|---|---|---|---|---|
| Rashon Myles Jr.#14 | 13 | 8 | 0 | 1 | 0 | 0 | 0 |
 Jakyri Jones#6 | 7 | 3 | 0 | 1 | 0 | 0 | 0 |
 Chance Gamble#31 | 6 | 5 | 0 | 1 | 1 | 0 | 0 |
 Aaron Sears#2 | 6 | 4 | 0 | 0 | 0 | 0 | 0 |
 Brandon Tyson#1 | 5 | 1 | 0 | 0 | 0 | 0 | 0 |
 MJ Stroud#18 | 4 | 4 | 0 | 1 | 1 | 0 | 0 |
 Elijah Fears#94 | 4 | 3 | 1 | 2 | 0 | 0 | 0 |
 Anthony Bynum#4 | 3 | 3 | 0 | 1 | 0 | 0 | 0 |
 Chace Calicut#22 | 3 | 3 | 0 | 0 | 0 | 0 | 0 |
 Noah Mangham#38 | 3 | 2 | 0 | 0 | 0 | 0 | 0 |
 Carlo Thompson#21 | 2 | 2 | 0 | 0 | 0 | 0 | 0 |
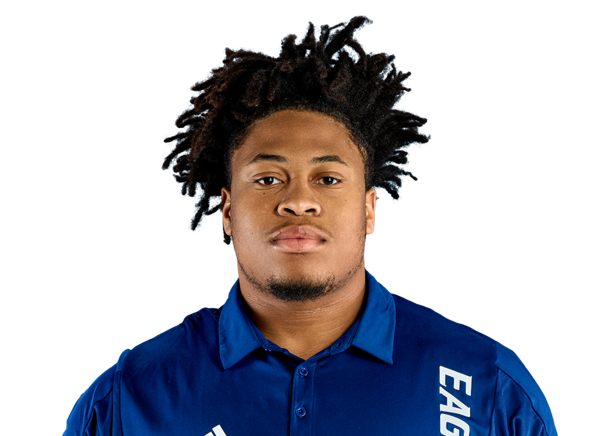 O'Marion Brown#90 | 2 | 2 | 0 | 1 | 0 | 0 | 0 |
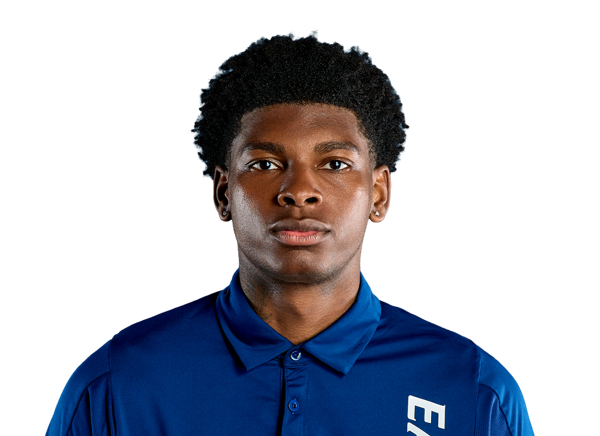 Tracy Hill Jr.#12 | 2 | 1 | 0 | 0 | 0 | 0 | 0 |
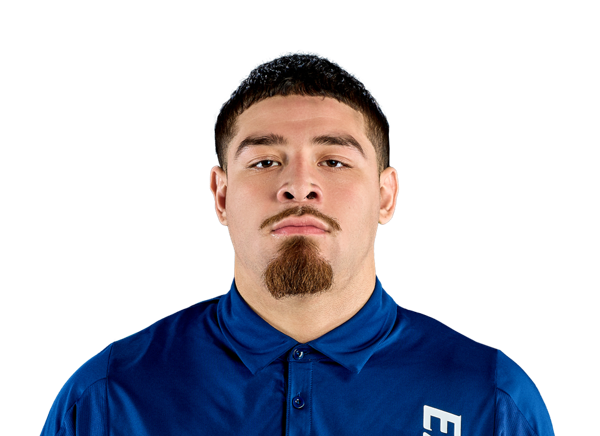 Diego Aviles#5 | 2 | 1 | 0 | 0 | 0 | 0 | 0 |
| Eli Anders#97 | 1 | 1 | 1 | 1 | 0 | 0 | 0 |
 Alex Smith#25 | 1 | 1 | 0 | 0 | 0 | 0 | 0 |
 JaMari Whitehead#34 | 1 | 1 | 0 | 1 | 0 | 0 | 0 |
 Caleb Moore#93 | 1 | 1 | 0 | 0 | 0 | 0 | 0 |
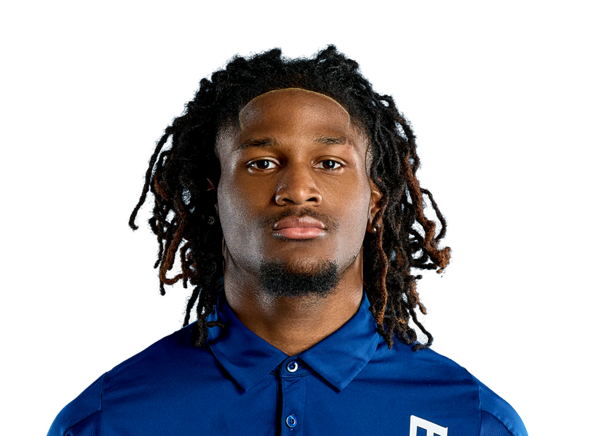 Phillip Gladney#24 | 1 | 1 | 0 | 0 | 0 | 0 | 0 |
 Aidan McCowan#13 | 1 | 1 | 0 | 0 | 0 | 0 | 0 |
 CJ Allen Jr.#30 | 1 | 1 | 0 | 0 | 0 | 0 | 0 |
 Festus Davies#9 | 1 | 1 | 0 | 1 | 0 | 0 | 0 |
Clemson| Player | TOT | SOLO | SACKS | TFL | PD | QB HUR | TD |
|---|---|---|---|---|---|---|---|
| Jeremiah Alexander#7 | 6 | 2 | 0 | 0 | 0 | 0 | 0 |
 Ronan Hanafin#5 | 5 | 4 | 1 | 1 | 0 | 1 | 0 |
 Sammy Brown#47 | 5 | 4 | 0 | 0 | 1 | 0 | 0 |
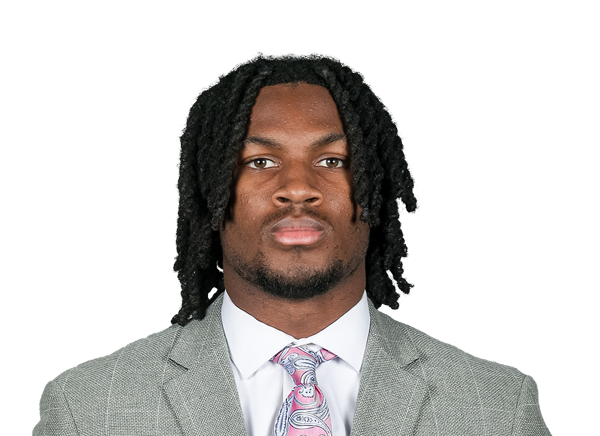 Corey Myrick#22 | 5 | 4 | 0 | 0 | 1 | 0 | 0 |
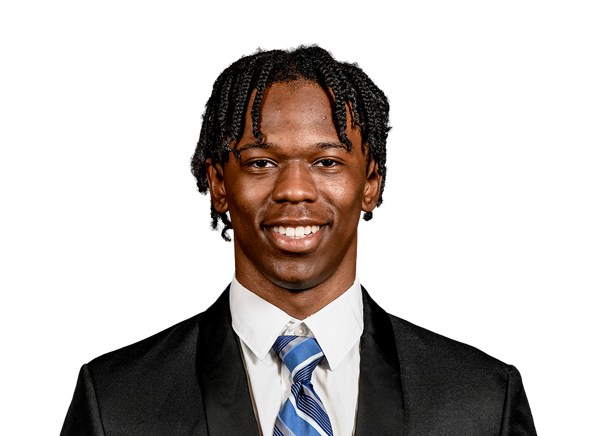 Corian Gipson#8 | 5 | 3 | 0 | 0 | 0 | 1 | 0 |
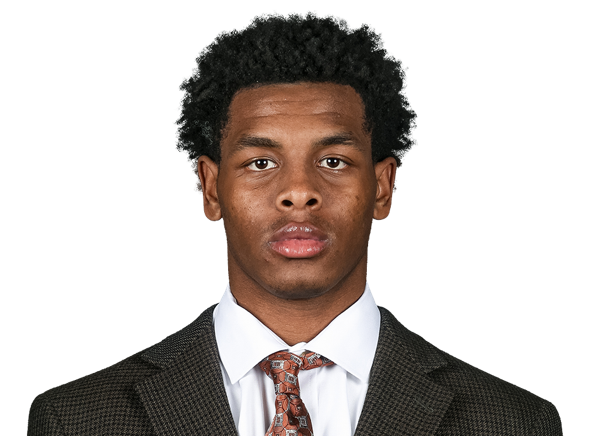 Jerome Carter III#6 | 5 | 3 | 0 | 0 | 0 | 0 | 0 |
| Will Heldt#13 | 3 | 3 | 2 | 3 | 0 | 1 | 0 |
 Elliot Washington II#3 | 3 | 3 | 0 | 0 | 1 | 0 | 0 |
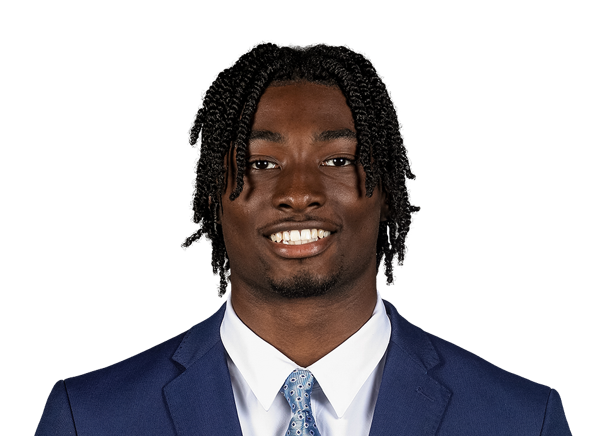 Ashton Hampton#2 | 2 | 2 | 0 | 0 | 3 | 0 | 0 |
 Darien Mayo#49 | 2 | 1 | 0 | 0 | 0 | 0 | 0 |
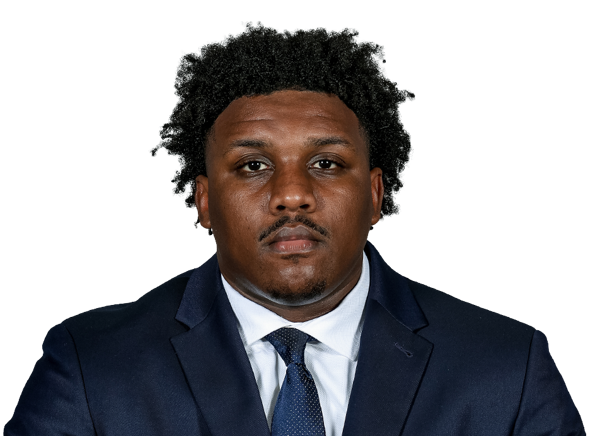 Devarrick Woods#92 | 2 | 1 | 0 | 0 | 0 | 0 | 0 |
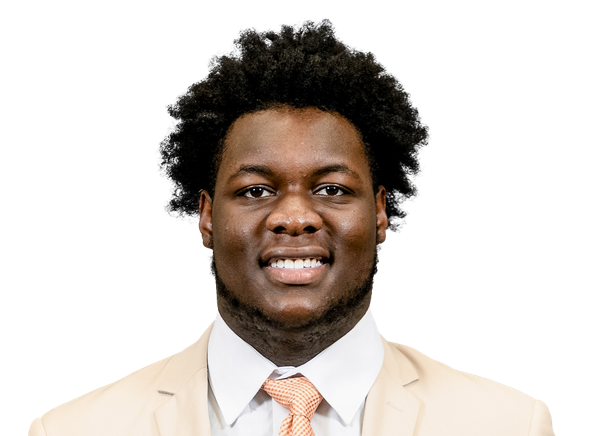 Caden Story#33 | 1 | 1 | 0 | 0 | 0 | 0 | 0 |
 Misun Kelley#10 | 1 | 1 | 0 | 0 | 0 | 0 | 0 |
 Jahiem Lawson#15 | 1 | 0 | 0 | 0.5 | 0 | 0 | 0 |
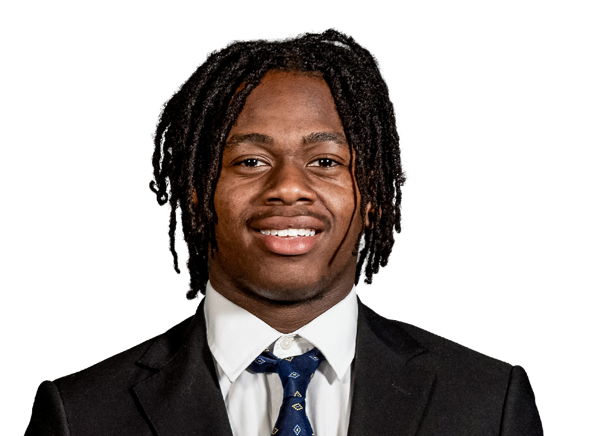 Branden Strozier#1 | 1 | 0 | 0 | 0 | 0 | 0 | 0 |
 Fletcher Cothran#50 | 1 | 0 | 0 | 0.5 | 0 | 0 | 0 |
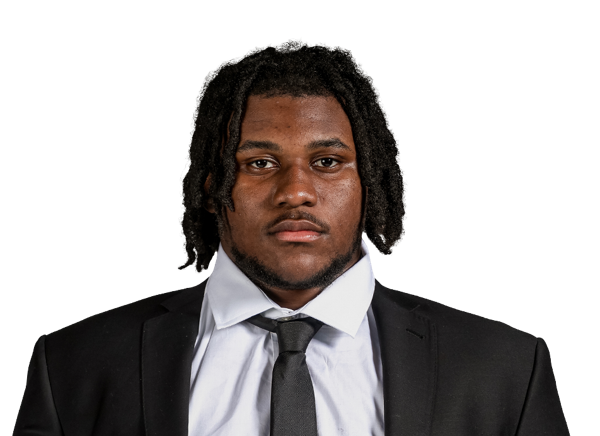 Amare Adams#95 | 0 | 0 | 0 | 0 | 0 | 1 | 0 |
 London Merritt#14 | 0 | 0 | 0 | 0 | 1 | 0 | 0 |
Georgia Southern| Player | FUM | LOST | REC |
|---|---|---|---|
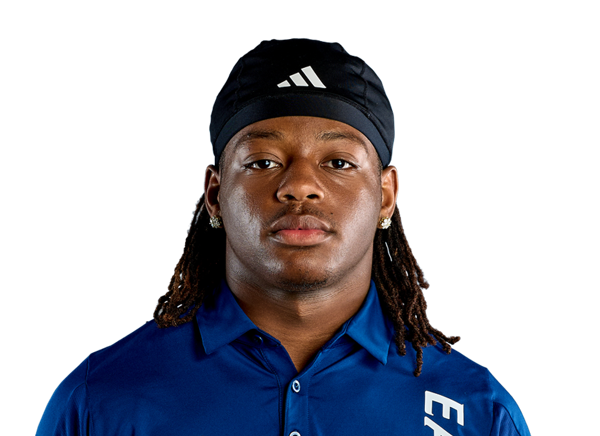 Antavious Murphy#26 | 1 | 1 | 0 |
| Team | 1 | 0 | 0 |
| Max Johnson#7 | 1 | 0 | 0 |
| Jakyri Jones#6 | 0 | 0 | 1 |
Clemson| Player | FUM | LOST | REC |
|---|---|---|---|
| Team | 2 | 0 | 0 |
| Tait Reynolds#2 | 1 | 1 | 0 |
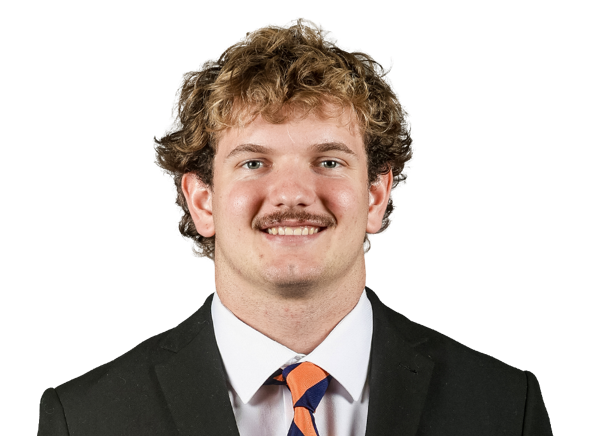 Jackson Reach#46 | 0 | 0 | 1 |
Georgia Southern| Player | FG | PCT | LONG | XP | PTS |
|---|---|---|---|---|---|
 Tripp Bryant#95 | 0/1 | 0.0 | 0 | 1/1 | 1 |
Clemson| Player | FG | PCT | LONG | XP | PTS |
|---|---|---|---|---|---|
 Nolan Hauser#81 | 5/5 | 100.0 | 50 | 1/1 | 16 |
Georgia Southern| Player | NO | YDS | AVG | TB | In 20 | LONG |
|---|---|---|---|---|---|---|
| Alex Smith#25 | 10 | 435 | 43.5 | 0 | 1 | 48 |
Clemson| Player | NO | YDS | AVG | TB | In 20 | LONG |
|---|---|---|---|---|---|---|
 Jack Smith#89 | 7 | 278 | 39.7 | 0 | 5 | 46 |
Clemson| Player | NO | YDS | AVG | LONG | TD |
|---|---|---|---|---|---|
| Chris Johnson Jr.#16 | 1 | 20 | 20.0 | 20 | 0 |
Georgia Southern| Player | NO | YDS | AVG | LONG | TD |
|---|---|---|---|---|---|
| Antavious Murphy#26 | 1 | -5 | -5.0 | 0 | 0 |
Clemson| Player | NO | YDS | AVG | LONG | TD |
|---|---|---|---|---|---|
| Bryant Wesco Jr.#12 | 4 | 36 | 9.0 | 26 | 0 |
Georgia Southern| Player | INT | YDS | TD |
|---|---|---|---|
| Jakyri Jones#6 | 1 | 0 | 0 |
Drive Summary
CLEM
Punt
4
CLEM
Touchdown
27
GASO
Punt
-4
CLEM
0
GASO
Punt
8
CLEM
Fumble
62
GASO
Punt
7
CLEM
Field Goal
15
GASO
Punt
6
CLEM
Punt
13
GASO
Punt
2
CLEM
Punt
13
GASO
Punt
9
CLEM
Field Goal
47
GASO
Touchdown
75
CLEM
Field Goal
15
GASO
Punt
3
CLEM
Punt
14
GASO
Punt
40
CLEM
Punt
46
GASO
Punt
14
CLEM
End Of Quarter
5
GASO
Punt
6
CLEM
Punt
0
GASO
Missed FG
30
CLEM
Field Goal
33
GASO
Downs
5
CLEM
Field Goal
0
GASO
Downs
72
CLEM
End Of Quarter
0
Injury Report
No current injury report is available for this matchup.
Head-to-Head
Historical meetings are not available for this matchup.
Game Information
StageWeek 2
Season2026
KickoffSat, Sep 12, 9:30 pm
VenueMemorial Stadium (Clemson, SC)
LocationClemson, SC
SurfaceGrass
BroadcastACC Network
Division Standings
FBS — Atlantic Coast Conference
| Team | W | L | T | Pct | PF | PA | Home | Away | Strk |
|---|---|---|---|---|---|---|---|---|---|
 Miami | 9 | 1 | 0 | 0.900 | 441 | 198 | 5-0 | 4-1 | W1 |
 SMU | 7 | 3 | 0 | 0.700 | 340 | 255 | 6-1 | 1-2 | L1 |
 Virginia | 5 | 5 | 0 | 0.500 | 269 | 215 | 5-2 | 0-3 | W1 |
 California | 3 | 7 | 0 | 0.300 | 204 | 320 | 2-3 | 1-4 | L4 |
 Duke | 7 | 3 | 0 | 0.700 | 322 | 153 | 4-1 | 3-2 | L1 |
 North Carolina | 5 | 5 | 0 | 0.500 | 258 | 221 | 1-4 | 4-1 | L1 |
 Pittsburgh | 6 | 4 | 0 | 0.600 | 297 | 194 | 5-2 | 1-2 | L1 |
 Virginia Tech | 6 | 4 | 0 | 0.600 | 330 | 255 | 3-2 | 3-2 | L2 |
 Wake Forest | 9 | 1 | 0 | 0.900 | 439 | 150 | 4-1 | 5-0 | W7 |
 Boston College | 4 | 6 | 0 | 0.400 | 204 | 284 | 3-2 | 1-4 | L3 |
| Clemson | 6 | 4 | 0 | 0.600 | 210 | 206 | 3-3 | 3-1 | L1 |
 Louisville | 7 | 3 | 0 | 0.700 | 383 | 247 | 4-1 | 3-2 | W5 |
 Georgia Tech | 3 | 7 | 0 | 0.300 | 235 | 296 | 2-4 | 1-3 | W1 |
 Florida State | 5 | 5 | 0 | 0.500 | 292 | 265 | 3-2 | 2-3 | W2 |
 NC State | 4 | 6 | 0 | 0.400 | 291 | 282 | 4-3 | 0-3 | L2 |
 Stanford | 5 | 5 | 0 | 0.500 | 223 | 358 | 4-1 | 1-4 | W1 |
 Syracuse | 5 | 5 | 0 | 0.500 | 298 | 260 | 2-3 | 3-2 | W1 |
Georgia Southern
2nd in Sun Belt
VS
Clemson
6th in ACC
Quarterbacks & Specialists
#9
Weston Bryan
#7
Max Johnson
#25
Alex Smith
Receivers & Backs
#19
Josh Dallas
#87
River Helms
#2
Ashton Hollins
#6
David Mbadinga
#26
Antavious Murphy
#16
Jamarian Samuel
#88
Alex Taylor
#35
Taeo Todd
#81
Jeremiah Ware
Defensive Line & Linebackers
#30
CJ Allen Jr.
#97
Eli Anders
#5
Diego Aviles
#90
O'Marion Brown
#4
Anthony Bynum
#9
Festus Davies
#94
Elijah Fears
#93
Caleb Moore
#14
Rashon Myles Jr.
#18
MJ Stroud
#1
Brandon Tyson
#34
JaMari Whitehead
Defensive Backs
#22
Chace Calicut
#31
Chance Gamble
#24
Phillip Gladney
#12
Tracy Hill Jr.
#6
Jakyri Jones
#38
Noah Mangham
#13
Aidan McCowan
#2
Aaron Sears
#21
Carlo Thompson
Other
#95
Tripp Bryant
Quarterbacks & Specialists
#46
Jackson Reach
#2
Tait Reynolds
#89
Jack Smith
#17
Christopher Vizzina
Receivers & Backs
#87
Christian Bentancur
#6
Tyler Brown
#8
Gideon Davidson
#21
Jarvis Green
#16
Chris Johnson Jr.
#1
T.J. Moore
#11
Olsen Patt-Henry
#12
Bryant Wesco Jr.
Defensive Line & Linebackers
#95
Amare Adams
#7
Jeremiah Alexander
#47
Sammy Brown
#50
Fletcher Cothran
#13
Will Heldt
#15
Jahiem Lawson
#49
Darien Mayo
#14
London Merritt
#33
Caden Story
#92
Devarrick Woods
Defensive Backs
#6
Jerome Carter III
#8
Corian Gipson
#2
Ashton Hampton
#5
Ronan Hanafin
#10
Misun Kelley
#22
Corey Myrick
#1
Branden Strozier
#3
Elliot Washington II
Other
#81
Nolan Hauser
Georgia Southern
1st in Sun Belt - East
VS
Clemson
5th in ACC
Passing
68.9
Completion Percentage
61.8
261
Completions
194
1.10
Interception Percentage
2.90
4
Interceptions
9
70
Longest Pass
55
2,789
Net Passing Yards
1,806
278.9
Net Passing Yards Per Game
180.6
379
Passing Attempts
314
4.70
Passing Touchdown %
1.30
18
Passing Touchdowns
4
144.5
Passer Rating
108.9
10
Total Sacks
32
84
Sack Yards Lost
180
7.4
Yards Per Pass Attempt
5.8
2,789
Passing Yards
1,806
0
Passing Fumbles Lost
0
10
Team Games Played
10
411.0
Yards Per Game
327.0
27.3
Total Points Per Game
21.0
273
Total Points
210
33
Total Touchdowns
18
278.9
Passing Yards Per Game
180.6
261-379
Comp-Att
194-314
10-84
Sacks-Yards Lost
32-180
Rushing
300
Rushing Attempts
374
1,321
Rushing Yards
1,464
4.4
Yards Per Rush Attempt
3.9
67
Long Rushing
79
0
20+ Yard Rushing Plays
0
14
Rushing Touchdowns
11
132.1
Rushing Yards Per Game
146.4
0
Rushing Fumbles
0
0
Rushing Fumbles Lost
0
68
Rushing 1st downs
86
10
Team Games Played
10
4,110
Total Yards
3,270
689
Total Offensive Plays
720
27.3
Total Points Per Game
21.0
273
Total Points
210
33
Total Touchdowns
18
Receiving
261
Receptions
194
0
Receiving Targets
0
2,789
Receiving Yards
1,806
2,789
Receiving Yards
1,806
18
Receiving Touchdowns
4
70
Long Reception
55
0
20+ Yard Receiving Plays
0
278.9
Receiving Yards Per Game
180.6
0
Receiving Fumbles
0
0
Receiving Fumbles Lost
0
1574
Receiving Yards After Catch
1075
129
Receiving First Downs
80
10
Team Games Played
10
10.7
Yards Per Reception
9.3
27.3
Total Points Per Game
21.0
273
Total Points
210
33
Total Touchdowns
18
Miscellaneous
219
Total 1st downs
187
68
Rushing 1st downs
86
129
Passing 1st downs
80
22
1st downs by penalty
21
58
Third Down Conversions
45
138
Third Down Attempts
151
42.03
3rd down %
29.80
10
Fourth Down Conversions
10
15
First Downs Attempts
18
66.67
4th down %
55.56
79
Total Penalties
66
735
Total Penalty Yards
607
18884
Possession Time Seconds
17693
0.00
Red Zone Field Goal Percentage
0.00
0.00
Red Zone Scoring Percentage
0.00
0.00
Red Zone Efficiency Percentage
0.00
0.00
Red Zone Touchdown Percentage
0.00
14
Total Takeaways
18
10
Total Giveaways
14
4
Turnover Ratio
4
0
Fumbles Lost
0
58-138
3rd down efficiency
45-151
10-15
4th down efficiency
10-18
79-735
Total-Yards
66-607
Defense
315
Solo Tackles
338
274
Assist Tackles
326
589
Total Tackles
664
27
Sacks
27
168
Sack Yards
182
89
Stuffs
82
34
Passes Defended
47
9.5
Average Interception Yards
3.9
33
Long Interception
26
0
Miscellaneous Touchdowns
0
1
Kicks Blocked
0
54
Tackles For Loss
47
10
Team Games Played
10
Defensive Interceptions
6
Interceptions
9
57
Interception Yards
35
1
Interception Touchdowns
0
6-57
INT: Total
9-35
General
11
Fumbles
16
10
Forced Fumbles
6
10
Fumbles Recovered
9
0
Fumbles Touchdowns
2
10
Games Played
10
11-0
Fumbles-Lost
16-0
Returning
15
Kick Returns
17
269
Kick Return Yards
406
17.9
Yards Per Kick Return
23.9
39
Long Kick Return
43
0
Kick Return Touchdowns
0
21
Punt Returns
20
150
Punt Return Yards
223
7.1
Yards Per Punt Return
11.2
42
Long Punt Return
65
0
Punt Return Touchdowns
1
0
Punt Return Fair Catches
0
0
Kick Return Fumbles Lost
0
0
Punt Return Fumbles Lost
0
10
Team Games Played
10
21-150
Punt: Total
20-223
Kicking
14
Field Goal Made
29
20
Field Goal Attempts
32
70.0
Field Goal Percentage
90.6
48
Long Field Goal Made
59
0
Field Goal Attempts 1-19
0
3
Field Goal Attempts 20-29
4
6
Field Goal Attempts 30-39
10
7
Field Goal Attempts 40-49
12
4
Field Goal Attempts 50+
6
33
Extra Points Made
15
33
Extra Point Attempts
15
100.0
Extra Point Percentage
100.0
0
Field Goals Made 1-19
0
3
Field Goals Made 20-29
4
5
Field Goals Made 30-39
10
6
Field Goals Made 40-49
11
0
Field Goals Made 50+
4
75
Total Kicking Points
102
10
Team Games Played
10
65
Touchback Percentage
68
0.0
Average Kickoff Return Yards
0.0
0
Kickoff Return Yards
0
0
Kickoff Returns
0
0-0
Kickoffs: Total
0-0
14-20
FG: Good-Attempts
29-32
Punting
40
Punts
51
1,693
Punt Yards
2,061
50
Long Punt
63
42.3
Gross Average Punt Yards
40.4
42.3
Net Average Punt Yards
40.4
0
Punts Blocked
0
13
Punts Inside 20
22
3
Touchbacks
2
18
Fair Catches
21
8
Punt Returns
9
0
Punt Return Yards
0
0.0
Average Punt Return Yards
0.0
10
Team Games Played
10
40-1,693
Punt: Total Yards
51-2,061
Scoring
14
Rushing Touchdowns
11
18
Receiving Touchdowns
4
0
Return Touchdowns
1
32
Total Touchdowns
18
14
Field Goals
29
33
Kick Extra Points
15
0
Total Two Point Conversions
0
273
Total Points
210
27.3
Total Points Per Game
21.0