

Georgia Tech vs Stanford Live Score (27 Sep, 2026)
Score by Quarter
| Team | Q1 | Q2 | Q3 | Q4 | Final |
|---|---|---|---|---|---|
 Georgia Tech | 10 | 10 | 0 | 7 | 27 |
 Stanford | 7 | 3 | 17 | 7 | 34 |
Scoring Plays
Q1
9:13
9:13
Aidan Birr 33 Yd Field Goal
Field Goal Good
3 – 0
Q1
5:50
5:50
Micah Ford 7 Yd Run (Emmet Kenney Kick)
Rushing Touchdown
3 – 7
Q1
3:12
3:12
Trelain Maddox 9 Yd pass from Alberto Mendoza (Aidan Birr Kick)
Pass Reception
10 – 7
Q2
9:41
9:41
Aidan Birr 23 Yd Field Goal
Field Goal Good
13 – 7
Q2
6:53
6:53
Emmet Kenney 29 Yd Field Goal
Field Goal Good
13 – 10
Q2
3:14
3:14
Trelain Maddox 20 Yd Run (Aidan Birr Kick)
Rushing Touchdown
20 – 10
Q3
10:32
10:32
Emmet Kenney 24 Yd Field Goal
Field Goal Good
20 – 13
Q3
7:08
7:08
Caden High 49 Yd pass from Davis Warren (Emmet Kenney Kick)
Passing Touchdown
20 – 20
Q3
0:04
0:04
Nico Brown 33 Yd pass from Davis Warren (Emmet Kenney Kick)
Passing Touchdown
20 – 27
Q4
11:52
11:52
Caden High 7 Yd pass from Davis Warren (Emmet Kenney Kick)
Passing Touchdown
20 – 34
Q4
9:11
9:11
Jaiven Plummer 23 Yd pass from Alberto Mendoza (Aidan Birr Kick)
Passing Touchdown
27 – 34
Game Leaders
Georgia TechStanford
 A. Mendoza QB
Passing Yards
 D. Warren QB
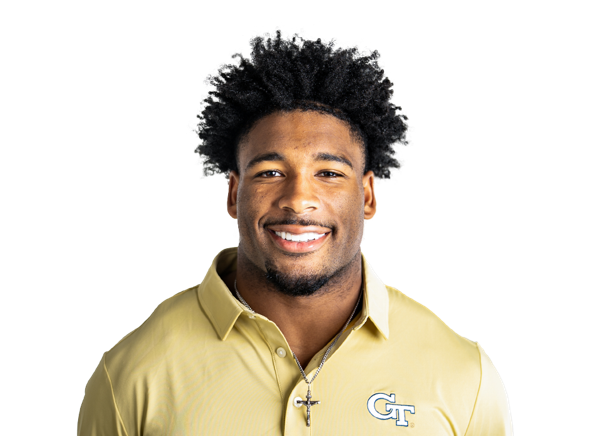 J. Haynes RB
Rushing Yards
 M. Ford RB
 J. Allen WR
Receiving Yards
 N. Brown WR
 N. Carter DE
Sacks
 O. Staples DL
 M. Jordan IV LB
Tackles
 M. Rose LB
Player Box Score
Georgia Tech| Player | C/ATT | YDS | AVG | TD | INT | QBR |
|---|---|---|---|---|---|---|
| Alberto Mendoza#15 | 26/39 | 268 | 6.9 | 2 | 1 | 51.7 |
Stanford| Player | C/ATT | YDS | AVG | TD | INT | QBR |
|---|---|---|---|---|---|---|
| Davis Warren#8 | 22/36 | 396 | 11.0 | 3 | 0 | 86.7 |
Georgia Tech| Player | CAR | YDS | AVG | TD | LONG |
|---|---|---|---|---|---|
| Justice Haynes#22 | 18 | 107 | 5.9 | 0 | 46 |
 Trelain Maddox#1 | 6 | 40 | 6.7 | 1 | 20 |
| Alberto Mendoza#15 | 8 | 16 | 2.0 | 0 | 22 |
Stanford| Player | CAR | YDS | AVG | TD | LONG |
|---|---|---|---|---|---|
| Micah Ford#20 | 19 | 55 | 2.9 | 1 | 7 |
 Sedrick Irvin#26 | 11 | 33 | 3.0 | 0 | 7 |
| Davis Warren#8 | 4 | 4 | 1.0 | 0 | 8 |
 Team | 2 | -2 | -1.0 | 0 | 0 |
 Jacob Butler#80 | 1 | -4 | -4.0 | 0 | 0 |
Georgia Tech| Player | REC | YDS | AVG | TD | LONG |
|---|---|---|---|---|---|
| Jordan Allen#4 | 4 | 64 | 16.0 | 0 | 31 |
 Kevin Roche Jr.#86 | 6 | 59 | 9.8 | 0 | 17 |
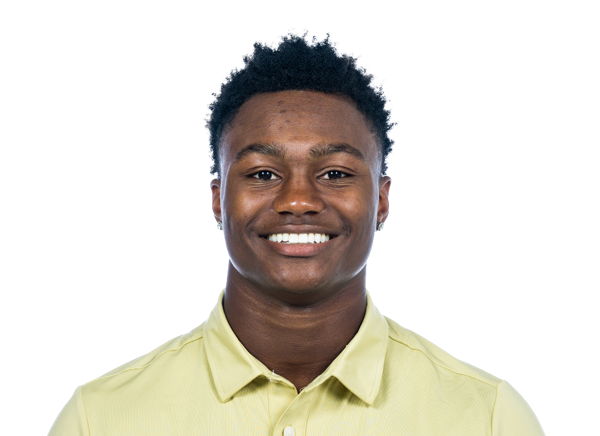 Dalen Penson#7 | 4 | 52 | 13.0 | 0 | 18 |
| Trelain Maddox#1 | 4 | 48 | 12.0 | 1 | 24 |
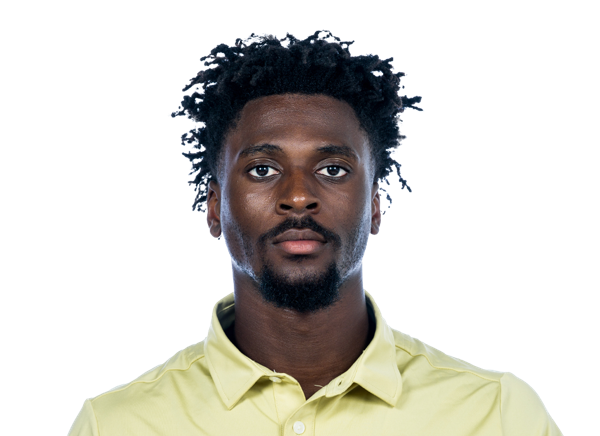 Jaiven Plummer#16 | 1 | 23 | 23.0 | 1 | 23 |
 Chris Corbo#17 | 2 | 15 | 7.5 | 0 | 11 |
 Gavin Harris#8 | 1 | 14 | 14.0 | 0 | 14 |
 Rahkeem Smith#3 | 2 | 12 | 6.0 | 0 | 9 |
| Justice Haynes#22 | 2 | -19 | -9.5 | 0 | 4 |
Stanford| Player | REC | YDS | AVG | TD | LONG |
|---|---|---|---|---|---|
| Nico Brown#23 | 5 | 98 | 19.6 | 1 | 33 |
 Caden High | 4 | 91 | 22.8 | 2 | 49 |
| Zion Robinson#2 | 2 | 65 | 32.5 | 0 | 61 |
 Jordan Onovughe#4 | 3 | 55 | 18.3 | 0 | 30 |
 JonAnthony Hall#11 | 1 | 18 | 18.0 | 0 | 18 |
 Atticus Joseph#89 | 2 | 17 | 8.5 | 0 | 9 |
| Sedrick Irvin#26 | 1 | 9 | 9.0 | 0 | 9 |
 Benji Blackburn#88 | 2 | 9 | 4.5 | 0 | 8 |
| Micah Ford#20 | 2 | 4 | 2.0 | 0 | 6 |
Georgia Tech| Player | TOT | SOLO | SACKS | TFL | PD | QB HUR | TD |
|---|---|---|---|---|---|---|---|
| Melvin Jordan IV | 6 | 4 | 0 | 1 | 0 | 0 | 0 |
 Taje McCoy#41 | 6 | 4 | 0 | 1 | 0 | 0 | 0 |
 Tae Harris#27 | 6 | 4 | 0 | 0.5 | 0 | 0 | 0 |
 Tawfiq Thomas#95 | 5 | 4 | 0 | 1 | 0 | 1 | 0 |
 Cayman Spaulding#1 | 5 | 4 | 0 | 1 | 0 | 0 | 0 |
 Jon Mitchell#12 | 4 | 3 | 0 | 0 | 0 | 0 | 0 |
 Chris Hewitt Jr.#26 | 4 | 3 | 0 | 0 | 0 | 0 | 0 |
| Noah Carter#24 | 4 | 2 | 1 | 1 | 0 | 1 | 0 |
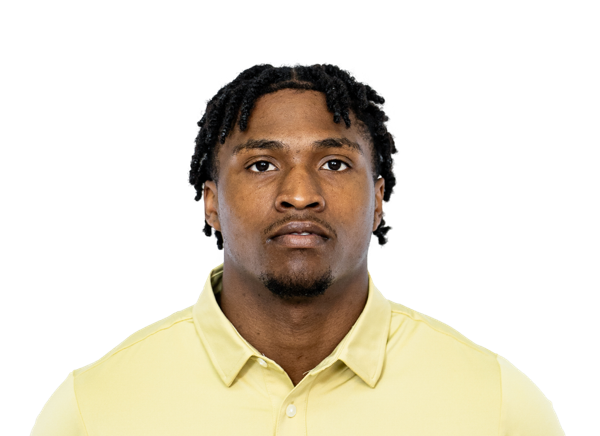 Kelvin Hill#6 | 4 | 2 | 0 | 1.5 | 1 | 0 | 0 |
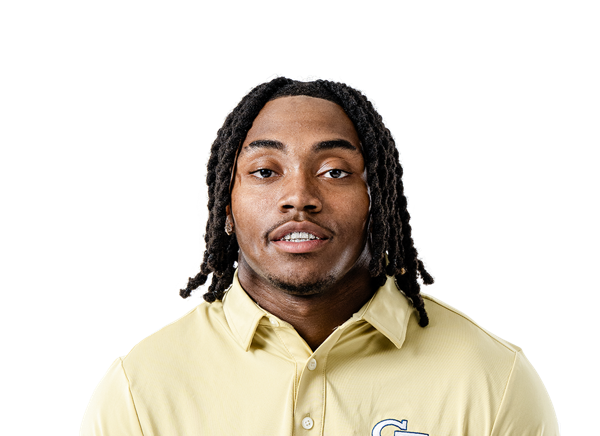 Daiquan White#4 | 3 | 3 | 0 | 0 | 1 | 0 | 0 |
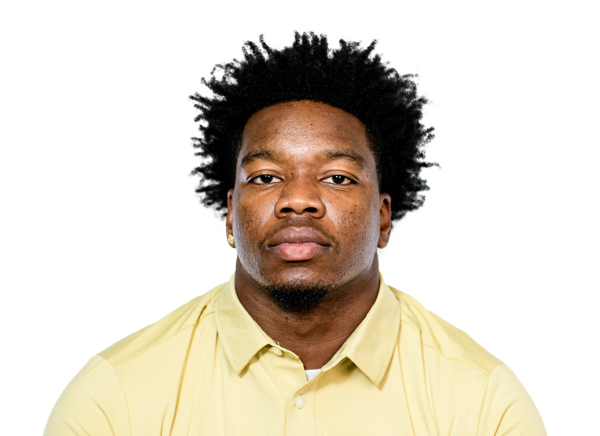 E.J. Lightsey#2 | 2 | 1 | 0 | 0 | 0 | 1 | 0 |
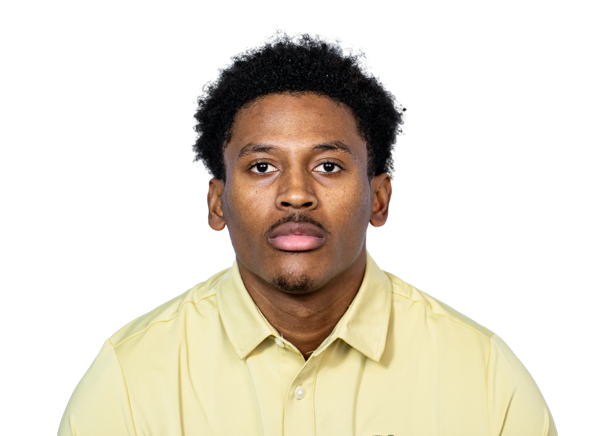 Zachary Tobe#5 | 2 | 1 | 0 | 0 | 0 | 0 | 0 |
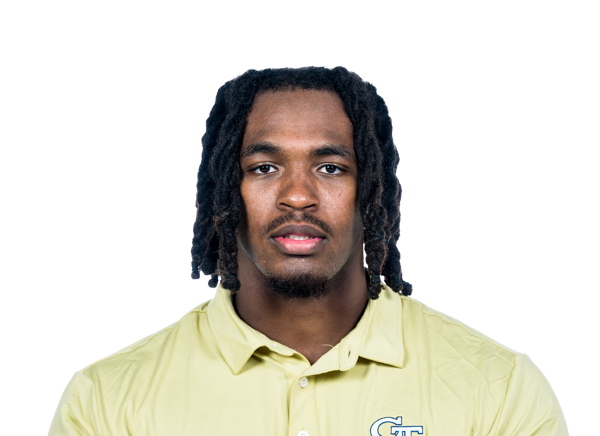 Christian Garrett#55 | 2 | 1 | 0 | 0 | 0 | 0 | 0 |
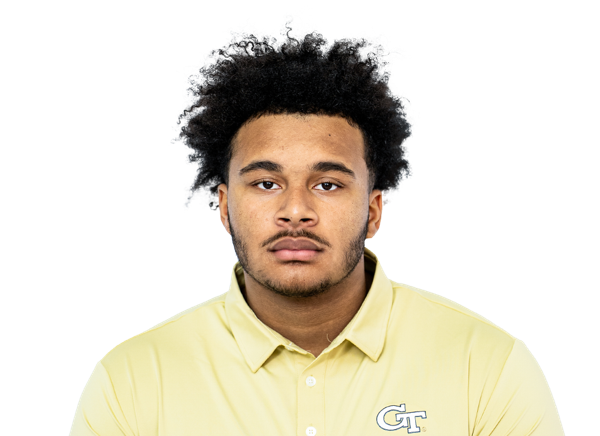 Christian Speakman#92 | 2 | 0 | 0 | 0 | 0 | 0 | 0 |
 Jonas Duclona#14 | 1 | 1 | 0 | 0 | 0 | 0 | 0 |
| Braylon Outlaw#35 | 1 | 1 | 0 | 0 | 0 | 0 | 0 |
 Jaedyn Terry#21 | 1 | 1 | 0 | 0 | 0 | 0 | 0 |
 Vincent Carroll-Jackson#99 | 1 | 0 | 0 | 0 | 0 | 0 | 0 |
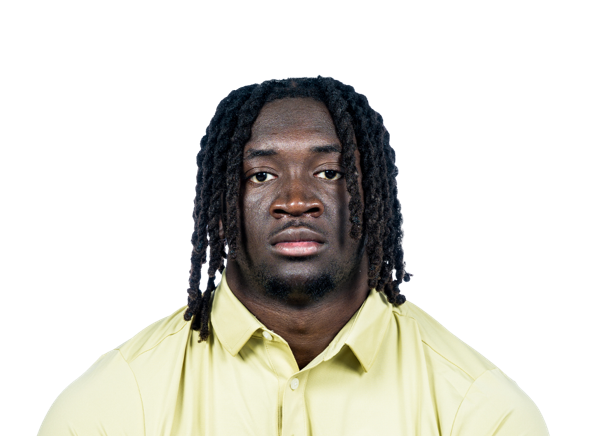 Amontrae Bradford#9 | 1 | 0 | 0 | 0 | 0 | 0 | 0 |
 Brayden Manley#11 | 1 | 0 | 0 | 0 | 0 | 0 | 0 |
Stanford| Player | TOT | SOLO | SACKS | TFL | PD | QB HUR | TD |
|---|---|---|---|---|---|---|---|
| Matt Rose#35 | 11 | 8 | 0 | 2.5 | 0 | 0 | 0 |
 Jahsiah Galvan | 10 | 6 | 0 | 0.5 | 0 | 0 | 0 |
 Jay Green#5 | 8 | 4 | 0 | 0 | 0 | 0 | 0 |
 Darrius Davis#6 | 6 | 4 | 0 | 0 | 1 | 0 | 0 |
 Leroy Bryant#4 | 5 | 4 | 0 | 0 | 0 | 0 | 0 |
 Charlie Eckhardt#39 | 5 | 2 | 0 | 0 | 0 | 0 | 0 |
 Connor Bachhuber#96 | 3 | 2 | 0 | 0 | 1 | 0 | 0 |
| Omar Staples#45 | 3 | 1 | 1 | 1 | 0 | 1 | 0 |
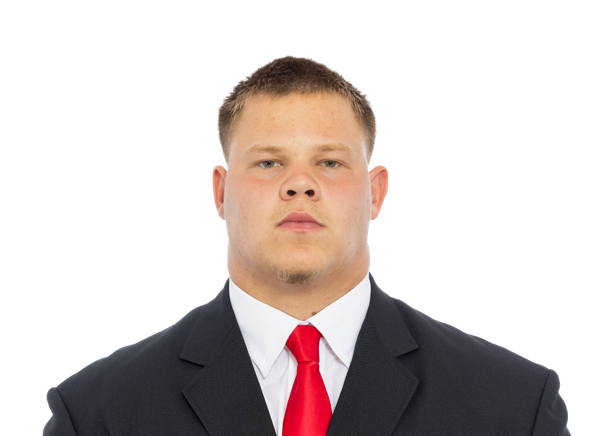 Kole Briehler#57 | 3 | 0 | 0 | 0 | 0 | 0 | 0 |
 Braden Marceau-Olayinka#75 | 2 | 1 | 0 | 1 | 0 | 0 | 0 |
 Gabe Kaminski#49 | 2 | 1 | 0 | 0 | 0 | 0 | 0 |
 Zach Rowell#97 | 1 | 1 | 0 | 0 | 0 | 1 | 0 |
 Scotty Edwards#21 | 1 | 1 | 0 | 0 | 0 | 0 | 0 |
 Tyler Kuo#82 | 1 | 1 | 0 | 0 | 0 | 0 | 0 |
 Cam Richardson#8 | 1 | 1 | 0 | 0 | 1 | 0 | 0 |
 Bo Tate#25 | 1 | 1 | 0 | 0 | 0 | 0 | 0 |
| Dre Pollard#14 | 1 | 1 | 0 | 0 | 0 | 0 | 0 |
 Tevarua Tafiti#11 | 1 | 0 | 0 | 0 | 1 | 1 | 0 |
 Sam Mattingly#10 | 1 | 0 | 0 | 0 | 0 | 0 | 0 |
 Javion Randall#34 | 1 | 0 | 0 | 0 | 0 | 0 | 0 |
 Preston Jernegan#54 | 1 | 0 | 0 | 0 | 0 | 0 | 0 |
 Xavier Harmon#20 | 1 | 0 | 0 | 0 | 0 | 0 | 0 |
Georgia Tech| Player | FUM | LOST | REC |
|---|---|---|---|
| Justice Haynes#22 | 1 | 1 | 0 |
| Gavin Harris#8 | 1 | 0 | 0 |
Stanford| Player | FUM | LOST | REC |
|---|---|---|---|
| Tevarua Tafiti#11 | 0 | 0 | 1 |
Georgia Tech| Player | FG | PCT | LONG | XP | PTS |
|---|---|---|---|---|---|
 Aidan Birr#33 | 2/2 | 100.0 | 33 | 3/3 | 9 |
Stanford| Player | FG | PCT | LONG | XP | PTS |
|---|---|---|---|---|---|
 Emmet Kenney#13 | 2/2 | 100.0 | 29 | 4/4 | 10 |
Georgia Tech| Player | NO | YDS | AVG | TB | In 20 | LONG |
|---|---|---|---|---|---|---|
 Alex Bacchetta#47 | 2 | 87 | 43.5 | 0 | 0 | 47 |
Stanford| Player | NO | YDS | AVG | TB | In 20 | LONG |
|---|---|---|---|---|---|---|
 Aidan Flintoft#37 | 2 | 93 | 46.5 | 0 | 0 | 51 |
Georgia Tech| Player | NO | YDS | AVG | LONG | TD |
|---|---|---|---|---|---|
| Rahkeem Smith#3 | 3 | 67 | 22.3 | 34 | 0 |
 Chad Alexander#11 | 1 | 19 | 19.0 | 19 | 0 |
Stanford| Player | NO | YDS | AVG | LONG | TD |
|---|---|---|---|---|---|
 Chris Davis Jr.#5 | 1 | 23 | 23.0 | 23 | 0 |
Stanford| Player | INT | YDS | TD |
|---|---|---|---|
 Brandon Nicholson#9 | 1 | 0 | 0 |
Drive Summary
GT
Field Goal
60
STAN
Touchdown
75
GT
Touchdown
75
STAN
Downs
45
GT
Field Goal
65
STAN
Field Goal
64
GT
Touchdown
66
STAN
End Of Half
50
STAN
Field Goal
68
GT
Punt
13
STAN
Touchdown
76
GT
Punt
8
STAN
Touchdown
68
GT
Downs
-1
STAN
Touchdown
24
GT
Touchdown
75
STAN
Punt
3
GT
Interception
42
STAN
Punt
2
GT
Fumble
-13
STAN
End of Game
-2
Injury Report
No current injury report is available for this matchup.
Head-to-Head
Historical meetings are not available for this matchup.
Game Information
StageWeek 4
Season2026
KickoffSat, Sep 26, 10:30 pm
VenueStanford Stadium
LocationStanford, CA
SurfaceGrass
BroadcastESPN
Attendance23,455
Division Standings
FBS — Atlantic Coast Conference
| Team | W | L | T | Pct | PF | PA | Home | Away | Strk |
|---|---|---|---|---|---|---|---|---|---|
 Miami | 8 | 0 | 0 | 1.000 | 381 | 142 | 4-0 | 4-0 | W8 |
 Clemson | 5 | 3 | 0 | 0.625 | 186 | 173 | 3-2 | 2-1 | W1 |
 Duke | 6 | 2 | 0 | 0.750 | 256 | 114 | 4-1 | 2-1 | W2 |
 Pittsburgh | 6 | 3 | 0 | 0.667 | 287 | 178 | 5-1 | 1-2 | W1 |
 Virginia Tech | 6 | 2 | 0 | 0.750 | 280 | 164 | 3-1 | 3-1 | W2 |
 Virginia | 4 | 5 | 0 | 0.444 | 233 | 208 | 4-2 | 0-3 | L3 |
 Wake Forest | 7 | 1 | 0 | 0.875 | 313 | 143 | 3-1 | 4-0 | W5 |
 Louisville | 5 | 3 | 0 | 0.625 | 323 | 216 | 4-1 | 1-2 | W3 |
 SMU | 6 | 2 | 0 | 0.750 | 282 | 178 | 5-0 | 1-2 | L1 |
 California | 3 | 6 | 0 | 0.333 | 197 | 284 | 2-3 | 1-3 | L3 |
| Stanford | 4 | 5 | 0 | 0.444 | 183 | 336 | 4-1 | 0-4 | L1 |
 North Carolina | 4 | 4 | 0 | 0.500 | 206 | 184 | 1-3 | 3-1 | L2 |
 Boston College | 4 | 4 | 0 | 0.500 | 173 | 212 | 3-1 | 1-3 | L1 |
 Florida State | 3 | 5 | 0 | 0.375 | 245 | 231 | 3-2 | 0-3 | L3 |
 NC State | 4 | 4 | 0 | 0.500 | 257 | 207 | 4-1 | 0-3 | W1 |
| Georgia Tech | 2 | 6 | 0 | 0.250 | 198 | 246 | 2-3 | 0-3 | L3 |
 Syracuse | 4 | 4 | 0 | 0.500 | 251 | 211 | 2-2 | 2-2 | W2 |
Georgia Tech
16th in ACC
VS
Stanford
11th in ACC
Quarterbacks & Specialists
#47
Alex Bacchetta
#15
Alberto Mendoza
Receivers & Backs
#11
Chad Alexander
#4
Jordan Allen
#17
Chris Corbo
#8
Gavin Harris
#22
Justice Haynes
#1
Trelain Maddox
#7
Dalen Penson
#16
Jaiven Plummer
#86
Kevin Roche Jr.
#3
Rahkeem Smith
Defensive Line & Linebackers
#9
Amontrae Bradford
#99
Vincent Carroll-Jackson
#24
Noah Carter
#55
Christian Garrett
Melvin Jordan IV
#2
E.J. Lightsey
#11
Brayden Manley
#41
Taje McCoy
#35
Braylon Outlaw
#1
Cayman Spaulding
#92
Christian Speakman
#95
Tawfiq Thomas
Defensive Backs
#14
Jonas Duclona
#27
Tae Harris
#26
Chris Hewitt Jr.
#6
Kelvin Hill
#12
Jon Mitchell
#21
Jaedyn Terry
#5
Zachary Tobe
#4
Daiquan White
Other
#33
Aidan Birr
Quarterbacks & Specialists
#37
Aidan Flintoft
#8
Davis Warren
Receivers & Backs
#88
Benji Blackburn
#23
Nico Brown
#80
Jacob Butler
#5
Chris Davis Jr.
#20
Micah Ford
#11
JonAnthony Hall
Caden High
#26
Sedrick Irvin
#89
Atticus Joseph
#82
Tyler Kuo
#4
Jordan Onovughe
#14
Dre Pollard
#2
Zion Robinson
Defensive Line & Linebackers
#96
Connor Bachhuber
#57
Kole Briehler
Jahsiah Galvan
#54
Preston Jernegan
#49
Gabe Kaminski
#75
Braden Marceau-Olayinka
#10
Sam Mattingly
#35
Matt Rose
#97
Zach Rowell
#45
Omar Staples
#11
Tevarua Tafiti
#25
Bo Tate
Defensive Backs
#4
Leroy Bryant
#6
Darrius Davis
#39
Charlie Eckhardt
#21
Scotty Edwards
#5
Jay Green
#20
Xavier Harmon
#9
Brandon Nicholson
#34
Javion Randall
#8
Cam Richardson
Other
#13
Emmet Kenney
Georgia Tech
14th in ACC
VS
Stanford
10th in ACC
Passing
70.8
Completion Percentage
60.3
160
Completions
170
2.70
Interception Percentage
1.10
6
Interceptions
3
46
Longest Pass
61
1,787
Net Passing Yards
1,979
255.3
Net Passing Yards Per Game
247.4
226
Passing Attempts
282
4.90
Passing Touchdown %
3.90
11
Passing Touchdowns
11
147.8
Passer Rating
129.8
16
Total Sacks
14
122
Sack Yards Lost
113
7.9
Yards Per Pass Attempt
7.0
1,787
Passing Yards
1,979
0
Passing Fumbles Lost
0
7
Team Games Played
8
378.7
Yards Per Game
359.6
26.7
Total Points Per Game
19.9
187
Total Points
159
23
Total Touchdowns
20
255.3
Passing Yards Per Game
247.4
160-226
Comp-Att
170-282
16-122
Sacks-Yards Lost
14-113
Rushing
209
Rushing Attempts
241
864
Rushing Yards
898
4.1
Yards Per Rush Attempt
3.7
60
Long Rushing
81
0
20+ Yard Rushing Plays
0
10
Rushing Touchdowns
8
123.4
Rushing Yards Per Game
112.3
0
Rushing Fumbles
0
0
Rushing Fumbles Lost
0
48
Rushing 1st downs
49
7
Team Games Played
8
2,651
Total Yards
2,877
451
Total Offensive Plays
537
26.7
Total Points Per Game
19.9
187
Total Points
159
23
Total Touchdowns
20
Receiving
160
Receptions
170
0
Receiving Targets
0
1,787
Receiving Yards
1,979
1,787
Receiving Yards
1,979
11
Receiving Touchdowns
11
46
Long Reception
61
0
20+ Yard Receiving Plays
0
255.3
Receiving Yards Per Game
247.4
0
Receiving Fumbles
0
0
Receiving Fumbles Lost
0
804
Receiving Yards After Catch
829
79
Receiving First Downs
90
7
Team Games Played
8
11.2
Yards Per Reception
11.6
26.7
Total Points Per Game
19.9
187
Total Points
159
23
Total Touchdowns
20
Miscellaneous
151
Total 1st downs
151
48
Rushing 1st downs
49
79
Passing 1st downs
90
24
1st downs by penalty
12
27
Third Down Conversions
37
80
Third Down Attempts
109
33.75
3rd down %
33.94
6
Fourth Down Conversions
8
12
First Downs Attempts
17
50.00
4th down %
47.06
54
Total Penalties
54
482
Total Penalty Yards
463
11554
Possession Time Seconds
13561
0.00
Red Zone Field Goal Percentage
0.00
0.00
Red Zone Scoring Percentage
0.00
0.00
Red Zone Efficiency Percentage
0.00
0.00
Red Zone Touchdown Percentage
0.00
11
Total Takeaways
6
9
Total Giveaways
6
2
Turnover Ratio
0
0
Fumbles Lost
0
27-80
3rd down efficiency
37-109
6-12
4th down efficiency
8-17
54-482
Total-Yards
54-463
Defense
259
Solo Tackles
275
206
Assist Tackles
252
465
Total Tackles
527
12
Sacks
6
102
Sack Yards
44
51
Stuffs
45
14
Passes Defended
28
1.0
Average Interception Yards
0.0
1
Long Interception
0
0
Miscellaneous Touchdowns
0
2
Kicks Blocked
1
36
Tackles For Loss
20
7
Team Games Played
8
Defensive Interceptions
1
Interceptions
3
1
Interception Yards
0
0
Interception Touchdowns
0
1-1
INT: Total
3-0
General
11
Fumbles
6
3
Forced Fumbles
3
5
Fumbles Recovered
3
0
Fumbles Touchdowns
1
7
Games Played
8
11-0
Fumbles-Lost
6-0
Returning
24
Kick Returns
23
665
Kick Return Yards
462
27.7
Yards Per Kick Return
20.1
100
Long Kick Return
37
1
Kick Return Touchdowns
0
7
Punt Returns
11
85
Punt Return Yards
114
12.1
Yards Per Punt Return
10.4
33
Long Punt Return
33
1
Punt Return Touchdowns
0
0
Punt Return Fair Catches
0
0
Kick Return Fumbles Lost
0
0
Punt Return Fumbles Lost
0
7
Team Games Played
8
7-85
Punt: Total
11-114
Kicking
9
Field Goal Made
6
12
Field Goal Attempts
9
75.0
Field Goal Percentage
66.7
33
Long Field Goal Made
43
0
Field Goal Attempts 1-19
0
4
Field Goal Attempts 20-29
3
7
Field Goal Attempts 30-39
4
1
Field Goal Attempts 40-49
2
0
Field Goal Attempts 50+
0
22
Extra Points Made
19
23
Extra Point Attempts
20
95.7
Extra Point Percentage
95.0
0
Field Goals Made 1-19
0
4
Field Goals Made 20-29
3
5
Field Goals Made 30-39
2
0
Field Goals Made 40-49
1
0
Field Goals Made 50+
0
49
Total Kicking Points
37
7
Team Games Played
8
86
Touchback Percentage
56
0.0
Average Kickoff Return Yards
0.0
0
Kickoff Return Yards
0
0
Kickoff Returns
0
0-0
Kickoffs: Total
0-0
9-12
FG: Good-Attempts
6-9
Punting
26
Punts
43
1,101
Punt Yards
1,847
65
Long Punt
53
42.3
Gross Average Punt Yards
43.0
42.3
Net Average Punt Yards
43.0
0
Punts Blocked
0
9
Punts Inside 20
13
2
Touchbacks
1
7
Fair Catches
23
6
Punt Returns
8
0
Punt Return Yards
0
0.0
Average Punt Return Yards
0.0
7
Team Games Played
8
26-1,101
Punt: Total Yards
43-1,847
Scoring
10
Rushing Touchdowns
8
11
Receiving Touchdowns
11
2
Return Touchdowns
0
23
Total Touchdowns
20
9
Field Goals
6
22
Kick Extra Points
19
0
Total Two Point Conversions
0
187
Total Points
159
26.7
Total Points Per Game
19.9