

Grambling vs TCU Live Score (13 Sep, 2026)
Score by Quarter
| Team | Q1 | Q2 | Q3 | Q4 | Final |
|---|---|---|---|---|---|
 Grambling |
0 | 7 | 0 | 0 | 7 |
 TCU |
7 | 21 | 14 | 21 | 63 |
Scoring Plays
Q1
12:21
12:21
M. Everhart run for 8 yds, for a TD (N. McCashland KICK)
Rushing Touchdown
0 – 7
Q2
10:53
10:53
J. Denman run for 1 yd, for a TD (N. McCashland KICK)
Rushing Touchdown
0 – 14
Q2
8:26
8:26
J. Craig pass to K. Pimpton for 9 yds, for a TD (N. McCashland KICK)
Passing Touchdown
0 – 21
Q2
4:30
4:30
R. Johnson pass to B. Eaton Jr. for 7 yds, for a TD (T. Caballero KICK)
Passing Touchdown
7 – 21
Q2
1:48
1:48
Jo. Pitchford run for 1 yd, for a TD (N. McCashland KICK)
Rushing Touchdown
7 – 28
Q3
9:23
9:23
J. Craig pass to K. Ashley for 29 yds, for a TD (N. McCashland KICK)
Passing Touchdown
7 – 35
Q3
2:20
2:20
J. Craig pass to Je. Scott for 52 yds, for a TD (N. McCashland KICK)
Passing Touchdown
7 – 42
Q4
12:23
12:23
J. Craig pass to K. Ashley for 15 yds, for a TD (N. McCashland KICK)
Passing Touchdown
7 – 49
Q4
9:52
9:52
H. Benoit pass intercepted, T. Parks return for 67 yds, for a TD (N. McCashland KICK)
Interception Return Touchdown
7 – 56
Q4
3:24
3:24
A. Martin run for 10 yds, for a TD (N. McCashland KICK)
Rushing Touchdown
7 – 63
Game Leaders
GramblingTCU
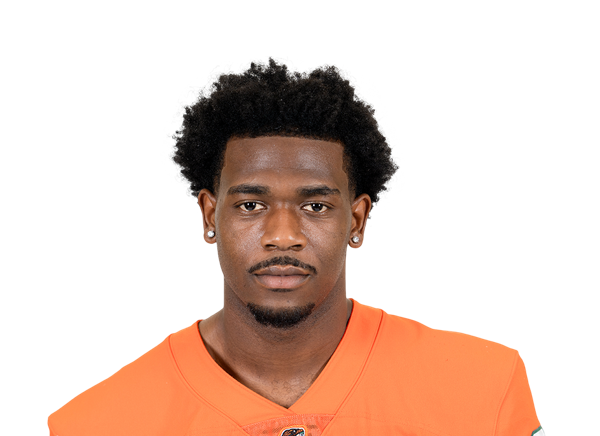 R. Johnson QB
Passing Yards
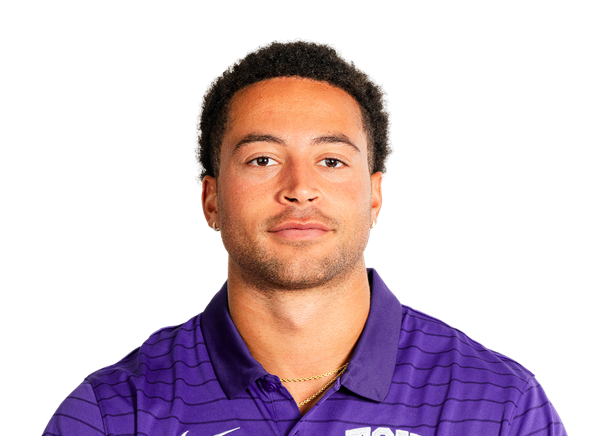 J. Craig QB
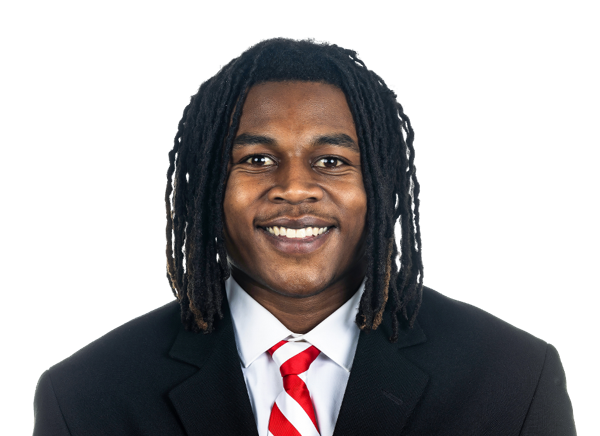 J. Parker RB
Rushing Yards
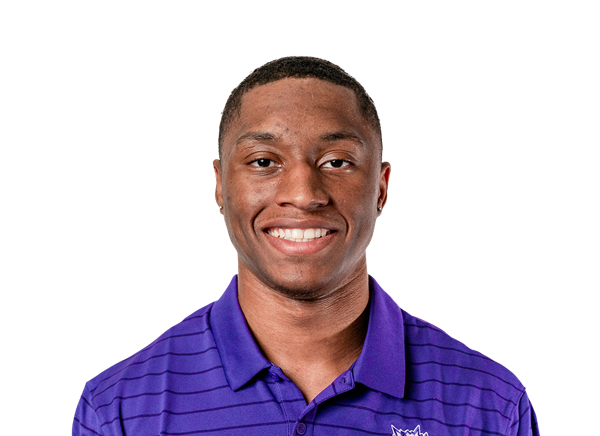 J. Payne RB
 J. Bride WR
Receiving Yards
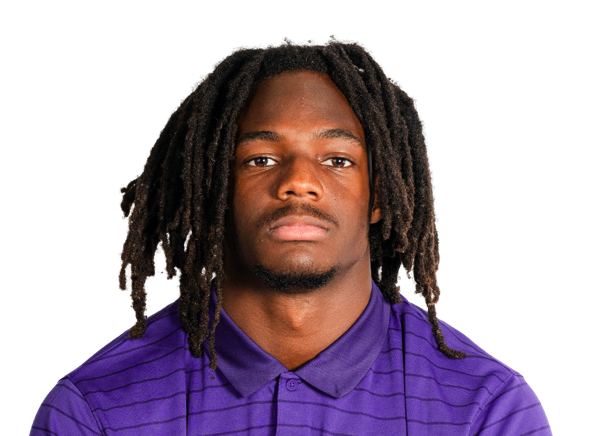 K. Ashley TE
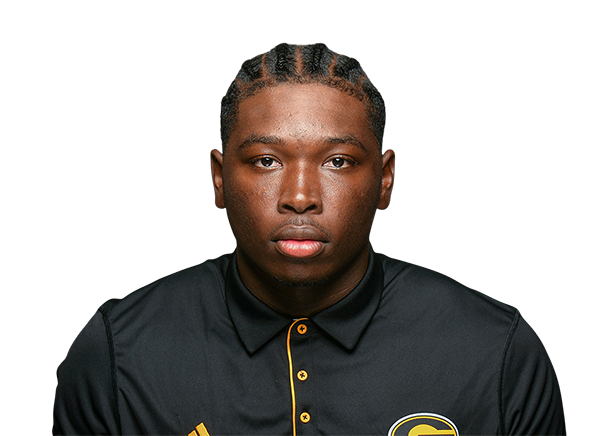 J. Scott DL
Sacks
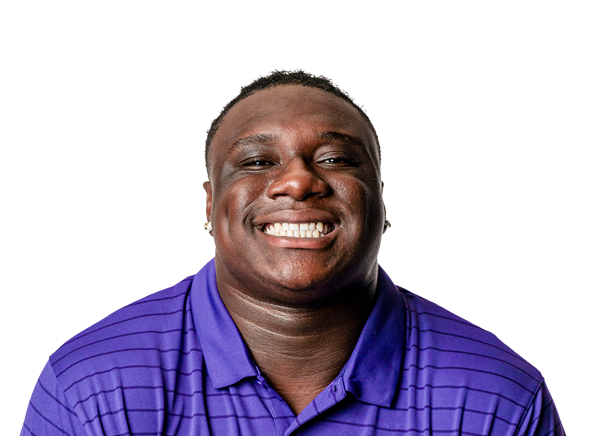 A. Din-Mbuh DT
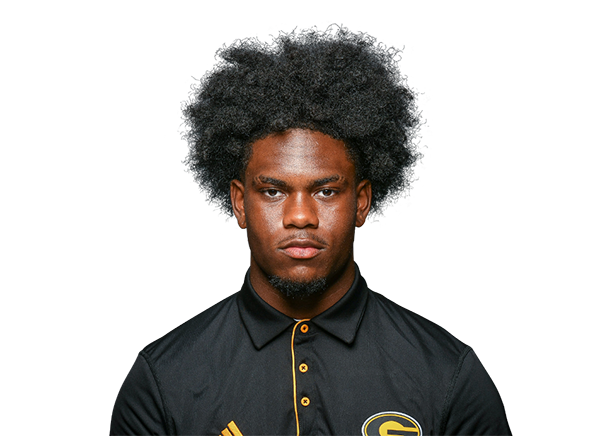 L. Foster S
Tackles
 K. McFadden S
Player Box Score
Grambling| Player | C/ATT | YDS | AVG | TD | INT |
|---|---|---|---|---|---|
| Reginald Johnson#1 | 14/20 | 190 | 9.5 | 1 | 0 |
 Jacobe Robinson#7 | 0/2 | 0 | 0.0 | 0 | 0 |
 Ashton Frye#15 | 0/2 | 0 | 0.0 | 0 | 1 |
 Hayden Benoit#3 | 0/1 | 0 | 0.0 | 0 | 1 |
TCU| Player | C/ATT | YDS | AVG | TD | INT |
|---|---|---|---|---|---|
| Jaden Craig#1 | 24/31 | 391 | 12.6 | 4 | 0 |
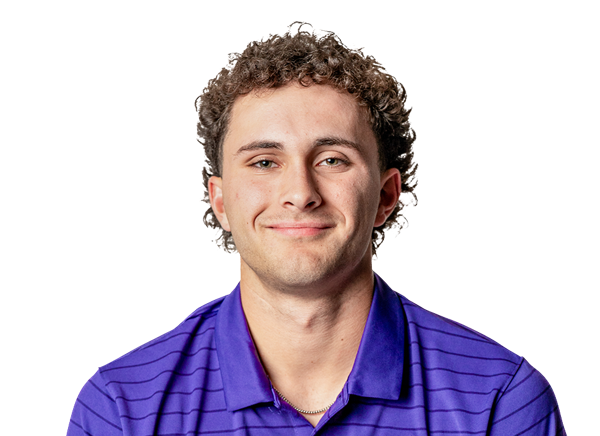 Adam Schobel#11 | 0/1 | 0 | 0.0 | 0 | 0 |
Grambling| Player | CAR | YDS | AVG | TD | LONG |
|---|---|---|---|---|---|
| Jamarion Parker#9 | 5 | 9 | 1.8 | 0 | 8 |
| Tony Phillips Jr.#6 | 3 | 7 | 2.3 | 0 | 5 |
| Hayden Benoit#3 | 1 | 4 | 4.0 | 0 | 4 |
 D'Shuan Ford#23 | 4 | 4 | 1.0 | 0 | 3 |
| Schuylar Turnbull#14 | 1 | 3 | 3.0 | 0 | 3 |
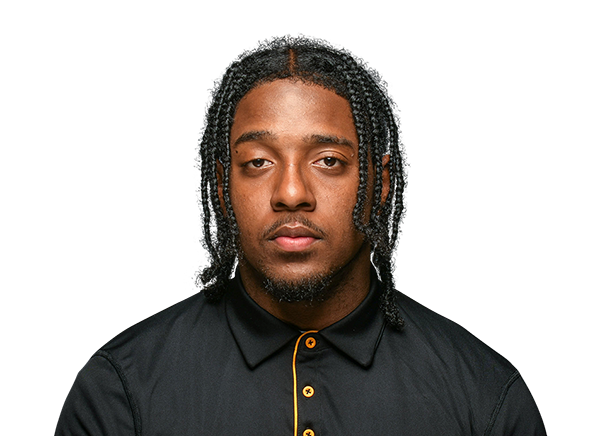 Andre Crews#13 | 2 | 3 | 1.5 | 0 | 4 |
| Clyde McClendon Jr.#24 | 2 | 3 | 1.5 | 0 | 3 |
| Ashton Frye#15 | 1 | 2 | 2.0 | 0 | 2 |
| Byron Eaton Jr.#10 | 1 | 2 | 2.0 | 0 | 2 |
| Zerrick Jones#35 | 4 | 2 | 0.5 | 0 | 2 |
| Jacobe Robinson#7 | 1 | -4 | -4.0 | 0 | 0 |
| Reginald Johnson#1 | 3 | -15 | -5.0 | 0 | 1 |
TCU| Player | CAR | YDS | AVG | TD | LONG |
|---|---|---|---|---|---|
| Jeremy Payne#26 | 9 | 79 | 8.8 | 0 | 32 |
| Jaden Craig#1 | 8 | 53 | 6.6 | 0 | 31 |
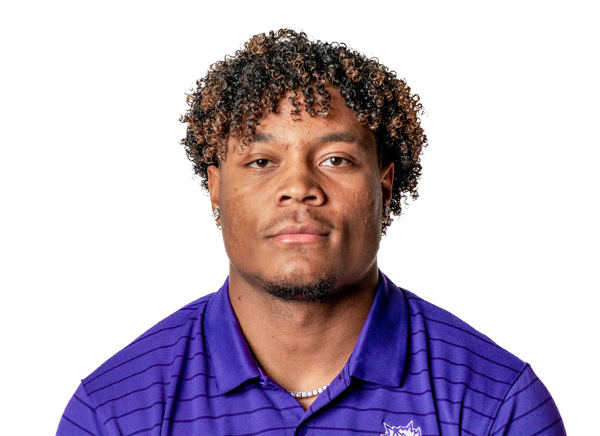 Jon Denman#2 | 6 | 41 | 6.8 | 1 | 28 |
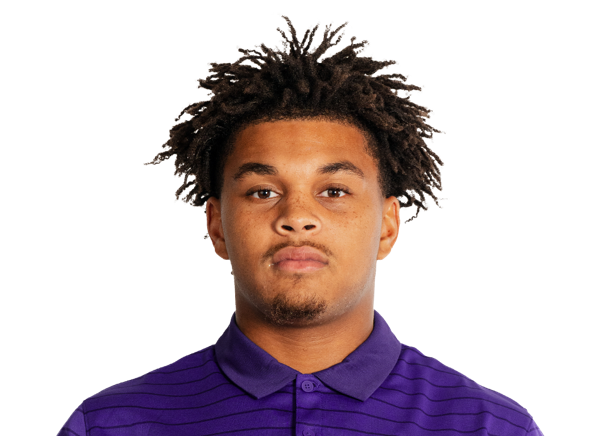 Amante Martin#23 | 4 | 38 | 9.5 | 1 | 19 |
 Landon Walker#27 | 3 | 32 | 10.7 | 0 | 14 |
 Joe Pitchford#24 | 4 | 25 | 6.3 | 1 | 11 |
 G'Ivori Graham#20 | 1 | 10 | 10.0 | 0 | 10 |
 Major Everhart#3 | 1 | 8 | 8.0 | 1 | 8 |
| Team | 1 | -1 | -1.0 | 0 | 1 |
Grambling| Player | REC | YDS | AVG | TD | LONG |
|---|---|---|---|---|---|
| Jordan Bride#2 | 4 | 79 | 19.8 | 0 | 62 |
| Byron Eaton Jr.#10 | 2 | 59 | 29.5 | 1 | 52 |
| Tyson George#8 | 3 | 22 | 7.3 | 0 | 16 |
 Nae'Saan Dickerson#11 | 2 | 19 | 9.5 | 0 | 10 |
 Dylan Wroblewski#80 | 1 | 8 | 8.0 | 0 | 8 |
 Davon Mitchell#82 | 2 | 3 | 1.5 | 0 | 4 |
TCU| Player | REC | YDS | AVG | TD | LONG |
|---|---|---|---|---|---|
| Kari Ashley#81 | 7 | 119 | 17.0 | 2 | 37 |
 Ed Small#18 | 5 | 101 | 20.2 | 0 | 57 |
 Jeremy Scott#6 | 5 | 87 | 17.4 | 1 | 52 |
 Ka'Morreun Pimpton#88 | 2 | 37 | 18.5 | 1 | 28 |
 Jacobe Hayes#80 | 3 | 36 | 12.0 | 0 | 15 |
| Jeremy Payne#26 | 1 | 6 | 6.0 | 0 | 6 |
 Dane Jones#17 | 1 | 5 | 5.0 | 0 | 5 |
Grambling| Player | TOT | SOLO | SACKS | TFL | PD | QB HUR | TD |
|---|---|---|---|---|---|---|---|
| Michael Freeman#15 | 7 | 6 | 0 | 0 | 0 | 0 | 0 |
| Louis Foster#4 | 7 | 4 | 0 | 0.5 | 0 | 0 | 0 |
 Jalen Guillard#23 | 6 | 1 | 0 | 0.5 | 0 | 0 | 0 |
 Lonell Cunningham#20 | 5 | 3 | 0 | 0 | 0 | 0 | 0 |
 Christen Williams | 4 | 2 | 0 | 0 | 0 | 0 | 0 |
 Kyran McConnell#21 | 4 | 2 | 0 | 0 | 0 | 0 | 0 |
 Marcellius Johnson#2 | 3 | 3 | 0 | 0 | 0 | 0 | 0 |
 Jon Horton#9 | 3 | 2 | 0 | 0 | 0 | 0 | 0 |
| Katrevrick Banks#5 | 3 | 2 | 0 | 0 | 0 | 0 | 0 |
| Franklin Allen#14 | 3 | 2 | 0 | 0 | 0 | 0 | 0 |
| Brayren Briscoe#17 | 3 | 2 | 0 | 0 | 0 | 0 | 0 |
 Kilas Francis#92 | 2 | 2 | 0 | 0 | 0 | 0 | 0 |
 Charles Bernard#86 | 2 | 2 | 0 | 0 | 0 | 0 | 0 |
| Delano Franklin#1 | 2 | 1 | 0 | 0 | 0 | 0 | 0 |
 Javorious Sherrod#99 | 2 | 1 | 0 | 0 | 0 | 0 | 0 |
| Adrian Spencer#18 | 2 | 1 | 0 | 0 | 0 | 0 | 0 |
| Sammy Draper | 2 | 1 | 0 | 0 | 0 | 0 | 0 |
| Jayden Scott#91 | 1 | 1 | 1 | 1 | 0 | 0 | 0 |
 Tory Morgan#7 | 1 | 1 | 0 | 0 | 0 | 0 | 0 |
 Corey Amos#19 | 1 | 1 | 0 | 0 | 0 | 0 | 0 |
 Donte Hookfin#48 | 1 | 1 | 0 | 0 | 0 | 0 | 0 |
 Alexander Davis#47 | 1 | 1 | 0 | 0 | 0 | 0 | 0 |
| Tyler Aristyl#94 | 1 | 1 | 0 | 0 | 0 | 0 | 0 |
| Jacorey York#26 | 1 | 1 | 0 | 0 | 0 | 0 | 0 |
| Juanterrius Martinez#27 | 1 | 0 | 0 | 0 | 0 | 0 | 0 |
TCU| Player | TOT | SOLO | SACKS | TFL | PD | QB HUR | TD |
|---|---|---|---|---|---|---|---|
| Kaden McFadden#18 | 6 | 4 | 0 | 0 | 0 | 0 | 0 |
 Hudson Hooper#37 | 4 | 3 | 0 | 1 | 0 | 0 | 0 |
 Max Carroll#3 | 4 | 1 | 0 | 0 | 1 | 1 | 0 |
 Michael Short#11 | 3 | 3 | 0 | 0 | 0 | 0 | 0 |
 John Schobel#14 | 3 | 2 | 0 | 1 | 0 | 0 | 0 |
 Michael Teason Jr.#27 | 3 | 1 | 0 | 0.5 | 0 | 0 | 0 |
 Vernon Glover Jr.#1 | 2 | 2 | 0 | 1 | 0 | 0 | 0 |
 Jordan Lester#22 | 2 | 2 | 0 | 0 | 0 | 0 | 0 |
 Kelten Mickell#90 | 2 | 2 | 0 | 2 | 0 | 0 | 0 |
| Ansel Din-Mbuh#92 | 2 | 1 | 1 | 1 | 0 | 0 | 0 |
 Paul Oyewale#97 | 2 | 1 | 0 | 0 | 0 | 1 | 0 |
 Kylin Jackson#6 | 2 | 1 | 0 | 0.5 | 0 | 0 | 0 |
 Devyn Hidrogo#15 | 2 | 1 | 0 | 0 | 0 | 0 | 0 |
 Kalen Carroll#12 | 1 | 1 | 0 | 0 | 0 | 0 | 0 |
 Ryan Yaites#13 | 1 | 1 | 0 | 0 | 0 | 0 | 0 |
 Cheta Ofili#36 | 1 | 1 | 0 | 1 | 0 | 0 | 0 |
 Keylan Abrams#23 | 1 | 1 | 0 | 0 | 0 | 0 | 0 |
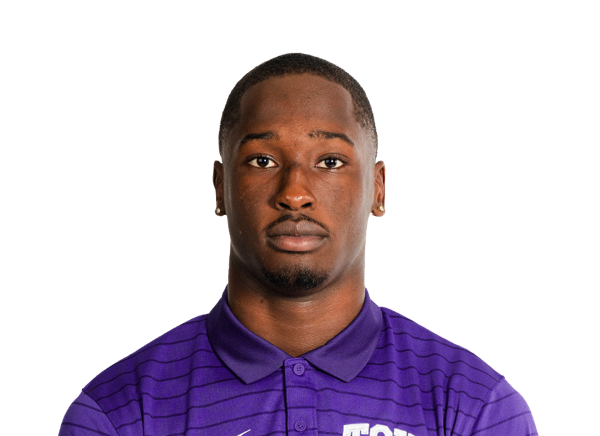 Teon Parks#21 | 1 | 1 | 0 | 0 | 1 | 0 | 1 |
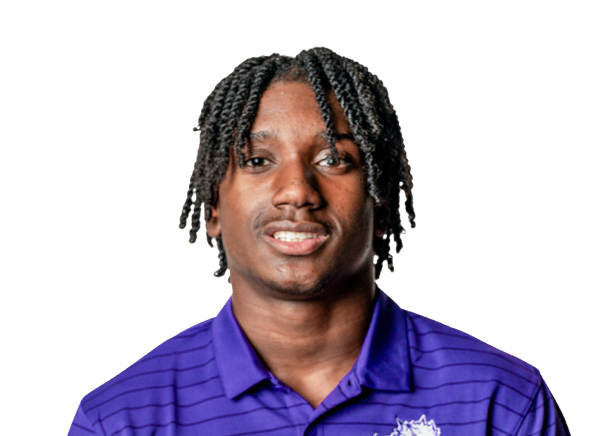 Gil Jackson Jr.#4 | 1 | 1 | 0 | 0 | 1 | 0 | 0 |
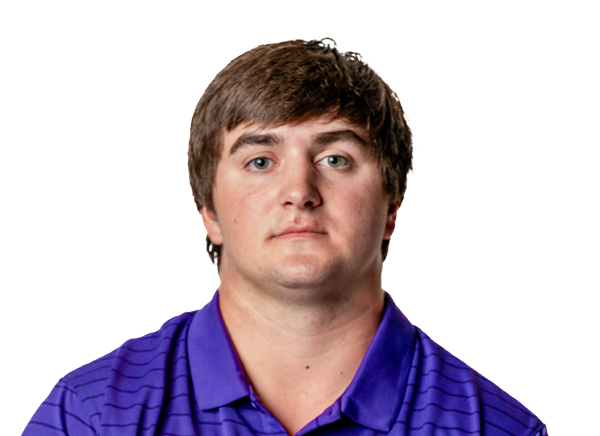 Blake Robinett#52 | 1 | 1 | 0 | 0 | 0 | 0 | 0 |
 Brock King#16 | 1 | 1 | 0 | 1 | 0 | 0 | 0 |
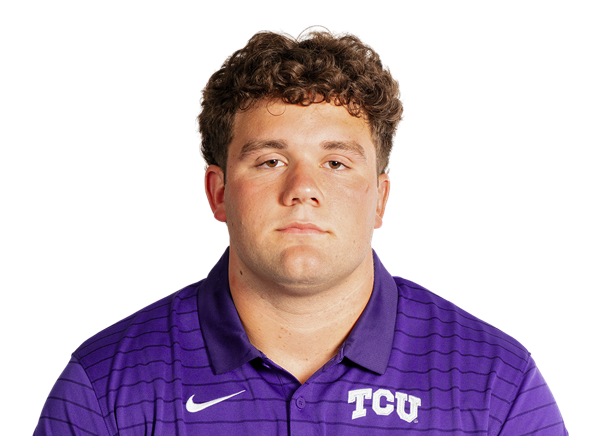 Maddox Flynt#96 | 1 | 1 | 0 | 0 | 0 | 0 | 0 |
 Markis Deal#95 | 1 | 0 | 0.5 | 0.5 | 0 | 0 | 0 |
 Koron Hayward#16 | 1 | 0 | 0.5 | 0.5 | 0 | 0 | 0 |
 Julius Simms#7 | 1 | 0 | 0 | 0 | 0 | 0 | 0 |
 Carter Buck#98 | 0 | 0 | 0 | 0 | 0 | 1 | 0 |
Grambling| Player | FUM | LOST | REC |
|---|---|---|---|
| D'Shuan Ford#23 | 1 | 0 | 0 |
| Andre Crews#13 | 1 | 0 | 0 |
TCU| Player | FUM | LOST | REC |
|---|---|---|---|
| Jeremy Payne#26 | 1 | 1 | 0 |
| Team | 1 | 0 | 0 |
| Ed Small#18 | 1 | 0 | 0 |
Grambling| Player | FG | PCT | LONG | XP | PTS |
|---|---|---|---|---|---|
| Theodore Caballero#49 | 0/0 | 0.0 | 0 | 1/1 | 1 |
 Diego Alfaro#39 | 0/1 | 0.0 | 0 | 0/0 | 0 |
TCU| Player | FG | PCT | LONG | XP | PTS |
|---|---|---|---|---|---|
 Nate McCashland#99 | 0/0 | 0.0 | 0 | 9/9 | 9 |
Grambling| Player | NO | YDS | AVG | TB | In 20 | LONG |
|---|---|---|---|---|---|---|
| Alexander Davis#47 | 9 | 379 | 42.1 | 0 | 0 | 53 |
| Team | 1 | 0 | 0.0 | 0 | 0 | 0 |
TCU| Player | NO | YDS | AVG | TB | In 20 | LONG |
|---|---|---|---|---|---|---|
 John Hoyet Chance#48 | 3 | 127 | 42.3 | 0 | 2 | 45 |
Grambling| Player | NO | YDS | AVG | LONG | TD |
|---|---|---|---|---|---|
| Tony Phillips Jr.#6 | 1 | 18 | 18.0 | 18 | 0 |
| Andre Crews#13 | 1 | -1 | -1.0 | 0 | 0 |
TCU| Player | NO | YDS | AVG | LONG | TD |
|---|---|---|---|---|---|
 Ace Theus#4 | 2 | 45 | 22.5 | 24 | 0 |
TCU| Player | NO | YDS | AVG | LONG | TD |
|---|---|---|---|---|---|
| Ace Theus#4 | 5 | 73 | 14.6 | 22 | 0 |
| Ed Small#18 | 2 | 21 | 10.5 | 20 | 0 |
 Dillon Arkansas#32 | 1 | 0 | 0.0 | 0 | 0 |
TCU| Player | INT | YDS | TD |
|---|---|---|---|
| Teon Parks#21 | 1 | 67 | 1 |
| Vernon Glover Jr.#1 | 1 | 0 | 0 |
Drive Summary
TCU
Touchdown
78
GRAM
Missed FG
71
TCU
Punt
34
GRAM
Punt
11
TCU
47
GRAM
Punt
7
TCU
Touchdown
45
GRAM
Punt
-2
TCU
Touchdown
66
GRAM
Touchdown
91
TCU
Touchdown
76
GRAM
Punt
-32
TCU
End Of Half
57
GRAM
Punt
9
TCU
Punt
6
GRAM
Interception
2
TCU
Touchdown
65
GRAM
Punt
9
TCU
Punt
22
GRAM
Punt
-5
TCU
Touchdown
42
GRAM
Punt
1
TCU
Touchdown
70
GRAM
Interception Touchdown
13
GRAM
Punt
-1
TCU
Touchdown
70
GRAM
Punt
5
TCU
End Of Quarter
9
Injury Report
No current injury report is available for this matchup.
Head-to-Head
Historical meetings are not available for this matchup.
Game Information
StageWeek 2
Season2026
KickoffSat, Sep 12, 8:00 pm
VenueAmon G. Carter Stadium
LocationFort Worth, TX
SurfaceGrass
BroadcastESPN+
Division Standings
FBS — Big 12 Conference
| Team | W | L | T | Pct | PF | PA | Home | Away | Strk |
|---|---|---|---|---|---|---|---|---|---|
 BYU | 8 | 2 | 0 | 0.800 | 307 | 185 | 6-0 | 2-2 | W1 |
 Cincinnati | 5 | 5 | 0 | 0.500 | 310 | 306 | 5-1 | 0-4 | L3 |
 Colorado | 4 | 6 | 0 | 0.400 | 220 | 287 | 3-2 | 1-4 | W1 |
 Houston | 7 | 3 | 0 | 0.700 | 351 | 234 | 5-0 | 2-3 | L1 |
 Kansas State | 4 | 6 | 0 | 0.400 | 292 | 261 | 4-2 | 0-4 | L4 |
 Texas Tech | 8 | 1 | 0 | 0.889 | 338 | 217 | 6-0 | 2-1 | W2 |
 West Virginia | 5 | 5 | 0 | 0.500 | 349 | 348 | 3-3 | 2-2 | L2 |
 Utah | 9 | 0 | 0 | 1.000 | 339 | 147 | 6-0 | 3-0 | W9 |
 Arizona State | 6 | 4 | 0 | 0.600 | 282 | 259 | 4-1 | 2-3 | W2 |
 Baylor | 6 | 4 | 0 | 0.600 | 294 | 181 | 4-1 | 2-3 | L1 |
 Iowa State | 5 | 5 | 0 | 0.500 | 304 | 273 | 5-1 | 0-4 | W1 |
 Kansas | 4 | 6 | 0 | 0.400 | 302 | 237 | 3-3 | 1-3 | W1 |
 Oklahoma State | 6 | 3 | 0 | 0.667 | 395 | 245 | 4-0 | 2-3 | W1 |
| TCU | 5 | 5 | 0 | 0.500 | 234 | 152 | 4-3 | 1-2 | W1 |
 UCF | 5 | 5 | 0 | 0.500 | 284 | 260 | 4-2 | 1-3 | L1 |
 Arizona | 7 | 2 | 0 | 0.778 | 308 | 179 | 5-0 | 2-2 | W1 |
Grambling
8th in SWAC
VS
TCU
9th in Big 12
Quarterbacks & Specialists
#3
Hayden Benoit
#47
Alexander Davis
#15
Ashton Frye
#1
Reginald Johnson
#7
Jacobe Robinson
#14
Schuylar Turnbull
Receivers & Backs
#86
Charles Bernard
#2
Jordan Bride
#13
Andre Crews
#11
Nae'Saan Dickerson
#10
Byron Eaton Jr.
#23
D'Shuan Ford
#8
Tyson George
#35
Zerrick Jones
#24
Clyde McClendon Jr.
#82
Davon Mitchell
#9
Jamarion Parker
#6
Tony Phillips Jr.
#80
Dylan Wroblewski
Defensive Line & Linebackers
#19
Corey Amos
#94
Tyler Aristyl
#92
Kilas Francis
#48
Donte Hookfin
#9
Jon Horton
#2
Marcellius Johnson
#21
Kyran McConnell
#7
Tory Morgan
#91
Jayden Scott
#99
Javorious Sherrod
Defensive Backs
#14
Franklin Allen
#5
Katrevrick Banks
#17
Brayren Briscoe
#20
Lonell Cunningham
#32
Sammy Draper
#4
Louis Foster
#1
Delano Franklin
#15
Michael Freeman
#23
Jalen Guillard
#27
Juanterrius Martinez
#18
Adrian Spencer
Christen Williams
#26
Jacorey York
Other
#39
Diego Alfaro
#49
Theodore Caballero
Quarterbacks & Specialists
#48
John Hoyet Chance
#1
Jaden Craig
#11
Adam Schobel
Receivers & Backs
#81
Kari Ashley
#2
Jon Denman
#3
Major Everhart
#20
G'Ivori Graham
#80
Jacobe Hayes
#17
Dane Jones
#23
Amante Martin
#26
Jeremy Payne
#88
Ka'Morreun Pimpton
#24
Joe Pitchford
#6
Jeremy Scott
#18
Ed Small
#4
Ace Theus
#27
Landon Walker
Defensive Line & Linebackers
#23
Keylan Abrams
#32
Dillon Arkansas
#98
Carter Buck
#3
Max Carroll
#95
Markis Deal
#92
Ansel Din-Mbuh
#96
Maddox Flynt
#16
Koron Hayward
#37
Hudson Hooper
#90
Kelten Mickell
#36
Cheta Ofili
#97
Paul Oyewale
#52
Blake Robinett
#14
John Schobel
#11
Michael Short
#27
Michael Teason Jr.
Defensive Backs
#12
Kalen Carroll
#1
Vernon Glover Jr.
#15
Devyn Hidrogo
#6
Kylin Jackson
#4
Gil Jackson Jr.
#16
Brock King
#22
Jordan Lester
#18
Kaden McFadden
#21
Teon Parks
#7
Julius Simms
#13
Ryan Yaites
Other
#99
Nate McCashland
Grambling
5th in SWAC - West
VS
TCU
9th in Big 12
Passing
59.8
Completion Percentage
64.6
168
Completions
223
2.80
Interception Percentage
2.00
8
Interceptions
7
78
Longest Pass
67
2,273
Net Passing Yards
2,664
227.3
Net Passing Yards Per Game
266.4
281
Passing Attempts
345
7.10
Passing Touchdown %
3.80
20
Passing Touchdowns
13
145.7
Passer Rating
137.7
16
Total Sacks
28
139
Sack Yards Lost
178
8.1
Yards Per Pass Attempt
7.7
2,273
Passing Yards
2,664
0
Passing Fumbles Lost
0
10
Team Games Played
10
397.6
Yards Per Game
372.9
34.1
Total Points Per Game
23.4
341
Total Points
234
44
Total Touchdowns
29
227.3
Passing Yards Per Game
266.4
168-281
Comp-Att
223-345
16-139
Sacks-Yards Lost
28-178
Rushing
367
Rushing Attempts
321
1,703
Rushing Yards
1,065
4.6
Yards Per Rush Attempt
3.3
75
Long Rushing
48
0
20+ Yard Rushing Plays
0
20
Rushing Touchdowns
13
170.3
Rushing Yards Per Game
106.5
0
Rushing Fumbles
0
0
Rushing Fumbles Lost
0
85
Rushing 1st downs
65
10
Team Games Played
10
3,976
Total Yards
3,729
664
Total Offensive Plays
694
34.1
Total Points Per Game
23.4
341
Total Points
234
44
Total Touchdowns
29
Receiving
168
Receptions
223
0
Receiving Targets
0
2,273
Receiving Yards
2,664
2,273
Receiving Yards
2,664
20
Receiving Touchdowns
13
78
Long Reception
67
0
20+ Yard Receiving Plays
0
227.3
Receiving Yards Per Game
266.4
0
Receiving Fumbles
0
0
Receiving Fumbles Lost
0
111
Receiving Yards After Catch
1076
90
Receiving First Downs
122
10
Team Games Played
10
13.5
Yards Per Reception
11.9
34.1
Total Points Per Game
23.4
341
Total Points
234
44
Total Touchdowns
29
Miscellaneous
194
Total 1st downs
210
85
Rushing 1st downs
65
90
Passing 1st downs
122
18
1st downs by penalty
23
60
Third Down Conversions
63
137
Third Down Attempts
140
43.80
3rd down %
45.00
7
Fourth Down Conversions
7
10
First Downs Attempts
15
70.00
4th down %
46.67
77
Total Penalties
65
622
Total Penalty Yards
606
18775
Possession Time Seconds
18342
0.00
Red Zone Field Goal Percentage
0.00
0.00
Red Zone Scoring Percentage
0.00
0.00
Red Zone Efficiency Percentage
0.00
0.00
Red Zone Touchdown Percentage
0.00
16
Total Takeaways
17
16
Total Giveaways
15
0
Turnover Ratio
2
0
Fumbles Lost
0
60-137
3rd down efficiency
63-140
7-10
4th down efficiency
7-15
77-622
Total-Yards
65-606
Defense
324
Solo Tackles
375
332
Assist Tackles
190
656
Total Tackles
565
25
Sacks
24
120
Sack Yards
155
92
Stuffs
80
31
Passes Defended
28
12.8
Average Interception Yards
37.0
27
Long Interception
93
0
Miscellaneous Touchdowns
0
1
Kicks Blocked
2
47
Tackles For Loss
45
10
Team Games Played
10
Defensive Interceptions
4
Interceptions
6
51
Interception Yards
222
0
Interception Touchdowns
3
4-51
INT: Total
6-222
General
14
Fumbles
19
9
Forced Fumbles
12
8
Fumbles Recovered
10
0
Fumbles Touchdowns
0
10
Games Played
10
14-0
Fumbles-Lost
19-0
Returning
33
Kick Returns
12
899
Kick Return Yards
184
27.2
Yards Per Kick Return
15.3
100
Long Kick Return
24
4
Kick Return Touchdowns
0
9
Punt Returns
22
128
Punt Return Yards
219
14.2
Yards Per Punt Return
10.0
39
Long Punt Return
33
0
Punt Return Touchdowns
0
0
Punt Return Fair Catches
0
0
Kick Return Fumbles Lost
0
0
Punt Return Fumbles Lost
0
10
Team Games Played
10
9-128
Punt: Total
22-219
Kicking
11
Field Goal Made
10
14
Field Goal Attempts
15
78.6
Field Goal Percentage
66.7
41
Long Field Goal Made
45
1
Field Goal Attempts 1-19
0
7
Field Goal Attempts 20-29
4
4
Field Goal Attempts 30-39
5
2
Field Goal Attempts 40-49
4
0
Field Goal Attempts 50+
2
40
Extra Points Made
28
42
Extra Point Attempts
28
95.2
Extra Point Percentage
100.0
1
Field Goals Made 1-19
0
5
Field Goals Made 20-29
4
4
Field Goals Made 30-39
4
1
Field Goals Made 40-49
2
0
Field Goals Made 50+
0
73
Total Kicking Points
58
10
Team Games Played
10
33
Touchback Percentage
86
0.0
Average Kickoff Return Yards
0.0
0
Kickoff Return Yards
0
0
Kickoff Returns
0
0-0
Kickoffs: Total
0-0
11-14
FG: Good-Attempts
10-15
Punting
47
Punts
44
1,900
Punt Yards
1,957
61
Long Punt
66
40.4
Gross Average Punt Yards
44.5
40.4
Net Average Punt Yards
44.5
0
Punts Blocked
0
15
Punts Inside 20
21
5
Touchbacks
2
8
Fair Catches
9
18
Punt Returns
11
0
Punt Return Yards
0
0.0
Average Punt Return Yards
0.0
10
Team Games Played
10
47-1,900
Punt: Total Yards
44-1,957
Scoring
20
Rushing Touchdowns
13
20
Receiving Touchdowns
13
4
Return Touchdowns
0
44
Total Touchdowns
26
11
Field Goals
10
40
Kick Extra Points
28
1
Total Two Point Conversions
1
341
Total Points
234
34.1
Total Points Per Game
23.4