

Hawai'i vs Wyoming Live Score (26 Sep, 2026)
Score by Quarter
| Team | Q1 | Q2 | Q3 | Q4 | Final |
|---|---|---|---|---|---|
 Hawai'i |
3 | 0 | 0 | 7 | 10 |
 Wyoming |
3 | 10 | 0 | 14 | 27 |
Scoring Plays
Q1
10:13
10:13
Erik Sandvik 28 Yd Field Goal
Field Goal Good
0 – 3
Q1
5:27
5:27
Sean Olvera-Harle 28 Yd Field Goal
Field Goal Good
3 – 3
Q2
10:04
10:04
Erik Sandvik 23 Yd Field Goal
Field Goal Good
3 – 6
Q2
3:05
3:05
Markell Holman 1 Yd Run (Erik Sandvik Kick)
Rushing Touchdown
3 – 13
Q4
14:52
14:52
Markell Holman 18 Yd Run (Erik Sandvik Kick)
Rushing Touchdown
3 – 20
Q4
12:11
12:11
Devon Tauaefa 20 Yd pass from Micah Alejado (Sean Olvera-Harle Kick)
Passing Touchdown
10 – 20
Q4
1:46
1:46
Samuel Harris 18 Yd Run (Erik Sandvik Kick)
Rushing Touchdown
10 – 27
Game Leaders
Hawai'iWyoming
 M. Alejado QB
Passing Yards
 T. Hughes QB
 D. Rice RB
Rushing Yards
 S. Harris RB
 T. Uiliata WR
Receiving Yards
 D. DeBlanc WR
 W. Ho'ohuli LB
Sacks
 J. Williams (DT) DTW. Ho'ohuli LB
Tackles
 J. Thomas S
Player Box Score
Hawai'i| Player | C/ATT | YDS | AVG | TD | INT | QBR |
|---|---|---|---|---|---|---|
| Micah Alejado#12 | 28/44 | 226 | 5.1 | 1 | 0 | 31.1 |
Wyoming| Player | C/ATT | YDS | AVG | TD | INT | QBR |
|---|---|---|---|---|---|---|
| Tyler Hughes#6 | 17/23 | 204 | 8.9 | 0 | 0 | 39.5 |
Hawai'i| Player | CAR | YDS | AVG | TD | LONG |
|---|---|---|---|---|---|
| DeVon Rice#1 | 11 | 75 | 6.8 | 0 | 20 |
 Cam Barfield | 4 | 17 | 4.3 | 0 | 6 |
| Tama Uiliata#8 | 2 | 10 | 5.0 | 0 | 8 |
 Sitani Mikaele#26 | 1 | 1 | 1.0 | 0 | 1 |
| Micah Alejado#12 | 5 | -1 | -0.2 | 0 | 19 |
Wyoming| Player | CAR | YDS | AVG | TD | LONG |
|---|---|---|---|---|---|
| Samuel Harris#1 | 11 | 94 | 8.5 | 1 | 31 |
 Markell Holman#8 | 15 | 87 | 5.8 | 2 | 18 |
| Tyler Hughes#6 | 11 | 3 | 0.3 | 0 | 15 |
| Deion DeBlanc#3 | 1 | -1 | -1.0 | 0 | 0 |
Hawai'i| Player | REC | YDS | AVG | TD | LONG |
|---|---|---|---|---|---|
| Tama Uiliata#8 | 6 | 39 | 6.5 | 0 | 16 |
 Audric Harris#2 | 3 | 32 | 10.7 | 0 | 19 |
 Kainoa Carvalho#6 | 3 | 27 | 9.0 | 0 | 11 |
 Devon Tauaefa#9 | 2 | 26 | 13.0 | 1 | 20 |
 Frank Abreu#81 | 4 | 24 | 6.0 | 0 | 9 |
| Sitani Mikaele#26 | 2 | 23 | 11.5 | 0 | 18 |
 Devin Alves#11 | 1 | 11 | 11.0 | 0 | 11 |
| DeVon Rice#1 | 2 | 11 | 5.5 | 0 | 14 |
 Carson Brown#3 | 1 | 9 | 9.0 | 0 | 9 |
 Nick Delgadillo#17 | 2 | 9 | 4.5 | 0 | 5 |
| Cam Barfield | 1 | 8 | 8.0 | 0 | 8 |
 Titan Lacaden#22 | 1 | 7 | 7.0 | 0 | 7 |
Wyoming| Player | REC | YDS | AVG | TD | LONG |
|---|---|---|---|---|---|
| Deion DeBlanc#3 | 3 | 41 | 13.7 | 0 | 26 |
| Samuel Harris#1 | 4 | 36 | 9.0 | 0 | 17 |
 Kyle Frendt#83 | 1 | 27 | 27.0 | 0 | 27 |
 Jake Wilson#89 | 2 | 27 | 13.5 | 0 | 20 |
 Eric Richardson#2 | 2 | 27 | 13.5 | 0 | 19 |
 Jackson Holman#9 | 2 | 19 | 9.5 | 0 | 13 |
 Charlie Coenen#19 | 1 | 16 | 16.0 | 0 | 16 |
 Isaac Schoenfeld#87 | 1 | 6 | 6.0 | 0 | 6 |
 Tyler Siddons#80 | 1 | 5 | 5.0 | 0 | 5 |
Hawai'i| Player | TOT | SOLO | SACKS | TFL | PD | QB HUR | TD |
|---|---|---|---|---|---|---|---|
| Wynden Ho'ohuli#12 | 10 | 7 | 1 | 1 | 0 | 0 | 0 |
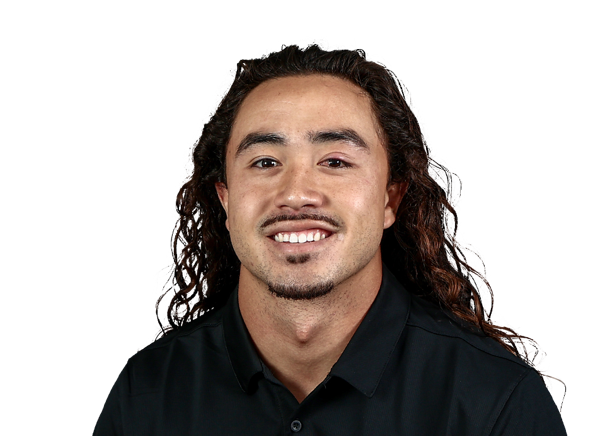 Matagi Thompson#25 | 8 | 5 | 0 | 0 | 0 | 0 | 0 |
 Elijah Gipson#13 | 5 | 5 | 0 | 0 | 0 | 0 | 0 |
 Elijah Palmer#4 | 5 | 3 | 0 | 0 | 0 | 0 | 0 |
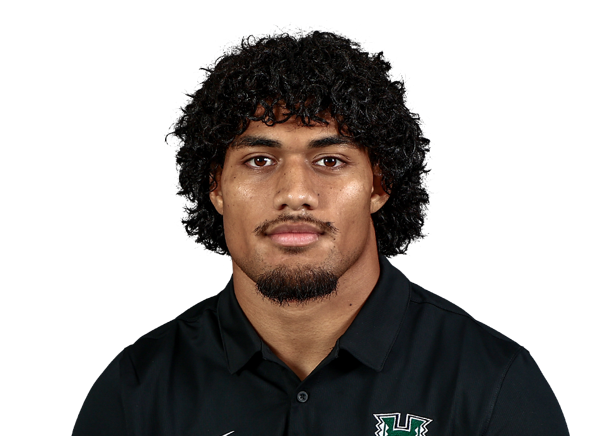 Lesterlaisene Lagafuaina#51 | 4 | 3 | 0 | 1 | 0 | 0 | 0 |
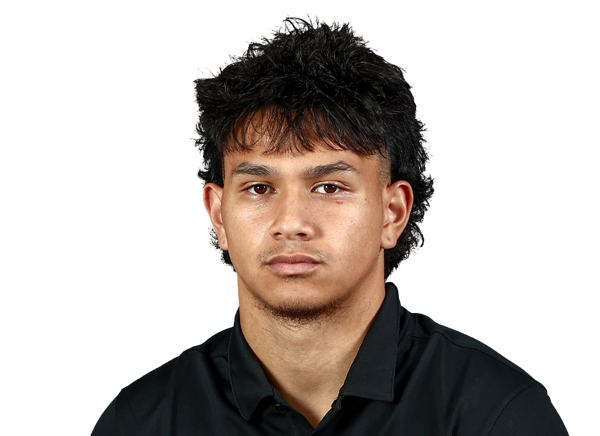 Matteus Ioane#8 | 4 | 3 | 0.5 | 0.5 | 0 | 0 | 0 |
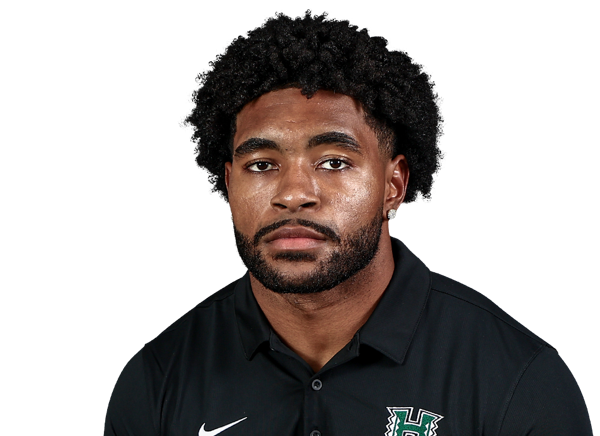 Jamih Otis#11 | 4 | 2 | 0 | 0 | 0 | 0 | 0 |
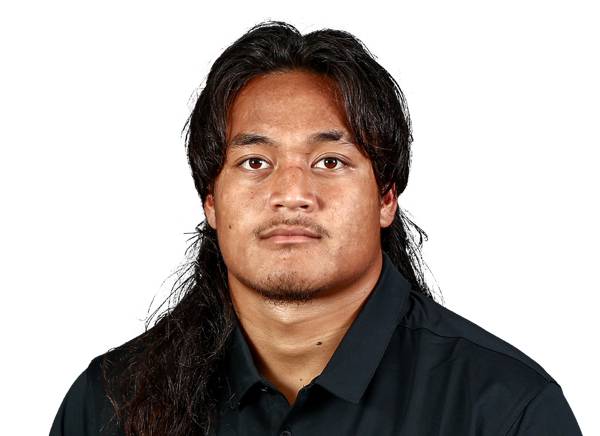 Zoram Petelo#55 | 3 | 2 | 0 | 0 | 0 | 0 | 0 |
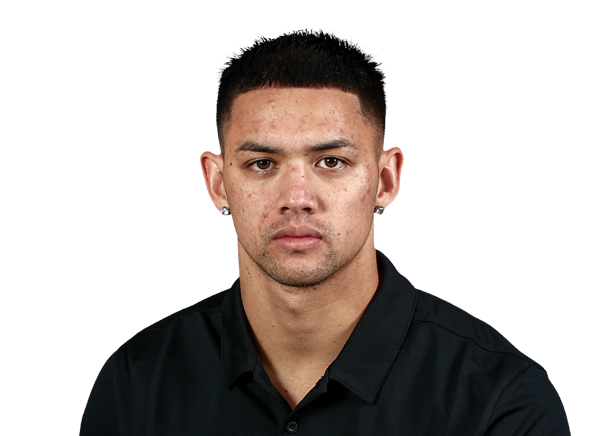 Kona Moore#2 | 3 | 1 | 0 | 0 | 0 | 0 | 0 |
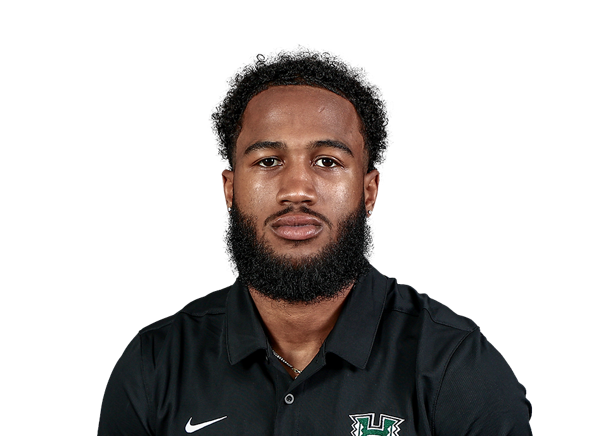 Joenel Figueroa#3 | 2 | 2 | 0 | 0 | 0 | 0 | 0 |
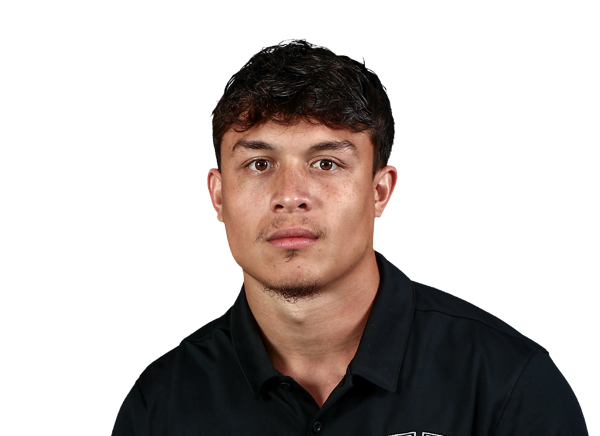 Ezekiel Rodrigues#22 | 2 | 2 | 0 | 0 | 0 | 0 | 0 |
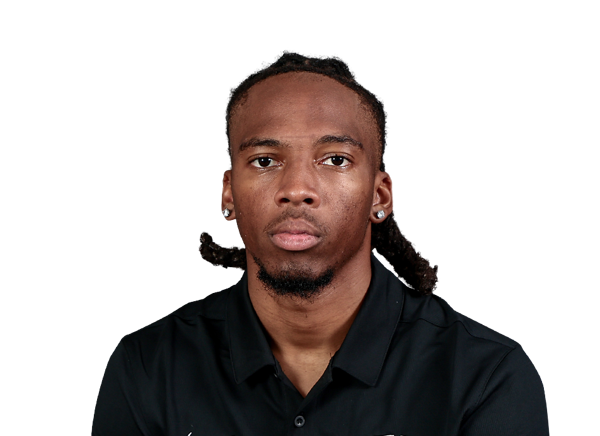 Jeremiah Hughes | 2 | 1 | 0 | 0 | 0 | 0 | 0 |
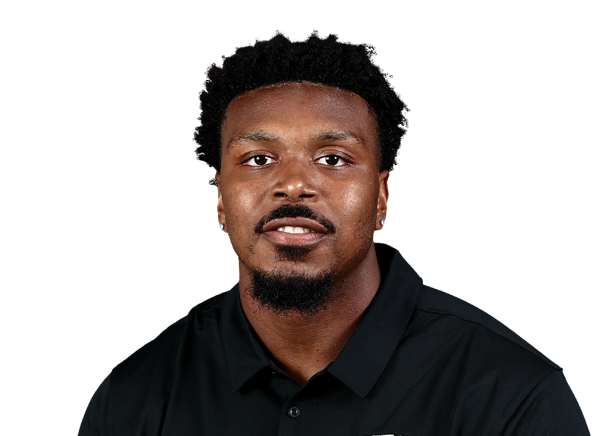 Geoffrey Speight Jr.#95 | 2 | 0 | 0.5 | 0.5 | 0 | 0 | 0 |
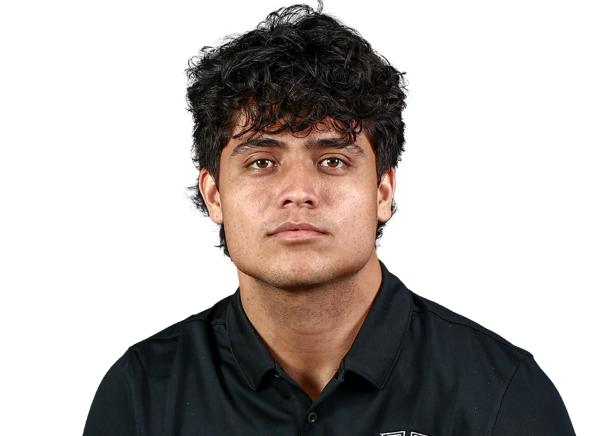 Alika Cavaco-Amoy#43 | 2 | 0 | 0 | 0 | 0 | 0 | 0 |
 Spencer Elliott#56 | 1 | 1 | 1 | 1 | 1 | 2 | 0 |
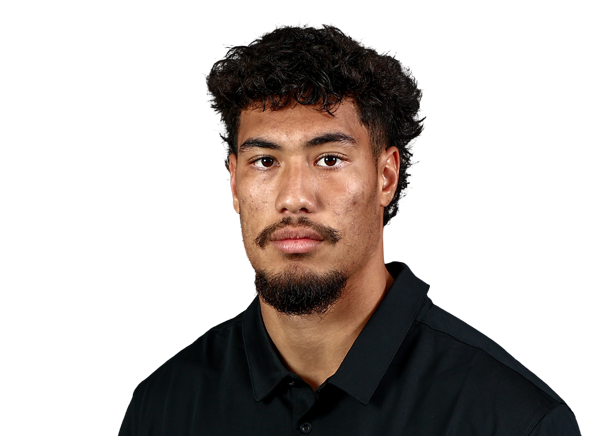 Zaden Mariteragi#18 | 1 | 1 | 0 | 0 | 0 | 0 | 0 |
 Blaze Kamoku#18 | 1 | 1 | 0 | 0 | 0 | 0 | 0 |
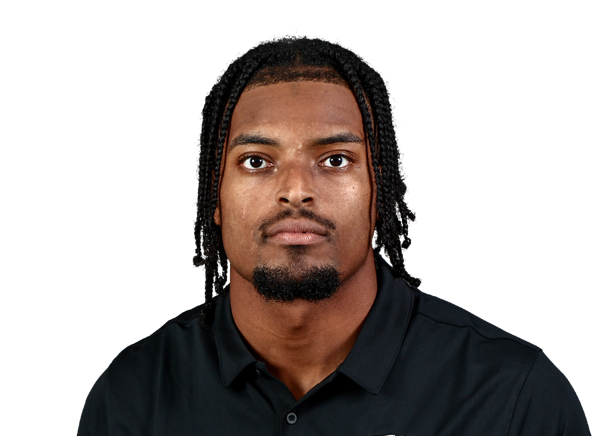 Luther McCoy#52 | 1 | 0 | 0 | 0 | 0 | 0 | 0 |
 Makana Meyer#21 | 1 | 0 | 0 | 0 | 0 | 0 | 0 |
 Riis Weber#14 | 1 | 0 | 0 | 0 | 0 | 0 | 0 |
 Ozzy Pollard#99 | 1 | 0 | 0 | 0 | 0 | 0 | 0 |
Wyoming| Player | TOT | SOLO | SACKS | TFL | PD | QB HUR | TD |
|---|---|---|---|---|---|---|---|
| Jones Thomas#23 | 7 | 6 | 0 | 0.5 | 3 | 1 | 0 |
 Therman Williams#25 | 6 | 6 | 0 | 0 | 1 | 0 | 0 |
 Steven Perez#34 | 6 | 5 | 0 | 1 | 0 | 0 | 0 |
 Brooklyn Cheek#5 | 4 | 4 | 0 | 0 | 0 | 0 | 0 |
 Dainsus Miller | 4 | 3 | 0 | 0 | 0 | 0 | 0 |
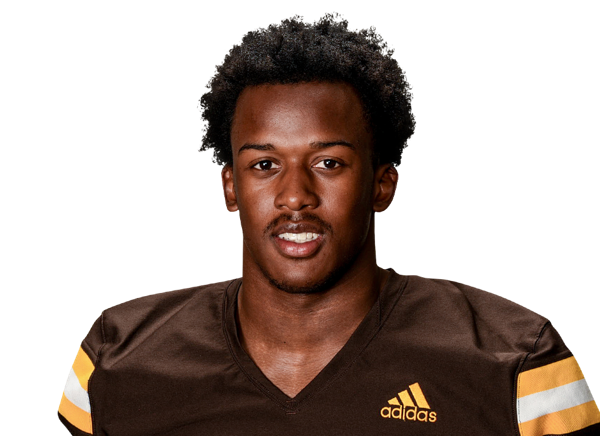 Ian Bell#3 | 4 | 3 | 0 | 0 | 0 | 0 | 0 |
| Jayden Williams (DT)#98 | 3 | 3 | 1 | 1 | 0 | 0 | 0 |
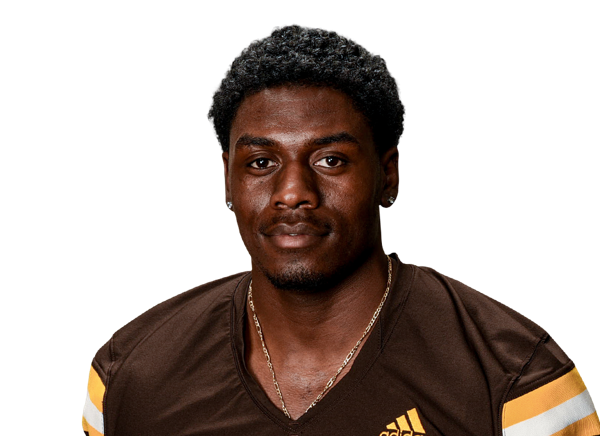 Desman Hearns#1 | 3 | 3 | 0 | 0 | 0 | 0 | 0 |
| Tanielu Maafala-Barbasa#50 | 3 | 2 | 0 | 0 | 0 | 0 | 0 |
 Gary Rutherford#26 | 3 | 1 | 1 | 1 | 0 | 0 | 0 |
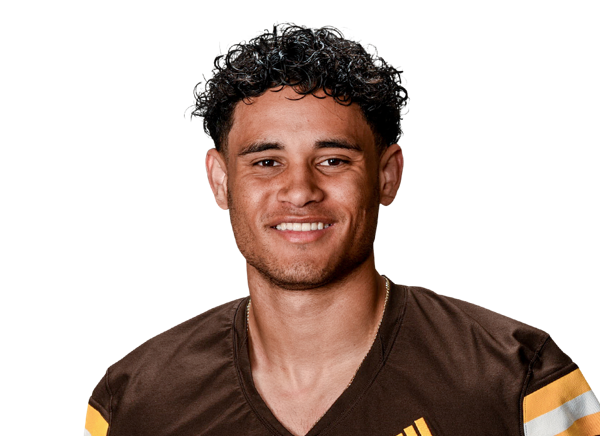 Jaden DaCosta#22 | 3 | 1 | 0 | 0 | 1 | 0 | 0 |
 Ethan Stuhlsatz#42 | 3 | 0 | 0 | 0 | 0 | 0 | 0 |
 Esaia Bogar#11 | 2 | 1 | 1 | 1.5 | 0 | 0 | 0 |
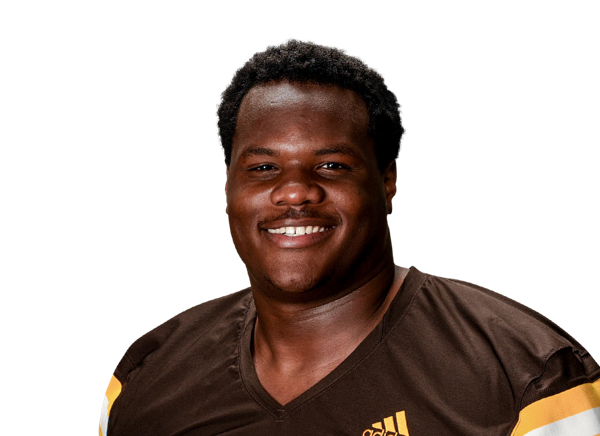 Dante Drake#92 | 2 | 0 | 0 | 0 | 0 | 0 | 0 |
 Jack Dunkley#21 | 2 | 0 | 0 | 0 | 0 | 2 | 0 |
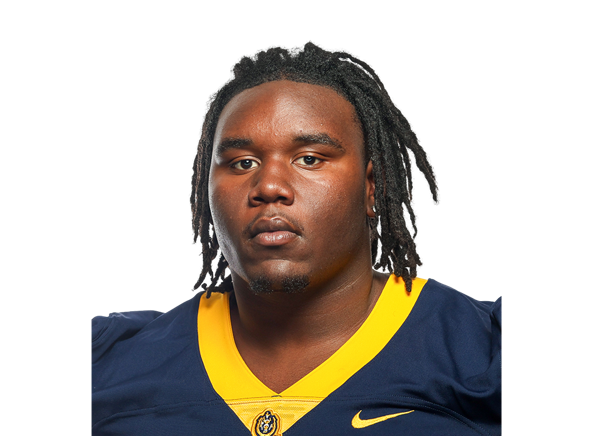 Ja'Quan Redfern#44 | 2 | 0 | 0 | 0 | 0 | 0 | 0 |
 Tegen Seeds#53 | 1 | 0 | 0 | 0 | 0 | 0 | 0 |
Hawai'i| Player | FUM | LOST | REC |
|---|---|---|---|
| Micah Alejado#12 | 1 | 0 | 0 |
Wyoming| Player | FUM | LOST | REC |
|---|---|---|---|
| Tyler Hughes#6 | 1 | 0 | 0 |
Hawai'i| Player | FG | PCT | LONG | XP | PTS |
|---|---|---|---|---|---|
 Sean Olvera-Harle#98 | 1/2 | 50.0 | 28 | 1/1 | 4 |
Wyoming| Player | FG | PCT | LONG | XP | PTS |
|---|---|---|---|---|---|
 Erik Sandvik#47 | 2/2 | 100.0 | 28 | 3/3 | 9 |
Hawai'i| Player | NO | YDS | AVG | TB | In 20 | LONG |
|---|---|---|---|---|---|---|
 Gehrig Heil#47 | 3 | 130 | 43.3 | 0 | 0 | 45 |
Wyoming| Player | NO | YDS | AVG | TB | In 20 | LONG |
|---|---|---|---|---|---|---|
 Bart Edmiston#18 | 2 | 93 | 46.5 | 1 | 1 | 51 |
Hawai'i| Player | NO | YDS | AVG | LONG | TD |
|---|---|---|---|---|---|
| Titan Lacaden#22 | 1 | 14 | 14.0 | 14 | 0 |
Hawai'i| Player | NO | YDS | AVG | LONG | TD |
|---|---|---|---|---|---|
| Tama Uiliata#8 | 1 | 2 | 2.0 | 2 | 0 |
Wyoming| Player | NO | YDS | AVG | LONG | TD |
|---|---|---|---|---|---|
| Charlie Coenen#19 | 2 | 15 | 7.5 | 9 | 0 |
Drive Summary
WYO
Field Goal
64
HAW
Field Goal
55
WYO
Punt
10
HAW
Punt
17
WYO
Field Goal
65
HAW
Punt
20
WYO
Touchdown
60
HAW
Punt
3
WYO
End Of Half
-4
HAW
Downs
74
WYO
Touchdown
99
HAW
Touchdown
75
WYO
Punt
23
HAW
Missed FG
33
WYO
Touchdown
63
HAW
End of Game
56
Injury Report
No current injury report is available for this matchup.
Head-to-Head
Historical meetings are not available for this matchup.
Game Information
StageWeek 4
Season2026
KickoffSat, Sep 26, 3:00 pm
VenueWar Memorial Stadium
LocationLaramie, WY
SurfaceArtificial Turf
BroadcastCW
Attendance20,999
Division Standings
FBS — Mountain West Conference
| Team | W | L | T | Pct | PF | PA | Home | Away | Strk |
|---|---|---|---|---|---|---|---|---|---|
 North Dakota State | 7 | 2 | 0 | 0.778 | 253 | 107 | 5-0 | 2-2 | W1 |
 UNLV | 6 | 4 | 0 | 0.600 | 256 | 248 | 3-2 | 3-2 | W1 |
| Wyoming | 6 | 3 | 0 | 0.667 | 197 | 195 | 4-0 | 2-3 | W4 |
 New Mexico | 8 | 2 | 0 | 0.800 | 328 | 119 | 4-1 | 4-1 | L1 |
 San José State | 5 | 6 | 0 | 0.455 | 212 | 244 | 2-3 | 3-3 | L1 |
 Nevada | 4 | 6 | 0 | 0.400 | 215 | 219 | 2-3 | 2-3 | W1 |
 UTEP | 1 | 8 | 0 | 0.111 | 127 | 309 | 1-4 | 0-4 | L7 |
 Northern Illinois | 0 | 10 | 0 | 0.000 | 156 | 359 | 0-4 | 0-6 | L10 |
 Air Force | 8 | 2 | 0 | 0.800 | 282 | 196 | 5-1 | 3-1 | W3 |
| Hawai'i | 3 | 6 | 0 | 0.333 | 183 | 210 | 1-3 | 2-3 | W2 |
Hawai'i
8th in Mountain West
VS
Wyoming
1st in Mountain West
Quarterbacks & Specialists
#12
Micah Alejado
#47
Gehrig Heil
Receivers & Backs
#81
Frank Abreu
#11
Devin Alves
Cam Barfield
#3
Carson Brown
#6
Kainoa Carvalho
#17
Nick Delgadillo
#2
Audric Harris
#18
Blaze Kamoku
#22
Titan Lacaden
#26
Sitani Mikaele
#1
DeVon Rice
#9
Devon Tauaefa
#8
Tama Uiliata
Defensive Line & Linebackers
#43
Alika Cavaco-Amoy
#56
Spencer Elliott
#12
Wynden Ho'ohuli
#8
Matteus Ioane
#51
Lesterlaisene Lagafuaina
#18
Zaden Mariteragi
#52
Luther McCoy
#11
Jamih Otis
#55
Zoram Petelo
#99
Ozzy Pollard
#95
Geoffrey Speight Jr.
Defensive Backs
#3
Joenel Figueroa
#13
Elijah Gipson
Jeremiah Hughes
#21
Makana Meyer
#2
Kona Moore
#4
Elijah Palmer
#22
Ezekiel Rodrigues
#25
Matagi Thompson
#14
Riis Weber
Other
#98
Sean Olvera-Harle
Quarterbacks & Specialists
#18
Bart Edmiston
#6
Tyler Hughes
Receivers & Backs
#19
Charlie Coenen
#3
Deion DeBlanc
#83
Kyle Frendt
#1
Samuel Harris
#9
Jackson Holman
#8
Markell Holman
#2
Eric Richardson
#87
Isaac Schoenfeld
#80
Tyler Siddons
#89
Jake Wilson
Defensive Line & Linebackers
#11
Esaia Bogar
#92
Dante Drake
#21
Jack Dunkley
#50
Tanielu Maafala-Barbasa
#34
Steven Perez
#44
Ja'Quan Redfern
#26
Gary Rutherford
#53
Tegen Seeds
#42
Ethan Stuhlsatz
#98
Jayden Williams
Defensive Backs
#3
Ian Bell
#5
Brooklyn Cheek
#22
Jaden DaCosta
#1
Desman Hearns
#20
Dainsus Miller
#23
Jones Thomas
#25

Therman Williams
Other
#47
Erik Sandvik
Hawai'i
8th in Mountain West
VS
Wyoming
1st in Mountain West
Passing
60.3
Completion Percentage
63.6
263
Completions
136
2.10
Interception Percentage
3.70
9
Interceptions
8
62
Longest Pass
49
2,740
Net Passing Yards
1,562
274.0
Net Passing Yards Per Game
156.2
436
Passing Attempts
214
2.50
Passing Touchdown %
4.20
11
Passing Touchdowns
9
117.3
Passer Rating
131.4
30
Total Sacks
17
190
Sack Yards Lost
114
6.3
Yards Per Pass Attempt
7.3
2,740
Passing Yards
1,562
0
Passing Fumbles Lost
0
10
Team Games Played
10
360.9
Yards Per Game
354.8
19.6
Total Points Per Game
22.4
196
Total Points
224
22
Total Touchdowns
26
274.0
Passing Yards Per Game
156.2
263-436
Comp-Att
136-214
30-190
Sacks-Yards Lost
17-114
Rushing
284
Rushing Attempts
379
869
Rushing Yards
1,986
3.1
Yards Per Rush Attempt
5.2
33
Long Rushing
68
0
20+ Yard Rushing Plays
0
11
Rushing Touchdowns
17
86.9
Rushing Yards Per Game
198.6
0
Rushing Fumbles
0
0
Rushing Fumbles Lost
0
57
Rushing 1st downs
104
10
Team Games Played
10
3,609
Total Yards
3,548
750
Total Offensive Plays
610
19.6
Total Points Per Game
22.4
196
Total Points
224
22
Total Touchdowns
26
Receiving
263
Receptions
136
0
Receiving Targets
0
2,740
Receiving Yards
1,562
2,740
Receiving Yards
1,562
11
Receiving Touchdowns
9
62
Long Reception
49
0
20+ Yard Receiving Plays
0
274.0
Receiving Yards Per Game
156.2
0
Receiving Fumbles
0
0
Receiving Fumbles Lost
0
1121
Receiving Yards After Catch
841
125
Receiving First Downs
66
10
Team Games Played
10
10.4
Yards Per Reception
11.5
19.6
Total Points Per Game
22.4
196
Total Points
224
22
Total Touchdowns
26
Miscellaneous
209
Total 1st downs
179
57
Rushing 1st downs
104
125
Passing 1st downs
66
28
1st downs by penalty
9
62
Third Down Conversions
36
159
Third Down Attempts
112
38.99
3rd down %
32.14
10
Fourth Down Conversions
12
18
First Downs Attempts
19
55.56
4th down %
63.16
68
Total Penalties
54
545
Total Penalty Yards
432
18759
Possession Time Seconds
18070
0.00
Red Zone Field Goal Percentage
0.00
0.00
Red Zone Scoring Percentage
0.00
0.00
Red Zone Efficiency Percentage
0.00
0.00
Red Zone Touchdown Percentage
0.00
18
Total Takeaways
14
13
Total Giveaways
16
5
Turnover Ratio
-2
0
Fumbles Lost
0
62-159
3rd down efficiency
36-112
10-18
4th down efficiency
12-19
68-545
Total-Yards
54-432
Defense
340
Solo Tackles
360
244
Assist Tackles
338
584
Total Tackles
698
13
Sacks
27
82
Sack Yards
170
65
Stuffs
73
28
Passes Defended
34
3.0
Average Interception Yards
2.8
15
Long Interception
10
0
Miscellaneous Touchdowns
0
4
Kicks Blocked
0
35
Tackles For Loss
48
10
Team Games Played
10
Defensive Interceptions
6
Interceptions
5
18
Interception Yards
14
0
Interception Touchdowns
0
6-18
INT: Total
5-14
General
11
Fumbles
12
8
Forced Fumbles
7
9
Fumbles Recovered
6
0
Fumbles Touchdowns
0
10
Games Played
10
11-0
Fumbles-Lost
12-0
Returning
7
Kick Returns
13
156
Kick Return Yards
291
22.3
Yards Per Kick Return
22.4
69
Long Kick Return
40
0
Kick Return Touchdowns
0
16
Punt Returns
18
84
Punt Return Yards
160
5.3
Yards Per Punt Return
8.9
20
Long Punt Return
24
0
Punt Return Touchdowns
0
0
Punt Return Fair Catches
0
0
Kick Return Fumbles Lost
0
0
Punt Return Fumbles Lost
0
10
Team Games Played
10
16-84
Punt: Total
18-160
Kicking
15
Field Goal Made
14
20
Field Goal Attempts
15
75.0
Field Goal Percentage
93.3
44
Long Field Goal Made
48
0
Field Goal Attempts 1-19
0
6
Field Goal Attempts 20-29
5
6
Field Goal Attempts 30-39
7
6
Field Goal Attempts 40-49
3
2
Field Goal Attempts 50+
0
17
Extra Points Made
26
19
Extra Point Attempts
26
89.5
Extra Point Percentage
100.0
0
Field Goals Made 1-19
0
5
Field Goals Made 20-29
5
6
Field Goals Made 30-39
6
4
Field Goals Made 40-49
3
0
Field Goals Made 50+
0
62
Total Kicking Points
68
10
Team Games Played
10
31
Touchback Percentage
59
0.0
Average Kickoff Return Yards
0.0
0
Kickoff Return Yards
0
0
Kickoff Returns
0
0-0
Kickoffs: Total
0-0
15-20
FG: Good-Attempts
14-15
Punting
47
Punts
33
2,007
Punt Yards
1,599
65
Long Punt
59
42.7
Gross Average Punt Yards
48.5
42.7
Net Average Punt Yards
48.5
0
Punts Blocked
0
22
Punts Inside 20
13
1
Touchbacks
5
14
Fair Catches
12
17
Punt Returns
11
0
Punt Return Yards
0
0.0
Average Punt Return Yards
0.0
10
Team Games Played
10
47-2,007
Punt: Total Yards
33-1,599
Scoring
11
Rushing Touchdowns
17
11
Receiving Touchdowns
9
0
Return Touchdowns
0
22
Total Touchdowns
26
15
Field Goals
14
17
Kick Extra Points
26
1
Total Two Point Conversions
0
196
Total Points
224
19.6
Total Points Per Game
22.4