

Holy Cross vs Miami (OH) Live Score (12 Sep, 2026)
Score by Quarter
| Team | Q1 | Q2 | Q3 | Q4 | Final |
|---|---|---|---|---|---|
 Holy Cross | 0 | 0 | 7 | 0 | 7 |
 Miami (OH) | 14 | 28 | 3 | 0 | 45 |
Scoring Plays
Q1
9:31
9:31
D. McComb run for 3 yds, for a TD (K. McLaughlin KICK)
Rushing Touchdown
0 – 7
Q1
2:16
2:16
D. McComb pass to C. Ross for 34 yds, for a TD (K. McLaughlin KICK)
Passing Touchdown
0 – 14
Q2
13:35
13:35
D. Jones run for 2 yds, for a TD (K. McLaughlin KICK)
Rush
0 – 21
Q2
10:31
10:31
D. McComb pass to D. Witten for 10 yds, for a TD (K. McLaughlin KICK)
Passing Touchdown
0 – 28
Q2
8:26
8:26
punt blocked by S. Smith (K. McLaughlin KICK)
Punt
0 – 35
Q2
1:11
1:11
D. McComb pass to L. Billups-Williams for 28 yds, for a TD (K. McLaughlin KICK)
Passing Touchdown
0 – 42
Q3
5:25
5:25
K. McLaughlin 24 yd FG GOOD
Field Goal Good
0 – 45
Q3
0:30
0:30
D. Lynch pass to L. Fisher for 15 yds, for a TD (O. Saraceno KICK)
Passing Touchdown
7 – 45
Game Leaders
Holy CrossMiami (OH)
 D. Lynch QB
Passing Yards
 D. McComb QB
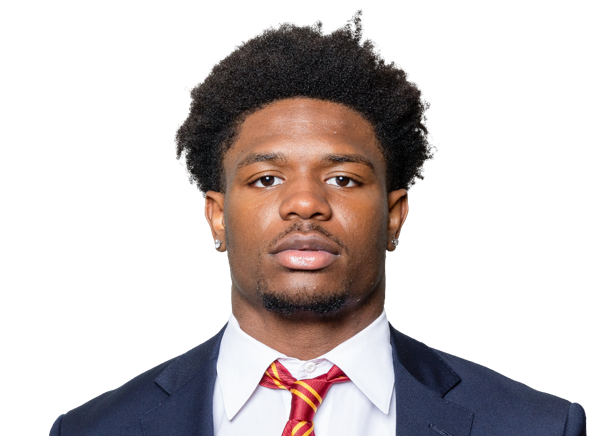 D. Jones RB
Rushing Yards
 D. Jones RB
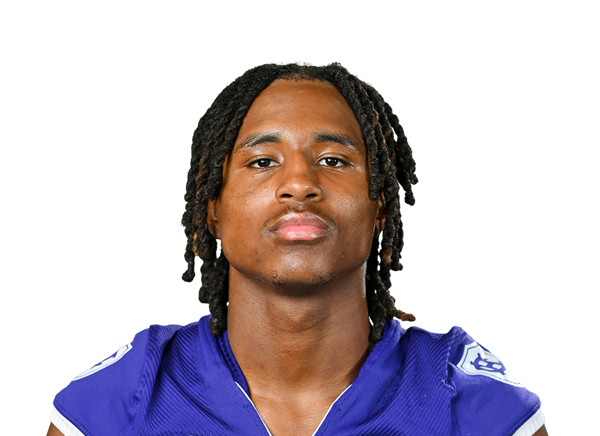 S. Gordon WR
Receiving Yards
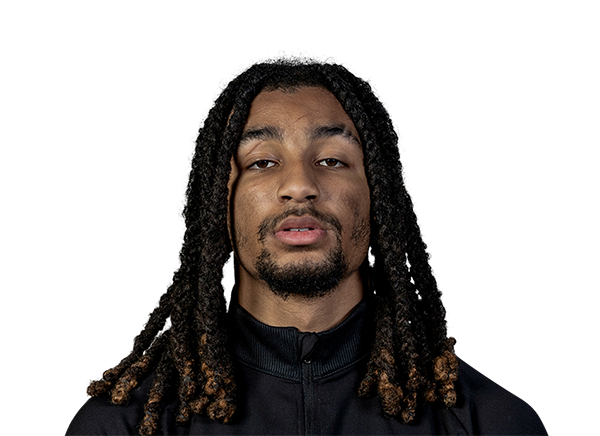 L. Billups-Williams WR
 W. Miller LB
Tackles
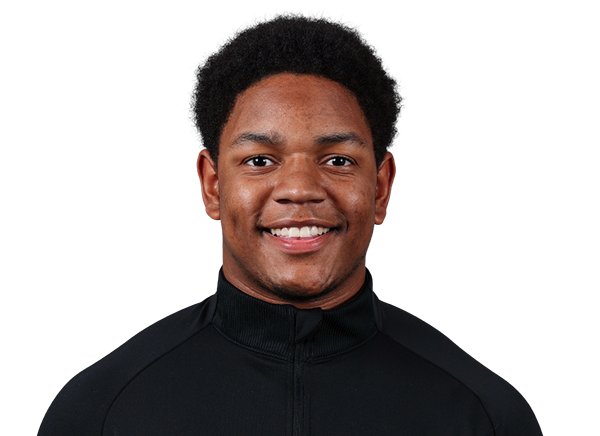 M. McCain LB
—
Sacks
 T. Dikos LB
Player Box Score
Holy Cross| Player | C/ATT | YDS | AVG | TD | INT |
|---|---|---|---|---|---|
| David Lynch#16 | 13/25 | 141 | 5.6 | 1 | 0 |
Miami (OH)| Player | C/ATT | YDS | AVG | TD | INT |
|---|---|---|---|---|---|
| David McComb#16 | 13/13 | 234 | 18.0 | 3 | 0 |
 Caleb Heavner#6 | 1/2 | 2 | 1.0 | 0 | 0 |
Holy Cross| Player | CAR | YDS | AVG | TD | LONG |
|---|---|---|---|---|---|
| Datrell Jones#1 | 3 | 18 | 6.0 | 0 | 14 |
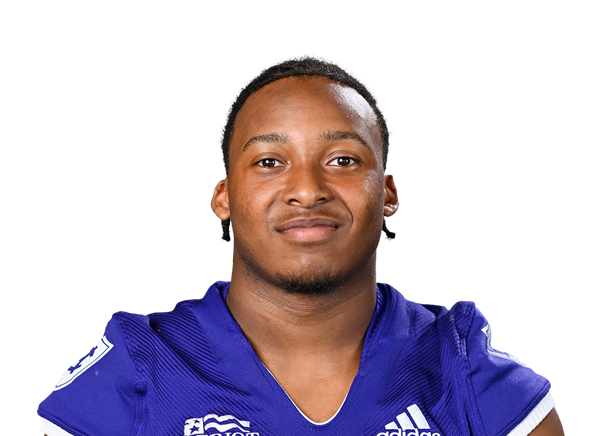 Joseph Williams | 8 | 16 | 2.0 | 0 | 6 |
| Jake Croce#40 | 2 | 6 | 3.0 | 0 | 4 |
 Cal Swanson#6 | 3 | 4 | 1.3 | 0 | 4 |
| David Lynch#16 | 3 | -4 | -1.3 | 0 | 6 |
Miami (OH)| Player | CAR | YDS | AVG | TD | LONG |
|---|---|---|---|---|---|
| D'Shawntae Jones#9 | 7 | 47 | 6.7 | 1 | 22 |
 Lazaro Rogers#21 | 4 | 36 | 9.0 | 0 | 19 |
 Cade Yacamelli#20 | 6 | 26 | 4.3 | 0 | 12 |
| Chancellor Sparks#22 | 8 | 25 | 3.1 | 0 | 8 |
| Caleb Heavner#6 | 4 | 21 | 5.3 | 0 | 11 |
 Rodney Nelson | 4 | 18 | 4.5 | 0 | 10 |
| David McComb#16 | 3 | 12 | 4.0 | 1 | 6 |
| Scoop Smith#24 | 1 | 10 | 10.0 | 0 | 10 |
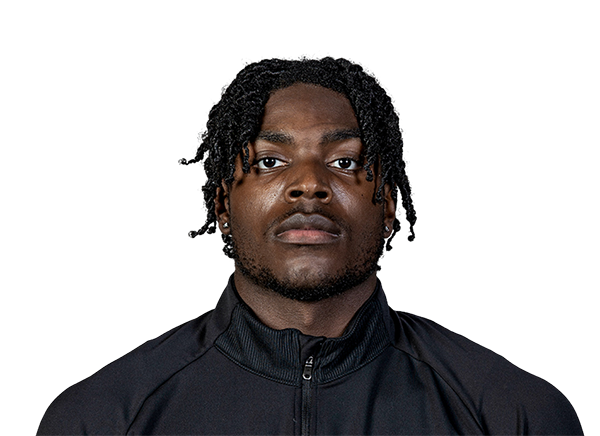 Toney Coleman Jr.#21 | 1 | 7 | 7.0 | 0 | 7 |
| Team | 1 | -1 | -1.0 | 0 | 1 |
Holy Cross| Player | REC | YDS | AVG | TD | LONG |
|---|---|---|---|---|---|
| SirCharles Gordon#88 | 3 | 54 | 18.0 | 0 | 36 |
 Lincoln Fisher#2 | 3 | 31 | 10.3 | 1 | 15 |
| Joseph Williams | 1 | 21 | 21.0 | 0 | 21 |
| Jake Croce#40 | 3 | 21 | 7.0 | 0 | 8 |
 Lucas Weir#13 | 1 | 13 | 13.0 | 0 | 13 |
 Ty Curran#3 | 2 | 1 | 0.5 | 0 | 2 |
Miami (OH)| Player | REC | YDS | AVG | TD | LONG |
|---|---|---|---|---|---|
| Lynel Billups-Williams#10 | 4 | 73 | 18.3 | 1 | 28 |
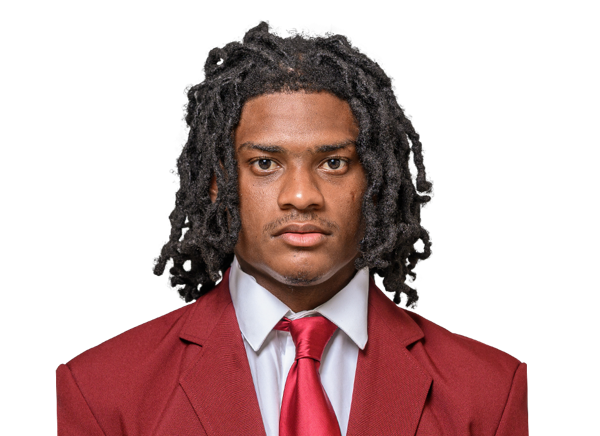 Maleek Huggins#1 | 3 | 54 | 18.0 | 0 | 28 |
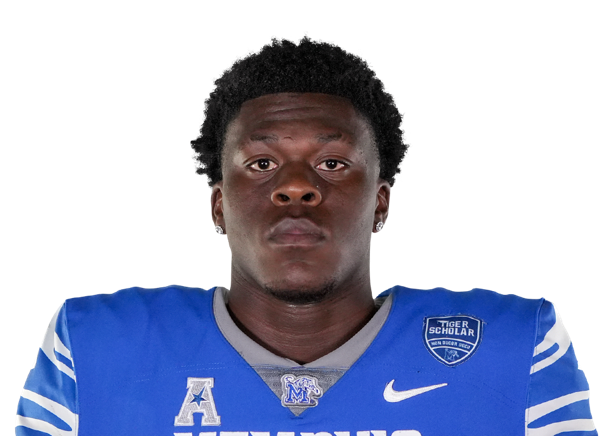 Christian Ross#15 | 3 | 51 | 17.0 | 1 | 34 |
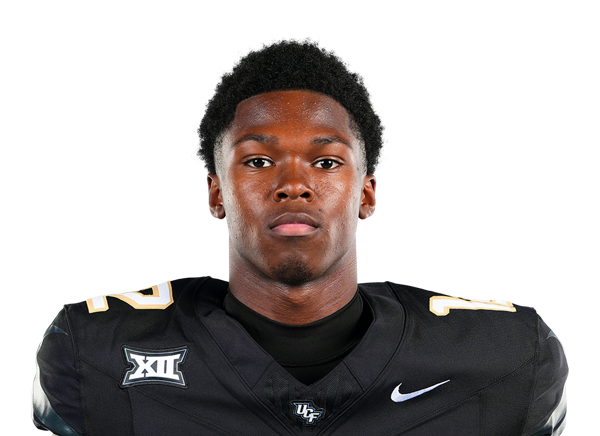 Carl Jenkins#2 | 1 | 23 | 23.0 | 0 | 23 |
| Scoop Smith#24 | 1 | 23 | 23.0 | 0 | 23 |
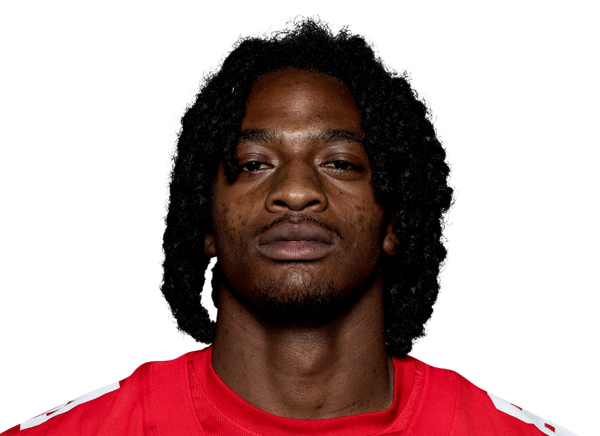 Damarion Witten#8 | 1 | 10 | 10.0 | 1 | 10 |
| Quintin Simmons#3 | 1 | 2 | 2.0 | 0 | 2 |
Holy Cross| Player | TOT | SOLO | SACKS | TFL | PD | QB HUR | TD |
|---|---|---|---|---|---|---|---|
| Will Miller#53 | 8 | 3 | 0 | 0.5 | 0 | 0 | 0 |
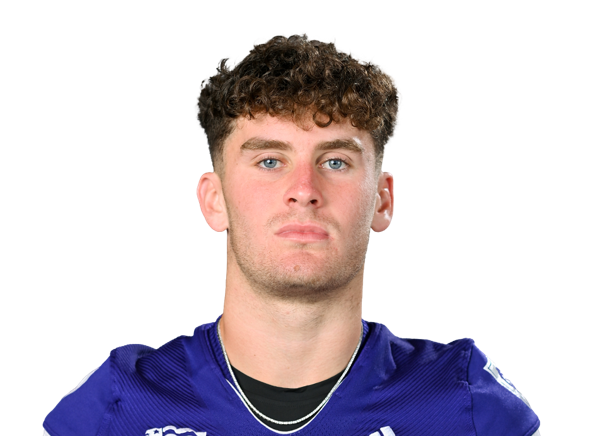 Braden Haas#14 | 7 | 4 | 0 | 0 | 0 | 0 | 0 |
 Adam Due#8 | 6 | 3 | 0 | 0 | 0 | 0 | 0 |
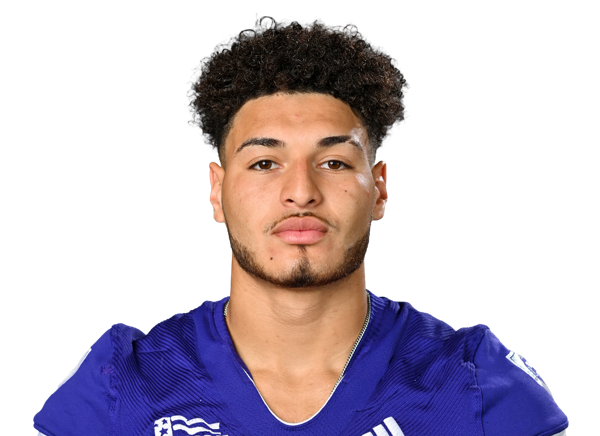 Ron Burton#22 | 5 | 2 | 0 | 1 | 0 | 0 | 0 |
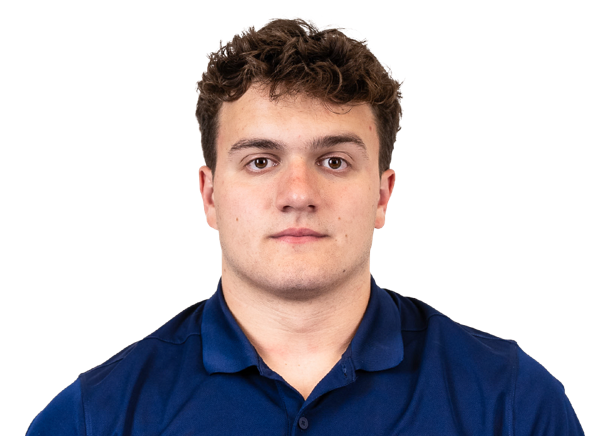 Cooper Ackerman#55 | 4 | 2 | 0 | 0 | 0 | 0 | 0 |
 Chisom Onwuzurigbo#7 | 4 | 2 | 0 | 0 | 0 | 0 | 0 |
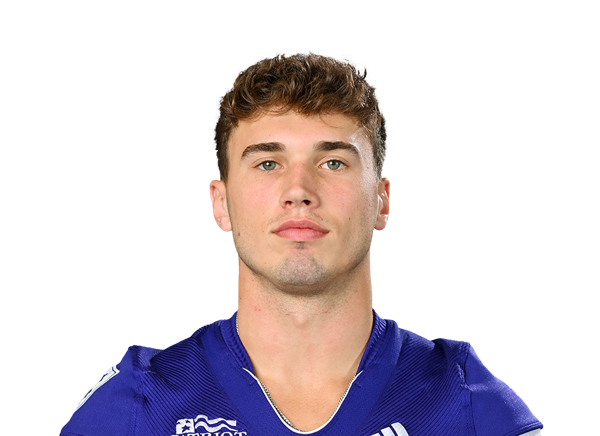 Carlo Crocetti#6 | 3 | 1 | 0 | 0.5 | 0 | 0 | 0 |
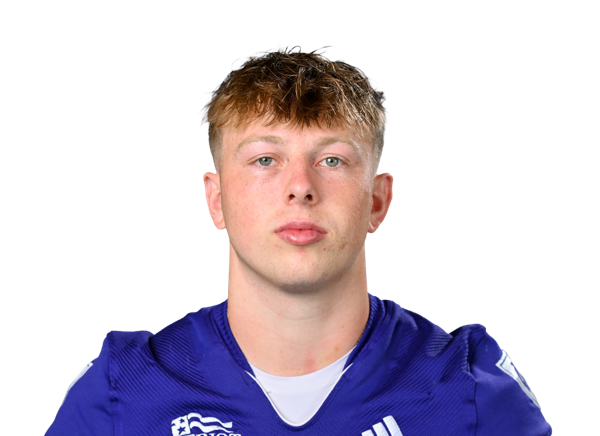 Garrett Baldwin#20 | 3 | 1 | 0 | 0 | 0 | 0 | 0 |
 Daniel Leupold#32 | 3 | 1 | 0 | 0 | 0 | 0 | 0 |
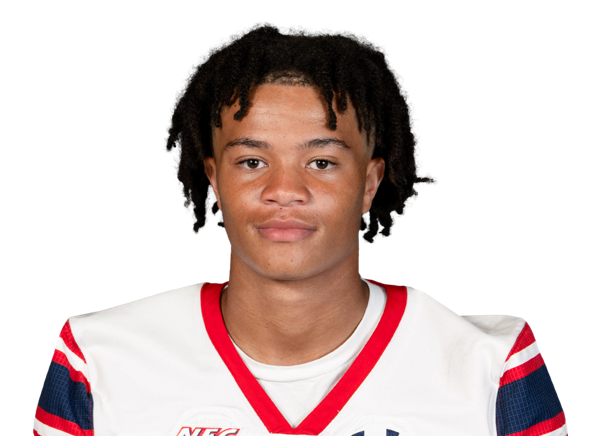 Cam Boone#12 | 2 | 2 | 0 | 0 | 1 | 0 | 0 |
 Aidan Horodnik#95 | 2 | 2 | 0 | 1 | 0 | 0 | 0 |
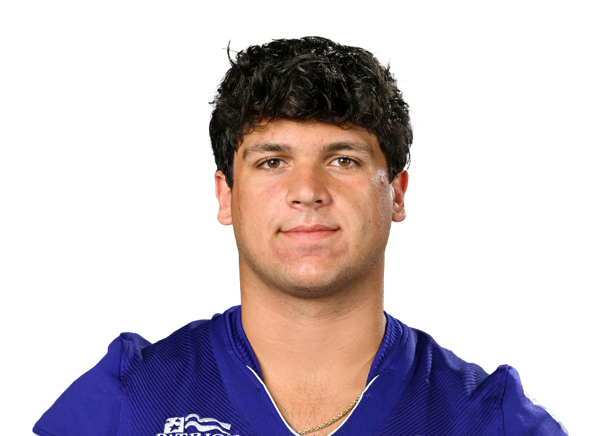 Vin Ferrara#97 | 2 | 2 | 0 | 0 | 0 | 0 | 0 |
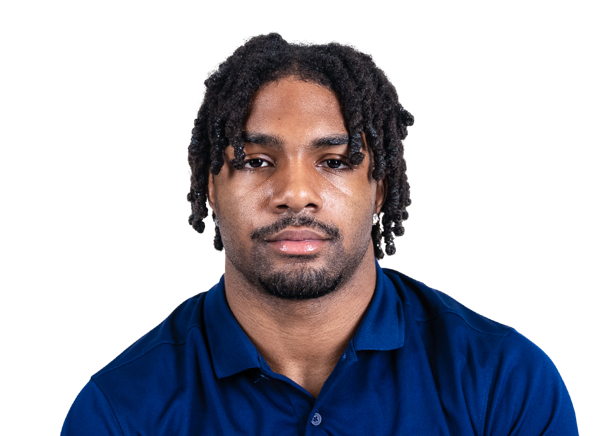 Chase Fountain#27 | 2 | 1 | 0 | 0 | 0 | 0 | 0 |
 Gabe Flores#50 | 2 | 1 | 0 | 0 | 0 | 0 | 0 |
 Anthony Redfern#21 | 2 | 1 | 0 | 0 | 0 | 0 | 0 |
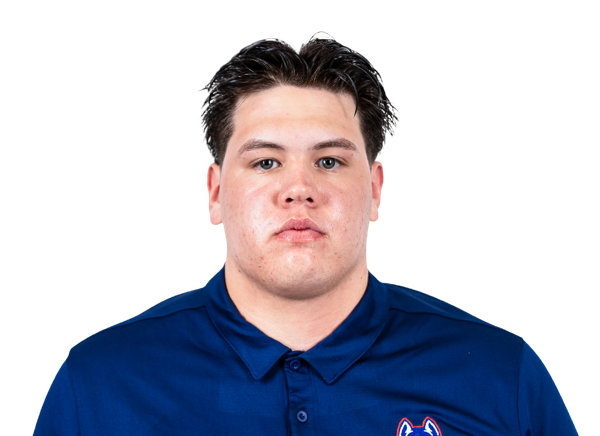 Brady Fodor#91 | 1 | 1 | 0 | 0 | 0 | 0 | 0 |
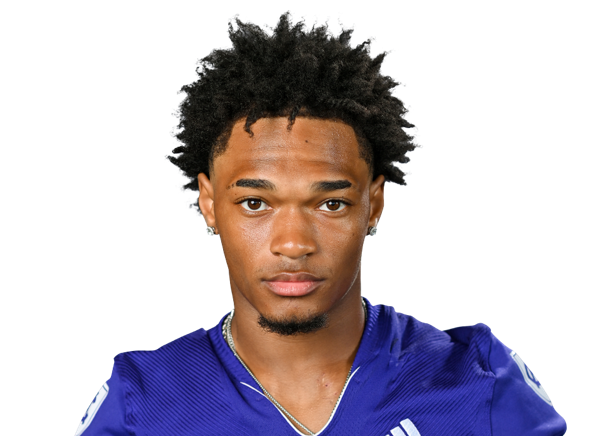 Cameron Mills#37 | 1 | 1 | 0 | 0 | 0 | 0 | 0 |
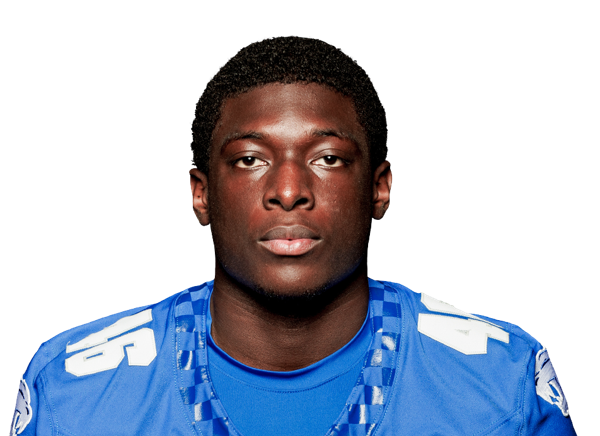 Rushaune Vilane#42 | 1 | 1 | 0 | 0 | 0 | 0 | 0 |
| Mateo Brink#43 | 1 | 1 | 0 | 0 | 0 | 0 | 0 |
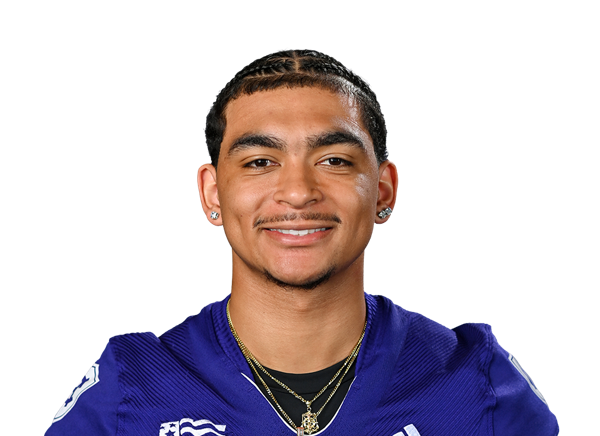 Marco Coleman#19 | 1 | 0 | 0 | 0 | 0 | 0 | 0 |
| Lincoln Fisher#2 | 1 | 0 | 0 | 0 | 0 | 0 | 0 |
| Dylan Manuilow#92 | 1 | 0 | 0 | 0 | 0 | 0 | 0 |
Miami (OH)| Player | TOT | SOLO | SACKS | TFL | PD | QB HUR | TD |
|---|---|---|---|---|---|---|---|
| Malcolm McCain#3 | 5 | 3 | 0 | 1 | 0 | 0 | 0 |
 Blayne Myrick#15 | 4 | 1 | 0 | 1 | 0 | 0 | 0 |
| Vito McConnell#37 | 4 | 1 | 0 | 0 | 0 | 1 | 0 |
| Tyler Dikos#35 | 3 | 3 | 1 | 1 | 0 | 0 | 0 |
 Dillon Tatum#1 | 3 | 0 | 0 | 0 | 0 | 0 | 0 |
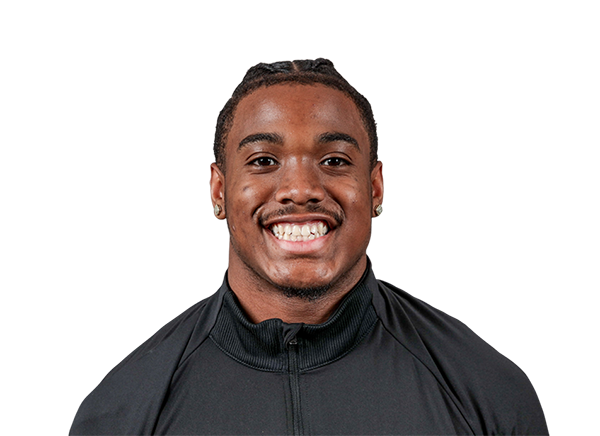 Christian McKinney#16 | 3 | 0 | 0 | 0 | 0 | 0 | 0 |
| Toney Coleman Jr.#21 | 2 | 2 | 0 | 0 | 0 | 0 | 0 |
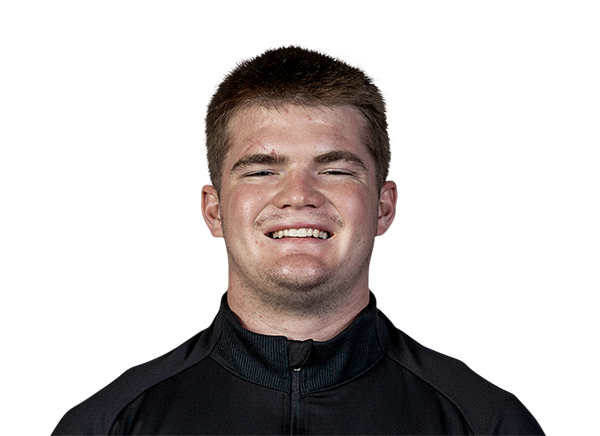 Brach Rice#4 | 2 | 1 | 0 | 1 | 0 | 1 | 0 |
| Isaiah Rollins#18 | 2 | 1 | 0 | 0 | 0 | 0 | 0 |
 Grant Lyons#43 | 2 | 0 | 0 | 0 | 0 | 1 | 0 |
 Eli Coppess#26 | 2 | 0 | 0 | 0 | 1 | 0 | 0 |
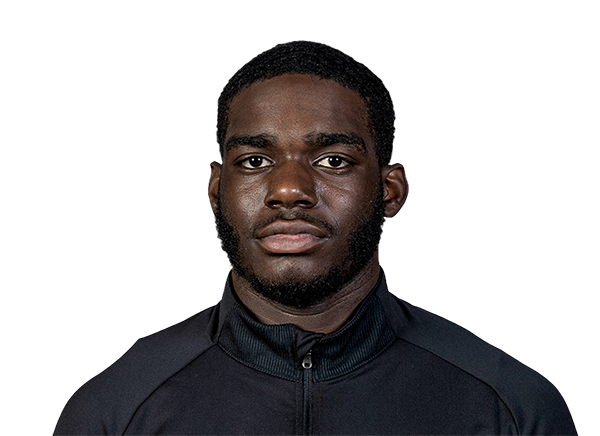 Jermaine Agee#6 | 2 | 0 | 0 | 0 | 0 | 0 | 0 |
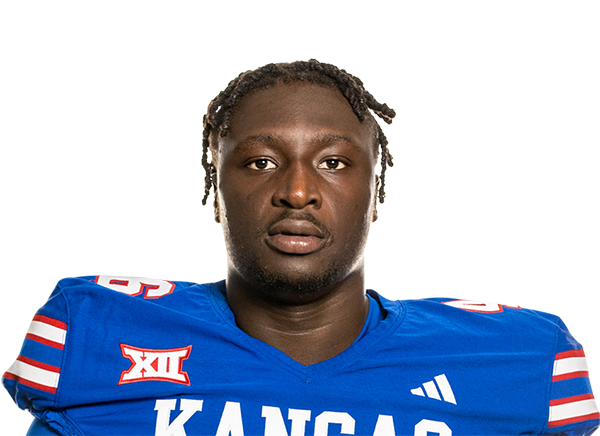 Bai Jobe#22 | 1 | 1 | 0 | 0 | 0 | 0 | 0 |
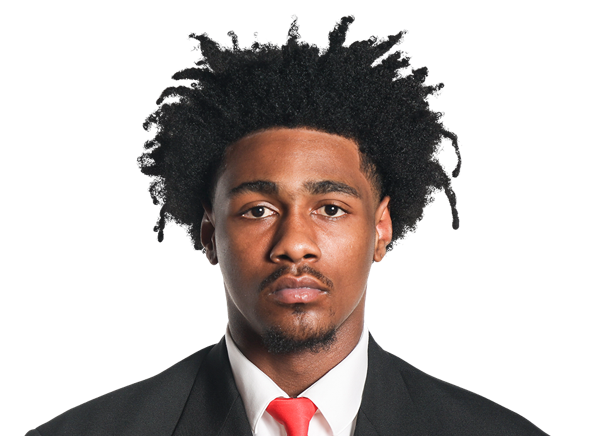 Amariyun Knighten | 1 | 1 | 0 | 0 | 1 | 0 | 0 |
 Luke Myers#14 | 1 | 1 | 0 | 0 | 0 | 0 | 0 |
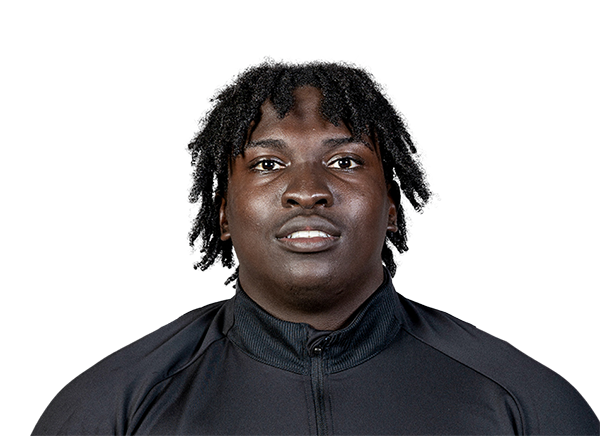 OJ Alexander#99 | 1 | 1 | 0 | 0 | 0 | 0 | 0 |
 Mychal Yharbrough#24 | 1 | 0 | 0 | 0 | 0 | 0 | 0 |
 Jackson Pons#2 | 1 | 0 | 0 | 0 | 0 | 0 | 0 |
 Javon Hammonds#9 | 1 | 0 | 0 | 0 | 0 | 0 | 0 |
 Marcus Moore#52 | 1 | 0 | 0 | 0 | 0 | 0 | 0 |
 Zhaiylen Scott#20 | 1 | 0 | 0 | 0 | 0 | 0 | 0 |
| Carson Noonan#67 | 1 | 0 | 0 | 0 | 0 | 0 | 0 |
 James Schott#32 | 0 | 0 | 0 | 0 | 0 | 1 | 0 |
 Leo Colombi#28 | 0 | 0 | 0 | 0 | 0 | 0 | 1 |
 Donovan Davis#90 | 0 | 0 | 0 | 0 | 0 | 1 | 0 |
Miami (OH)| Player | FUM | LOST | REC |
|---|---|---|---|
| Chancellor Sparks#22 | 1 | 0 | 0 |
Holy Cross| Player | FG | PCT | LONG | XP | PTS |
|---|---|---|---|---|---|
 Owen Saraceno#36 | 0/0 | 0.0 | 0 | 1/1 | 1 |
Miami (OH)| Player | FG | PCT | LONG | XP | PTS |
|---|---|---|---|---|---|
 Kellan McLaughlin#38 | 1/1 | 100.0 | 24 | 6/6 | 9 |
Holy Cross| Player | NO | YDS | AVG | TB | In 20 | LONG |
|---|---|---|---|---|---|---|
 Ethan Moss#49 | 3 | 98 | 32.7 | 0 | 0 | 38 |
 Alessandro Garrett#48 | 2 | 67 | 33.5 | 0 | 0 | 34 |
| Team | 1 | 0 | 0.0 | 0 | 0 | 0 |
Miami (OH)| Player | NO | YDS | AVG | TB | In 20 | LONG |
|---|---|---|---|---|---|---|
 Pierse Stainton#34 | 1 | 40 | 40.0 | 0 | 1 | 40 |
Miami (OH)| Player | NO | YDS | AVG | LONG | TD |
|---|---|---|---|---|---|
| Leo Colombi#28 | 0 | 0 | 0.0 | 0 | 1 |
| Lynel Billups-Williams#10 | 1 | 0 | 0.0 | 0 | 0 |
| Scoop Smith#24 | 1 | 0 | 0.0 | 0 | 0 |
Drive Summary
HC
Punt
3
M-OH
Touchdown
58
HC
Punt
12
M-OH
Touchdown
75
HC
Punt
-1
M-OH
Touchdown
54
HC
Punt
-1
M-OH
Touchdown
58
HC
Punt Return Touchdown
5
HC
Downs
52
M-OH
Touchdown
77
HC
End Of Half
12
M-OH
Field Goal
69
HC
Touchdown
75
M-OH
Punt
25
HC
Punt
24
M-OH
End Of Quarter
15
Injury Report
No current injury report is available for this matchup.
Head-to-Head
Historical meetings are not available for this matchup.
Game Information
StageWeek 2
Season2026
KickoffSat, Sep 12, 1:00 pm
VenueYager Stadium
LocationOxford, OH
SurfaceArtificial Turf
BroadcastESPN+
Division Standings
FCS — Patriot League
| Team | W | L | T | Pct | PF | PA | Home | Away | Strk |
|---|---|---|---|---|---|---|---|---|---|
 Lehigh | 0 | 0 | 0 | .000 | 0 | 0 | — | — | — |
 Colgate | 0 | 1 | 0 | 0.000 | 10 | 13 | 0-0 | 0-1 | L1 |
 William & Mary | 0 | 1 | 0 | 0.000 | 7 | 62 | 0-0 | 0-1 | L1 |
 Richmond | 0 | 1 | 0 | 0.000 | 0 | 73 | 0-0 | 0-1 | L1 |
 Villanova | 0 | 1 | 0 | 0.000 | 13 | 59 | 0-0 | 0-1 | L1 |
 Lafayette | 0 | 1 | 0 | 0.000 | 7 | 56 | 0-0 | 0-1 | L1 |
 Georgetown | 0 | 0 | 0 | .000 | 0 | 0 | — | — | — |
 Fordham | 0 | 2 | 0 | 0.000 | 7 | 83 | 0-0 | 0-2 | L2 |
 Bucknell | 0 | 1 | 0 | 0.000 | 0 | 59 | 0-0 | 0-1 | L1 |
| Holy Cross | 0 | 1 | 0 | 0.000 | 7 | 45 | 0-0 | 0-1 | L1 |
FBS — Mid-American Conference
| Team | W | L | T | Pct | PF | PA | Home | Away | Strk |
|---|---|---|---|---|---|---|---|---|---|
 Eastern Michigan | 4 | 6 | 0 | 0.400 | 199 | 266 | 2-3 | 2-3 | L3 |
 Buffalo | 6 | 3 | 0 | 0.667 | 215 | 234 | 4-1 | 2-2 | W4 |
 Massachusetts | 5 | 4 | 0 | 0.556 | 243 | 199 | 3-2 | 2-2 | W1 |
 Central Michigan | 4 | 5 | 0 | 0.444 | 178 | 214 | 3-2 | 1-3 | W1 |
 Kent State | 3 | 6 | 0 | 0.333 | 129 | 275 | 3-1 | 0-5 | L1 |
| Miami (OH) | 5 | 4 | 0 | 0.556 | 247 | 240 | 3-2 | 2-2 | L1 |
 Akron | 1 | 8 | 0 | 0.111 | 172 | 290 | 1-3 | 0-5 | L7 |
 Ball State | 3 | 6 | 0 | 0.333 | 206 | 313 | 2-1 | 1-5 | L1 |
 Bowling Green | 2 | 7 | 0 | 0.222 | 160 | 261 | 1-3 | 1-4 | L3 |
 Ohio | 7 | 2 | 0 | 0.778 | 265 | 195 | 4-0 | 3-2 | W6 |
 Toledo | 7 | 2 | 0 | 0.778 | 319 | 220 | 4-1 | 3-1 | W3 |
 Western Michigan | 6 | 3 | 0 | 0.667 | 236 | 173 | 3-1 | 3-2 | W1 |
 Sacramento State | 2 | 8 | 0 | 0.200 | 170 | 293 | 2-4 | 0-4 | L1 |
Holy Cross
3rd in Patriot
VS
Miami (OH)
5th in MAC
Quarterbacks & Specialists
#16
David Lynch
#6
Cal Swanson
Receivers & Backs
#40
Jake Croce
#3
Ty Curran
#2
Lincoln Fisher
#88
SirCharles Gordon
#1
Datrell Jones
#13
Lucas Weir
Joseph Williams
Defensive Line & Linebackers
#55
Cooper Ackerman
#43
Mateo Brink
#22
Ron Burton
#8
Adam Due
#97
Vin Ferrara
#50
Gabe Flores
#91
Brady Fodor
#95
Aidan Horodnik
#32
Daniel Leupold
#92
Dylan Manuilow
#53
Will Miller
Defensive Backs
#20
Garrett Baldwin
#12
Cam Boone
#19
Marco Coleman
#27
Chase Fountain
#14
Braden Haas
#37
Cameron Mills
#7
Chisom Onwuzurigbo
#21
Anthony Redfern
Other
#6
Carlo Crocetti
#48
Alessandro Garrett
#49
Ethan Moss
#36
Owen Saraceno
#42
Rushaune Vilane
Quarterbacks & Specialists
#6
Caleb Heavner
#16
David McComb
#34
Pierse Stainton
Receivers & Backs
#10
Lynel Billups-Williams
#1
Maleek Huggins
#2
Carl Jenkins
#9
D'Shawntae Jones
Rodney Nelson
#21
Lazaro Rogers
#15
Christian Ross
#3
Quintin Simmons
#24
Scoop Smith
#22
Chancellor Sparks
#8
Damarion Witten
#20
Cade Yacamelli
Defensive Line & Linebackers
#99
OJ Alexander
#26
Eli Coppess
#90
Donovan Davis
#35
Tyler Dikos
#9
Javon Hammonds
#22
Bai Jobe
#43
Grant Lyons
#3
Malcolm McCain
#37
Vito McConnell
#16
Christian McKinney
#52
Marcus Moore
#14
Luke Myers
#15
Blayne Myrick
#67
Carson Noonan
#4
Brach Rice
#32
James Schott
#20
Zhaiylen Scott
Defensive Backs
#6
Jermaine Agee
#21
Toney Coleman Jr.
#28
Leo Colombi
Amariyun Knighten
#2
Jackson Pons
#18
Isaiah Rollins
#1
Dillon Tatum
#24
Mychal Yharbrough
Other
#38
Kellan McLaughlin
Holy Cross
2nd in Patriot
VS
Miami (OH)
5th in MAC
Passing
55.3
Completion Percentage
58.1
163
Completions
133
3.70
Interception Percentage
2.20
11
Interceptions
5
59
Longest Pass
75
1,817
Net Passing Yards
1,890
181.7
Net Passing Yards Per Game
210.0
295
Passing Attempts
229
5.80
Passing Touchdown %
4.80
17
Passing Touchdowns
11
119.0
Passer Rating
139.3
9
Total Sacks
25
79
Sack Yards Lost
174
6.2
Yards Per Pass Attempt
8.3
1,817
Passing Yards
1,890
0
Passing Fumbles Lost
0
10
Team Games Played
9
334.8
Yards Per Game
357.2
23.5
Total Points Per Game
27.4
235
Total Points
247
32
Total Touchdowns
30
181.7
Passing Yards Per Game
210.0
163-295
Comp-Att
133-229
9-79
Sacks-Yards Lost
25-174
Rushing
336
Rushing Attempts
307
1,531
Rushing Yards
1,325
4.6
Yards Per Rush Attempt
4.3
62
Long Rushing
69
0
20+ Yard Rushing Plays
0
14
Rushing Touchdowns
15
153.1
Rushing Yards Per Game
147.2
0
Rushing Fumbles
0
0
Rushing Fumbles Lost
0
82
Rushing 1st downs
80
10
Team Games Played
9
3,348
Total Yards
3,215
640
Total Offensive Plays
561
23.5
Total Points Per Game
27.4
235
Total Points
247
32
Total Touchdowns
30
Receiving
163
Receptions
133
0
Receiving Targets
0
1,817
Receiving Yards
1,890
1,817
Receiving Yards
1,890
17
Receiving Touchdowns
11
59
Long Reception
75
0
20+ Yard Receiving Plays
0
181.7
Receiving Yards Per Game
210.0
0
Receiving Fumbles
0
0
Receiving Fumbles Lost
0
104
Receiving Yards After Catch
770
86
Receiving First Downs
77
10
Team Games Played
9
11.1
Yards Per Reception
14.2
23.5
Total Points Per Game
27.4
235
Total Points
247
32
Total Touchdowns
30
Miscellaneous
189
Total 1st downs
178
82
Rushing 1st downs
80
87
Passing 1st downs
77
20
1st downs by penalty
21
48
Third Down Conversions
38
123
Third Down Attempts
107
39.02
3rd down %
35.51
6
Fourth Down Conversions
7
14
First Downs Attempts
10
42.86
4th down %
70.00
53
Total Penalties
66
495
Total Penalty Yards
580
18249
Possession Time Seconds
16684
0.00
Red Zone Field Goal Percentage
0.00
0.00
Red Zone Scoring Percentage
0.00
0.00
Red Zone Efficiency Percentage
0.00
0.00
Red Zone Touchdown Percentage
0.00
18
Total Takeaways
9
14
Total Giveaways
7
4
Turnover Ratio
2
0
Fumbles Lost
0
48-123
3rd down efficiency
38-107
6-14
4th down efficiency
7-10
53-495
Total-Yards
66-580
Defense
335
Solo Tackles
268
320
Assist Tackles
302
655
Total Tackles
570
17
Sacks
17
110
Sack Yards
102
84
Stuffs
68
37
Passes Defended
34
7.4
Average Interception Yards
11.9
36
Long Interception
36
0
Miscellaneous Touchdowns
0
1
Kicks Blocked
2
37
Tackles For Loss
26
10
Team Games Played
9
Defensive Interceptions
9
Interceptions
7
67
Interception Yards
83
1
Interception Touchdowns
1
9-67
INT: Total
7-83
General
9
Fumbles
8
8
Forced Fumbles
5
7
Fumbles Recovered
4
0
Fumbles Touchdowns
0
10
Games Played
9
9-0
Fumbles-Lost
8-0
Returning
27
Kick Returns
14
502
Kick Return Yards
343
18.6
Yards Per Kick Return
24.5
51
Long Kick Return
98
0
Kick Return Touchdowns
1
17
Punt Returns
10
74
Punt Return Yards
104
4.4
Yards Per Punt Return
10.4
12
Long Punt Return
38
0
Punt Return Touchdowns
2
0
Punt Return Fair Catches
0
0
Kick Return Fumbles Lost
0
0
Punt Return Fumbles Lost
0
10
Team Games Played
9
17-74
Punt: Total
10-104
Kicking
5
Field Goal Made
12
9
Field Goal Attempts
18
55.6
Field Goal Percentage
66.7
40
Long Field Goal Made
47
0
Field Goal Attempts 1-19
1
4
Field Goal Attempts 20-29
6
1
Field Goal Attempts 30-39
3
3
Field Goal Attempts 40-49
8
1
Field Goal Attempts 50+
0
26
Extra Points Made
29
30
Extra Point Attempts
29
86.7
Extra Point Percentage
100.0
0
Field Goals Made 1-19
1
3
Field Goals Made 20-29
6
1
Field Goals Made 30-39
2
1
Field Goals Made 40-49
3
0
Field Goals Made 50+
0
41
Total Kicking Points
65
10
Team Games Played
9
21
Touchback Percentage
64
0.0
Average Kickoff Return Yards
0.0
0
Kickoff Return Yards
0
0
Kickoff Returns
0
0-0
Kickoffs: Total
0-0
5-9
FG: Good-Attempts
12-18
Punting
45
Punts
39
1,633
Punt Yards
1,725
63
Long Punt
68
36.3
Gross Average Punt Yards
44.2
36.3
Net Average Punt Yards
44.2
0
Punts Blocked
0
9
Punts Inside 20
17
1
Touchbacks
8
14
Fair Catches
18
15
Punt Returns
7
0
Punt Return Yards
0
0.0
Average Punt Return Yards
0.0
10
Team Games Played
9
45-1,633
Punt: Total Yards
39-1,725
Scoring
14
Rushing Touchdowns
15
17
Receiving Touchdowns
11
0
Return Touchdowns
3
31
Total Touchdowns
29
5
Field Goals
12
26
Kick Extra Points
29
1
Total Two Point Conversions
1
235
Total Points
247
23.5
Total Points Per Game
27.4