

Houston vs Georgia Southern Live Score (26 Sep, 2026)
Score by Quarter
| Team | Q1 | Q2 | Q3 | Q4 | Final |
|---|---|---|---|---|---|
 Houston |
14 | 14 | 7 | 7 | 42 |
 Georgia Southern |
0 | 14 | 7 | 7 | 28 |
Scoring Plays
Q1
10:30
10:30
Conner Weigman 5 Yd Run (Jonathan Dimas Kick)
Rushing Touchdown
7 – 0
Q1
2:31
2:31
Koby Young 22 Yd pass from Conner Weigman (Jonathan Dimas Kick)
Passing Touchdown
14 – 0
Q2
13:32
13:32
Alex Taylor 40 Yd pass from Max Johnson (Tripp Bryant Kick)
Pass Reception
14 – 7
Q2
9:28
9:28
Ty Cummings 2 Yd Run (Tripp Bryant Kick)
Rushing Touchdown
14 – 14
Q2
5:48
5:48
Conner Weigman 1 Yd Run (Jonathan Dimas Kick)
Rushing Touchdown
21 – 14
Q2
0:52
0:52
Traville Frederick Jr. 2 Yd pass from Conner Weigman (Jonathan Dimas Kick)
Passing Touchdown
28 – 14
Q3
11:25
11:25
Trent Walker 23 Yd pass from Conner Weigman (Jonathan Dimas Kick)
Passing Touchdown
35 – 14
Q3
6:34
6:34
Alex Taylor 23 Yd pass from Max Johnson (Tripp Bryant Kick)
Passing Touchdown
35 – 21
Q4
14:10
14:10
Amare Thomas 11 Yd pass from Conner Weigman (Jonathan Dimas Kick)
Passing Touchdown
42 – 21
Q4
8:20
8:20
River Helms 5 Yd pass from Max Johnson (Tripp Bryant Kick)
Passing Touchdown
42 – 28
Game Leaders
HoustonGeorgia Southern
 C. Weigman QB
Passing Yards
 M. Johnson QB
 R. Sanford II RB
Rushing Yards
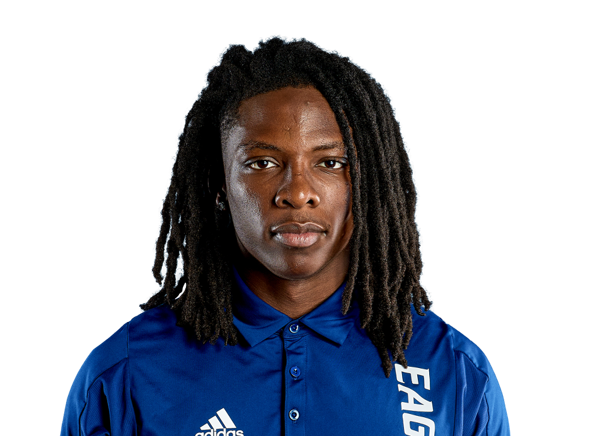 D. Mbadinga RB
 T. Walker WR
Receiving Yards
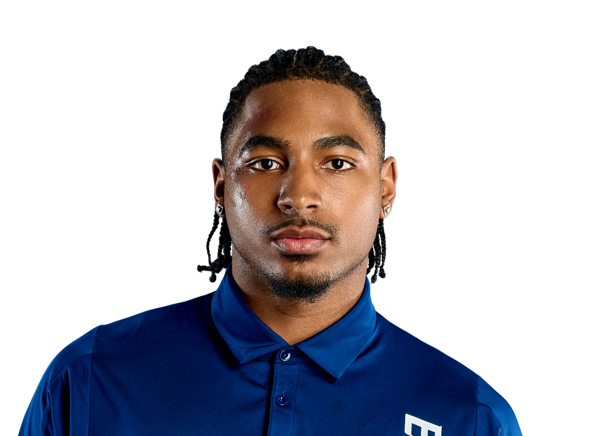 A. Taylor WR
 A. Porter DL
Sacks
—
 J. Yates LB
Tackles
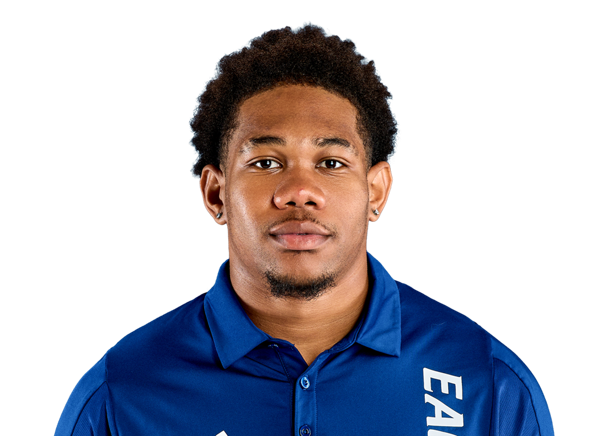 J. Jones DB
Player Box Score
Houston| Player | C/ATT | YDS | AVG | TD | INT | QBR |
|---|---|---|---|---|---|---|
| Conner Weigman#1 | 17/22 | 239 | 10.9 | 4 | 0 | 98.1 |
Georgia Southern| Player | C/ATT | YDS | AVG | TD | INT | QBR |
|---|---|---|---|---|---|---|
| Max Johnson#7 | 26/38 | 284 | 7.5 | 3 | 0 | 70.3 |
 Weston Bryan#9 | 1/1 | 5 | 5.0 | 0 | 0 | -- |
Houston| Player | CAR | YDS | AVG | TD | LONG |
|---|---|---|---|---|---|
| Re'Shaun Sanford II#6 | 17 | 120 | 7.1 | 0 | 17 |
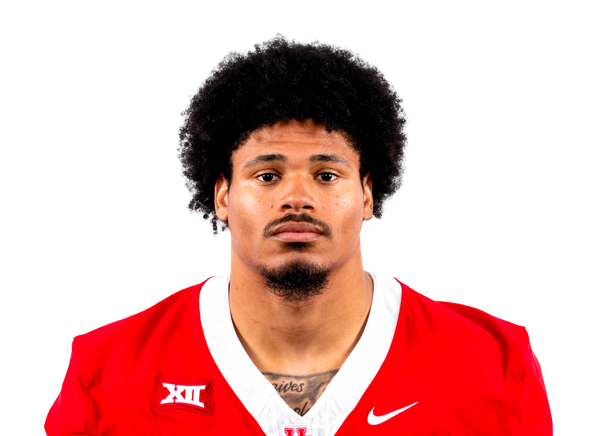 Makhi Hughes#21 | 16 | 70 | 4.4 | 0 | 15 |
| Conner Weigman#1 | 6 | 14 | 2.3 | 2 | 5 |
 Team | 2 | -2 | -1.0 | 0 | 0 |
Georgia Southern| Player | CAR | YDS | AVG | TD | LONG |
|---|---|---|---|---|---|
| David Mbadinga#6 | 6 | 37 | 6.2 | 0 | 19 |
| Weston Bryan#9 | 6 | 25 | 4.2 | 0 | 8 |
 Taylor Bradshaw#15 | 1 | 4 | 4.0 | 0 | 4 |
 Jamarian Samuel#16 | 4 | 4 | 1.0 | 0 | 4 |
 Ty Cummings#20 | 1 | 2 | 2.0 | 1 | 2 |
 Taeo Todd#35 | 1 | 2 | 2.0 | 0 | 2 |
| Max Johnson#7 | 7 | -8 | -1.1 | 0 | 8 |
Houston| Player | REC | YDS | AVG | TD | LONG |
|---|---|---|---|---|---|
| Trent Walker#4 | 6 | 83 | 13.8 | 1 | 23 |
 Patrick Overmyer#9 | 3 | 68 | 22.7 | 0 | 47 |
 Amare Thomas | 5 | 50 | 10.0 | 1 | 17 |
 Koby Young#2 | 1 | 22 | 22.0 | 1 | 22 |
| Makhi Hughes#21 | 1 | 14 | 14.0 | 0 | 14 |
 Traville Frederick Jr.#85 | 1 | 2 | 2.0 | 1 | 2 |
Georgia Southern| Player | REC | YDS | AVG | TD | LONG |
|---|---|---|---|---|---|
| Alex Taylor#88 | 6 | 119 | 19.8 | 2 | 40 |
| Taeo Todd#35 | 2 | 46 | 23.0 | 0 | 25 |
 Josh Dallas#19 | 7 | 45 | 6.4 | 0 | 13 |
 Jeremiah Ware#81 | 3 | 27 | 9.0 | 0 | 13 |
 River Helms#87 | 5 | 25 | 5.0 | 1 | 11 |
| Taylor Bradshaw#15 | 1 | 12 | 12.0 | 0 | 12 |
 Andre Greene Jr.#18 | 2 | 10 | 5.0 | 0 | 6 |
 King Phillips#13 | 1 | 5 | 5.0 | 0 | 5 |
Houston| Player | TOT | SOLO | SACKS | TFL | PD | QB HUR | TD |
|---|---|---|---|---|---|---|---|
| Jaden Yates#1 | 9 | 7 | 0.5 | 1.5 | 0 | 0 | 0 |
 Kentrell Webb#8 | 8 | 7 | 0 | 0 | 1 | 0 | 0 |
 Will James#5 | 6 | 6 | 0 | 0 | 2 | 0 | 0 |
 Khalil Laufau#18 | 5 | 4 | 0 | 0 | 1 | 1 | 0 |
 Javion White | 5 | 3 | 0.5 | 2.5 | 1 | 0 | 0 |
 Jalen Mayo#2 | 3 | 3 | 0 | 0 | 1 | 0 | 0 |
| Ashton Porter#9 | 3 | 1 | 1 | 1 | 0 | 1 | 0 |
 Sione Fotu#12 | 2 | 2 | 0 | 0 | 0 | 0 | 0 |
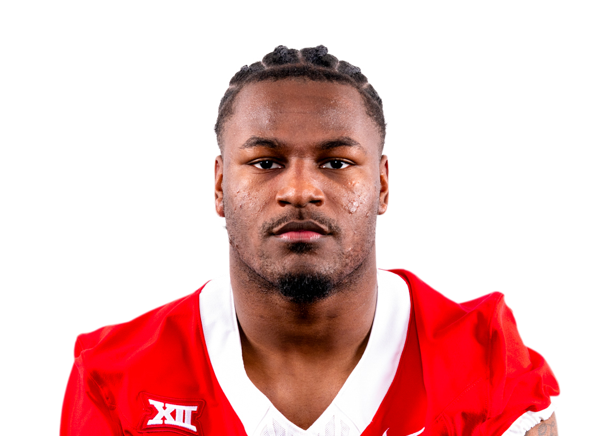 Jordan Allen#6 | 2 | 2 | 0 | 0 | 1 | 0 | 0 |
 JD Rhym#3 | 2 | 1 | 0 | 0 | 0 | 0 | 0 |
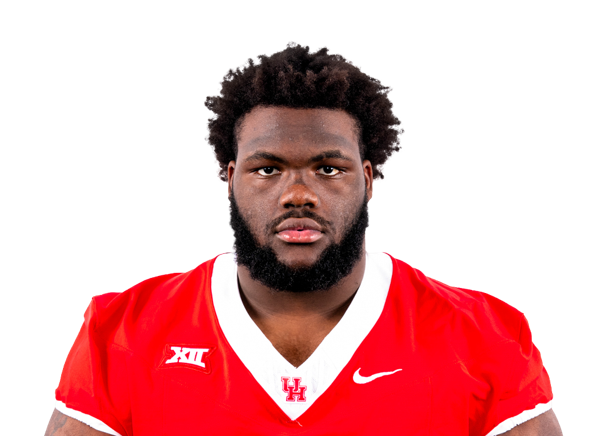 De'Marion Thomas#90 | 2 | 1 | 0 | 0 | 0 | 0 | 0 |
 Brandon Mack II#4 | 1 | 1 | 0 | 0 | 0 | 1 | 0 |
 Carmycah Glass#25 | 1 | 1 | 0 | 0 | 0 | 0 | 0 |
 Latreveon McCutchin#10 | 1 | 1 | 0 | 0 | 0 | 0 | 0 |
 Zaylen Cormier#22 | 1 | 1 | 0 | 0 | 0 | 0 | 0 |
 DK Mays#47 | 1 | 1 | 0 | 0 | 0 | 0 | 0 |
Georgia Southern| Player | TOT | SOLO | SACKS | TFL | PD | QB HUR | TD |
|---|---|---|---|---|---|---|---|
| Jakyri Jones#6 | 9 | 4 | 0 | 0 | 0 | 0 | 0 |
 Anthony Bynum#4 | 8 | 3 | 0 | 0 | 0 | 0 | 0 |
 Chace Calicut#22 | 6 | 1 | 0 | 0 | 0 | 0 | 0 |
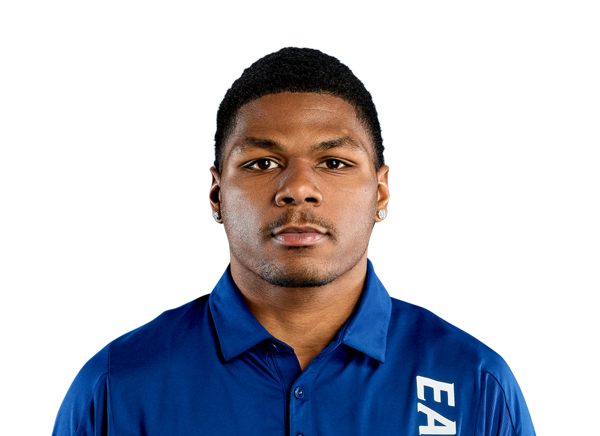 Aaron Sears#2 | 4 | 3 | 0 | 0 | 0 | 0 | 0 |
 Brandon Tyson#1 | 4 | 2 | 0 | 0 | 0 | 0 | 0 |
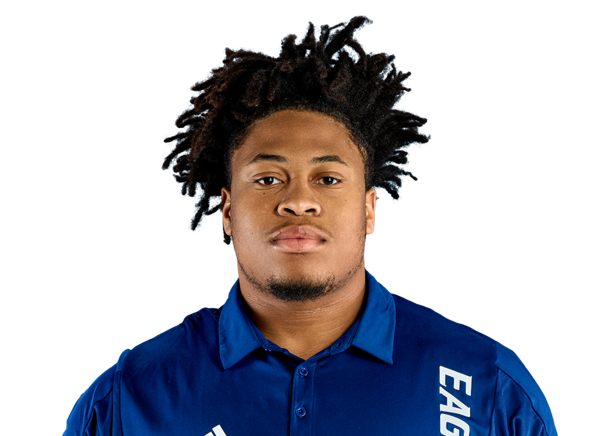 O'Marion Brown#90 | 4 | 2 | 0 | 0 | 0 | 0 | 0 |
 Elijah Fears#94 | 4 | 2 | 0 | 0 | 0 | 0 | 0 |
 Carlo Thompson#21 | 3 | 3 | 0 | 0 | 0 | 0 | 0 |
 Jacob Hammonds#10 | 3 | 2 | 0 | 0 | 0 | 0 | 0 |
 Rashon Myles Jr.#14 | 2 | 2 | 0 | 0 | 0 | 0 | 0 |
 Tracy Hill Jr.#12 | 2 | 2 | 0 | 0 | 0 | 0 | 0 |
 MJ Stroud#18 | 2 | 1 | 0 | 0 | 0 | 0 | 0 |
 Chance Gamble#31 | 2 | 1 | 0 | 0 | 0 | 0 | 0 |
 Festus Davies#9 | 2 | 1 | 0 | 0 | 0 | 0 | 0 |
 Noah Mangham#38 | 1 | 1 | 0 | 0 | 2 | 0 | 0 |
| Taylor Bradshaw#15 | 1 | 1 | 0 | 0 | 0 | 0 | 0 |
 Jeremiah Ticket#99 | 1 | 1 | 0 | 0 | 0 | 0 | 0 |
 Ethan Johnson#43 | 1 | 1 | 0 | 0 | 0 | 0 | 0 |
 Jayden Jackson#17 | 1 | 1 | 0 | 0 | 0 | 0 | 0 |
 Latrell Bullard#57 | 1 | 0 | 0 | 0 | 0 | 0 | 0 |
 JaMari Whitehead#34 | 1 | 0 | 0 | 0 | 0 | 0 | 0 |
 Uche Iloh#98 | 1 | 0 | 0 | 0 | 0 | 0 | 0 |
 Diego Aviles#5 | 1 | 0 | 0 | 0 | 0 | 0 | 0 |
Houston| Player | FUM | LOST | REC |
|---|---|---|---|
| Trent Walker#4 | 1 | 0 | 0 |
| De'Marion Thomas#90 | 0 | 0 | 1 |
Georgia Southern| Player | FUM | LOST | REC |
|---|---|---|---|
| Max Johnson#7 | 1 | 1 | 0 |
Houston| Player | FG | PCT | LONG | XP | PTS |
|---|---|---|---|---|---|
 Jonathan Dimas#49 | 0/0 | 0.0 | 0 | 6/6 | 6 |
Georgia Southern| Player | FG | PCT | LONG | XP | PTS |
|---|---|---|---|---|---|
 Tripp Bryant#95 | 0/0 | 0.0 | 0 | 4/4 | 4 |
Houston| Player | NO | YDS | AVG | TB | In 20 | LONG |
|---|---|---|---|---|---|---|
 Liam Dougherty#91 | 1 | 48 | 48.0 | 1 | 0 | 48 |
Georgia Southern| Player | NO | YDS | AVG | TB | In 20 | LONG |
|---|---|---|---|---|---|---|
 Alex Smith#25 | 2 | 82 | 41.0 | 0 | 0 | 42 |
Houston| Player | NO | YDS | AVG | LONG | TD |
|---|---|---|---|---|---|
 John Hebert#23 | 3 | 79 | 26.3 | 38 | 0 |
Georgia Southern| Player | NO | YDS | AVG | LONG | TD |
|---|---|---|---|---|---|
| Jeremiah Ware#81 | 3 | 33 | 11.0 | 19 | 0 |
Houston| Player | NO | YDS | AVG | LONG | TD |
|---|---|---|---|---|---|
| Trent Walker#4 | 1 | -2 | -2.0 | 0 | 0 |
Drive Summary
GASO
Fumble
26
HOU
Touchdown
37
GASO
Punt
2
HOU
Touchdown
67
GASO
Touchdown
75
GASO
Touchdown
54
HOU
Touchdown
75
GASO
Punt
6
HOU
Touchdown
75
GASO
End Of Half
-7
HOU
Touchdown
73
GASO
Touchdown
76
HOU
Touchdown
86
GASO
Touchdown
75
HOU
Punt
4
GASO
Downs
26
HOU
End of Half
21
Injury Report
No current injury report is available for this matchup.
Head-to-Head
Historical meetings are not available for this matchup.
Game Information
StageWeek 4
Season2026
KickoffSat, Sep 26, 4:00 pm
VenueAllen E. Paulson Stadium
LocationStatesboro, GA
SurfaceArtificial Turf
BroadcastESPNU
Attendance24,112
Division Standings
FBS — Big 12 Conference
| Team | W | L | T | Pct | PF | PA | Home | Away | Strk |
|---|---|---|---|---|---|---|---|---|---|
 Cincinnati | 5 | 5 | 0 | 0.500 | 310 | 306 | 5-1 | 0-4 | L3 |
 Texas Tech | 8 | 1 | 0 | 0.889 | 338 | 217 | 6-0 | 2-1 | W2 |
 Utah | 9 | 0 | 0 | 1.000 | 339 | 147 | 6-0 | 3-0 | W9 |
 BYU | 8 | 2 | 0 | 0.800 | 307 | 185 | 6-0 | 2-2 | W1 |
 Baylor | 6 | 4 | 0 | 0.600 | 294 | 181 | 4-1 | 2-3 | L1 |
 Oklahoma State | 6 | 3 | 0 | 0.667 | 395 | 245 | 4-0 | 2-3 | W1 |
 UCF | 5 | 5 | 0 | 0.500 | 284 | 260 | 4-2 | 1-3 | L1 |
 Arizona State | 6 | 4 | 0 | 0.600 | 282 | 259 | 4-1 | 2-3 | W2 |
 Arizona | 7 | 2 | 0 | 0.778 | 308 | 179 | 5-0 | 2-2 | W1 |
| Houston | 7 | 3 | 0 | 0.700 | 351 | 234 | 5-0 | 2-3 | L1 |
 Kansas State | 4 | 6 | 0 | 0.400 | 292 | 261 | 4-2 | 0-4 | L4 |
 West Virginia | 5 | 5 | 0 | 0.500 | 349 | 348 | 3-3 | 2-2 | L2 |
 Colorado | 4 | 6 | 0 | 0.400 | 220 | 287 | 3-2 | 1-4 | W1 |
 Iowa State | 5 | 5 | 0 | 0.500 | 304 | 273 | 5-1 | 0-4 | W1 |
 TCU | 5 | 5 | 0 | 0.500 | 234 | 152 | 4-3 | 1-2 | W1 |
 Kansas | 4 | 6 | 0 | 0.400 | 302 | 237 | 3-3 | 1-3 | W1 |
Houston
4th in Big 12
VS
Georgia Southern
2nd in Sun Belt
Quarterbacks & Specialists
#91
Liam Dougherty
#1
Conner Weigman
Receivers & Backs
#85
Traville Frederick Jr.
#23
John Hebert
#21
Makhi Hughes
#9
Patrick Overmyer
#6
Re'Shaun Sanford II
Amare Thomas
#4
Trent Walker
#2
Koby Young
Defensive Line & Linebackers
#12
Sione Fotu
#25
Carmycah Glass
#18
Khalil Laufau
#4
Brandon Mack II
#47
DK Mays
#10
Latreveon McCutchin
#9
Ashton Porter
#90
De'Marion Thomas
#1
Jaden Yates
Defensive Backs
#6
Jordan Allen
#22
Zaylen Cormier
#5
Will James
#2
Jalen Mayo
#3
JD Rhym
#8
Kentrell Webb
Javion White
Other
#49
Jonathan Dimas
Quarterbacks & Specialists
#9
Weston Bryan
#7
Max Johnson
#25
Alex Smith
Receivers & Backs
#15
Taylor Bradshaw
#20
Ty Cummings
#19
Josh Dallas
#18
Andre Greene Jr.
#87
River Helms
#6
David Mbadinga
#13
King Phillips
#16
Jamarian Samuel
#88
Alex Taylor
#35
Taeo Todd
#81
Jeremiah Ware
Defensive Line & Linebackers
#5
Diego Aviles
#90
O'Marion Brown
#57
Latrell Bullard
#4
Anthony Bynum
#9
Festus Davies
#94
Elijah Fears
#10
Jacob Hammonds
#98
Uche Iloh
#43
Ethan Johnson
#14
Rashon Myles Jr.
#18
MJ Stroud
#99
Jeremiah Ticket
#1
Brandon Tyson
#34
JaMari Whitehead
Defensive Backs
#22
Chace Calicut
#31
Chance Gamble
#12
Tracy Hill Jr.
#17
Jayden Jackson
#6
Jakyri Jones
#38
Noah Mangham
#2
Aaron Sears
#21
Carlo Thompson
Other
#95
Tripp Bryant
Houston
4th in Big 12
VS
Georgia Southern
1st in Sun Belt - East
Passing
65.8
Completion Percentage
68.9
202
Completions
261
1.00
Interception Percentage
1.10
3
Interceptions
4
56
Longest Pass
70
2,635
Net Passing Yards
2,789
263.5
Net Passing Yards Per Game
278.9
307
Passing Attempts
379
8.80
Passing Touchdown %
4.70
27
Passing Touchdowns
18
165.1
Passer Rating
144.5
11
Total Sacks
10
63
Sack Yards Lost
84
8.6
Yards Per Pass Attempt
7.4
2,635
Passing Yards
2,789
0
Passing Fumbles Lost
0
10
Team Games Played
10
470.9
Yards Per Game
411.0
35.1
Total Points Per Game
27.3
351
Total Points
273
46
Total Touchdowns
33
263.5
Passing Yards Per Game
278.9
202-307
Comp-Att
261-379
11-63
Sacks-Yards Lost
10-84
Rushing
391
Rushing Attempts
300
2,074
Rushing Yards
1,321
5.3
Yards Per Rush Attempt
4.4
56
Long Rushing
67
0
20+ Yard Rushing Plays
0
19
Rushing Touchdowns
14
207.4
Rushing Yards Per Game
132.1
0
Rushing Fumbles
0
0
Rushing Fumbles Lost
0
114
Rushing 1st downs
68
10
Team Games Played
10
4,709
Total Yards
4,110
709
Total Offensive Plays
689
35.1
Total Points Per Game
27.3
351
Total Points
273
46
Total Touchdowns
33
Receiving
202
Receptions
261
0
Receiving Targets
0
2,635
Receiving Yards
2,789
2,635
Receiving Yards
2,789
27
Receiving Touchdowns
18
56
Long Reception
70
0
20+ Yard Receiving Plays
0
263.5
Receiving Yards Per Game
278.9
0
Receiving Fumbles
0
0
Receiving Fumbles Lost
0
1277
Receiving Yards After Catch
1574
124
Receiving First Downs
129
10
Team Games Played
10
13.0
Yards Per Reception
10.7
35.1
Total Points Per Game
27.3
351
Total Points
273
46
Total Touchdowns
33
Miscellaneous
256
Total 1st downs
219
114
Rushing 1st downs
68
124
Passing 1st downs
129
18
1st downs by penalty
22
76
Third Down Conversions
58
129
Third Down Attempts
138
58.91
3rd down %
42.03
11
Fourth Down Conversions
10
17
First Downs Attempts
15
64.71
4th down %
66.67
65
Total Penalties
79
544
Total Penalty Yards
735
19029
Possession Time Seconds
19278
0.00
Red Zone Field Goal Percentage
0.00
0.00
Red Zone Scoring Percentage
0.00
0.00
Red Zone Efficiency Percentage
0.00
0.00
Red Zone Touchdown Percentage
0.00
9
Total Takeaways
14
8
Total Giveaways
10
1
Turnover Ratio
4
0
Fumbles Lost
0
76-129
3rd down efficiency
58-138
11-17
4th down efficiency
10-15
65-544
Total-Yards
79-735
Defense
355
Solo Tackles
315
196
Assist Tackles
274
551
Total Tackles
589
15
Sacks
27
111
Sack Yards
168
68
Stuffs
89
50
Passes Defended
34
2.7
Average Interception Yards
9.5
17
Long Interception
33
0
Miscellaneous Touchdowns
0
1
Kicks Blocked
1
40
Tackles For Loss
54
10
Team Games Played
10
Defensive Interceptions
9
Interceptions
6
24
Interception Yards
57
0
Interception Touchdowns
1
9-24
INT: Total
6-57
General
10
Fumbles
11
5
Forced Fumbles
10
6
Fumbles Recovered
10
0
Fumbles Touchdowns
0
10
Games Played
10
10-0
Fumbles-Lost
11-0
Returning
16
Kick Returns
15
353
Kick Return Yards
269
22.1
Yards Per Kick Return
17.9
38
Long Kick Return
39
0
Kick Return Touchdowns
0
8
Punt Returns
21
80
Punt Return Yards
150
10.0
Yards Per Punt Return
7.1
33
Long Punt Return
42
0
Punt Return Touchdowns
0
0
Punt Return Fair Catches
0
0
Kick Return Fumbles Lost
0
0
Punt Return Fumbles Lost
0
10
Team Games Played
10
8-80
Punt: Total
21-150
Kicking
11
Field Goal Made
14
12
Field Goal Attempts
20
91.7
Field Goal Percentage
70.0
52
Long Field Goal Made
48
0
Field Goal Attempts 1-19
0
4
Field Goal Attempts 20-29
3
3
Field Goal Attempts 30-39
6
4
Field Goal Attempts 40-49
7
1
Field Goal Attempts 50+
4
42
Extra Points Made
33
43
Extra Point Attempts
33
97.7
Extra Point Percentage
100.0
0
Field Goals Made 1-19
0
4
Field Goals Made 20-29
3
2
Field Goals Made 30-39
5
4
Field Goals Made 40-49
6
1
Field Goals Made 50+
0
75
Total Kicking Points
75
10
Team Games Played
10
65
Touchback Percentage
65
0.0
Average Kickoff Return Yards
0.0
0
Kickoff Return Yards
0
0
Kickoff Returns
0
0-0
Kickoffs: Total
0-0
11-12
FG: Good-Attempts
14-20
Punting
23
Punts
40
1,074
Punt Yards
1,693
74
Long Punt
50
46.7
Gross Average Punt Yards
42.3
46.7
Net Average Punt Yards
42.3
0
Punts Blocked
0
12
Punts Inside 20
13
2
Touchbacks
3
3
Fair Catches
18
9
Punt Returns
8
0
Punt Return Yards
0
0.0
Average Punt Return Yards
0.0
10
Team Games Played
10
23-1,074
Punt: Total Yards
40-1,693
Scoring
19
Rushing Touchdowns
14
27
Receiving Touchdowns
18
0
Return Touchdowns
0
46
Total Touchdowns
32
11
Field Goals
14
42
Kick Extra Points
33
0
Total Two Point Conversions
0
351
Total Points
273
35.1
Total Points Per Game
27.3