

Howard vs Rutgers Live Score (25 Sep, 2026)
Score by Quarter
| Team | Q1 | Q2 | Q3 | Q4 | Final |
|---|---|---|---|---|---|
 Howard | 7 | 0 | 0 | 0 | 7 |
 Rutgers | 21 | 20 | 10 | 7 | 58 |
Scoring Plays
Q1
12:22
12:22
Ben Black III 16 Yd pass from Dylan Lonergan (Dane Pizzaro Kick)
Passing Touchdown
0 – 7
Q1
10:00
10:00
KJ Duff 77 Yd pass from Dylan Lonergan (Dane Pizzaro Kick)
Passing Touchdown
0 – 14
Q1
4:28
4:28
Antwan Raymond 18 Yd Run (Dane Pizzaro Kick)
Rushing Touchdown
0 – 21
Q1
4:15
4:15
Eden James 75 Yd Run (Matt Conord Kick)
Rushing Touchdown
7 – 21
Q2
14:15
14:15
Antwan Raymond 1 Yd Run (Dane Pizzaro Kick)
Rushing Touchdown
7 – 28
Q2
9:00
9:00
Dane Pizzaro 29 Yd Field Goal
Field Goal Good
7 – 31
Q2
5:37
5:37
Antwan Raymond 13 Yd Run (Dane Pizzaro Kick)
Rushing Touchdown
7 – 38
Q2
0:25
0:25
Dane Pizzaro 47 Yd Field Goal
Field Goal Good
7 – 41
Q3
8:03
8:03
Clay Thevenin 4 Yd Run (Dane Pizzaro Kick)
Rushing Touchdown
7 – 48
Q3
1:58
1:58
Dane Pizzaro 40 Yd Field Goal
Field Goal Good
7 – 51
Q4
12:55
12:55
Vernon Allen III 9 Yd pass from AJ Surace (Dane Pizzaro Kick)
Passing Touchdown
7 – 58
Game Leaders
HowardRutgers
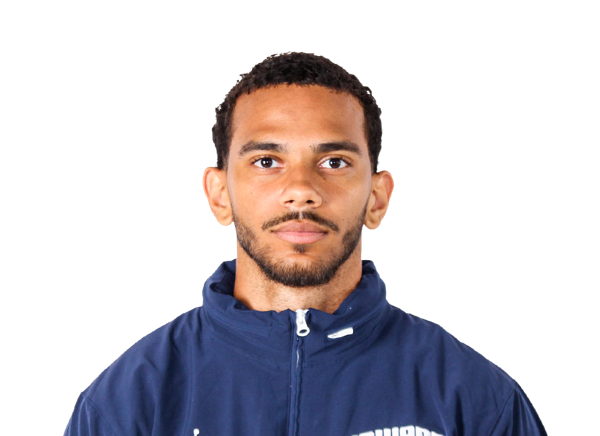 J. Scroggins QB
Passing Yards
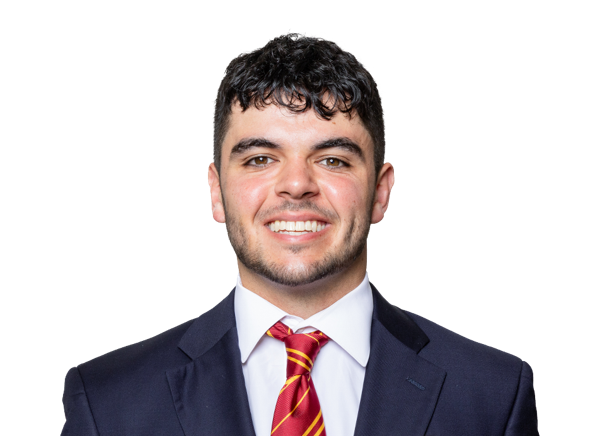 D. Lonergan QB
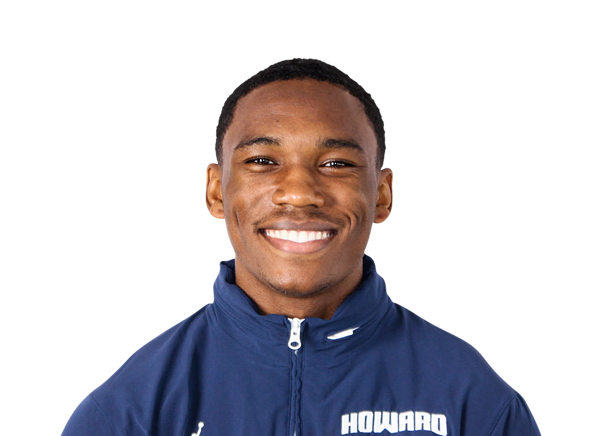 E. James RB
Rushing Yards
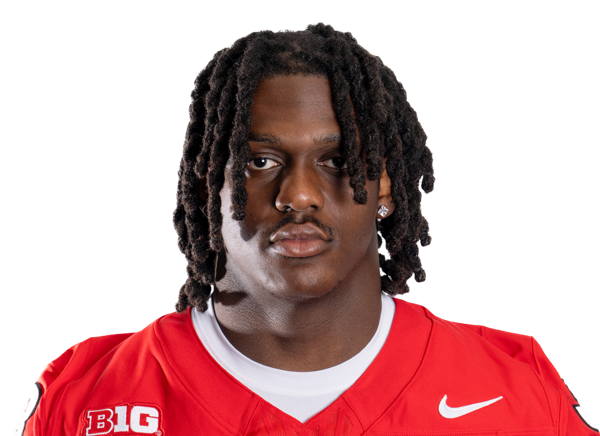 A. Raymond RB
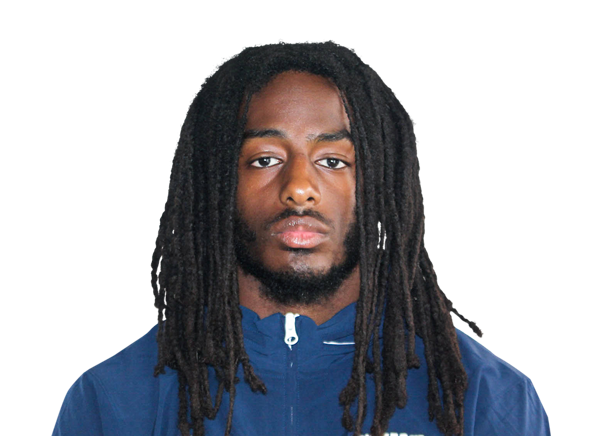 Z. Jackson WR
Receiving Yards
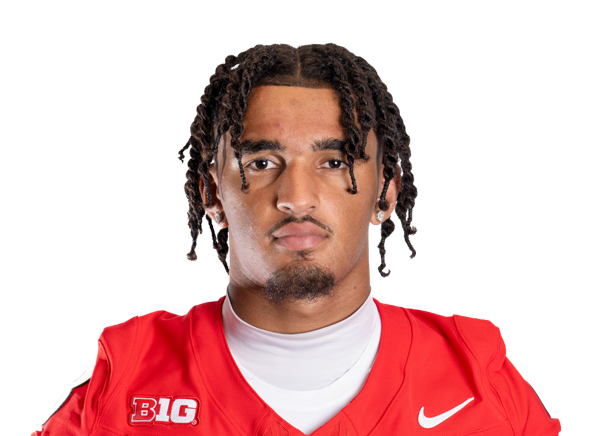 K. Duff WR
 M. Grandy DB
Tackles
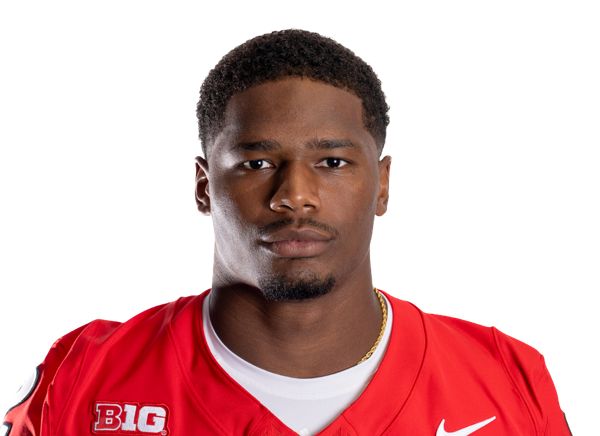 M. Walker LB
—
Sacks
 K. Griffin DL
Player Box Score
Howard| Player | C/ATT | YDS | AVG | TD | INT | QBR |
|---|---|---|---|---|---|---|
| Ja'Shawn Scroggins#6 | 5/14 | 38 | 2.7 | 0 | 2 | -- |
 Isaiah Freeman#1 | 3/5 | 13 | 2.6 | 0 | 0 | -- |
Rutgers| Player | C/ATT | YDS | AVG | TD | INT | QBR |
|---|---|---|---|---|---|---|
| Dylan Lonergan#12 | 12/17 | 214 | 12.6 | 2 | 0 | 94.1 |
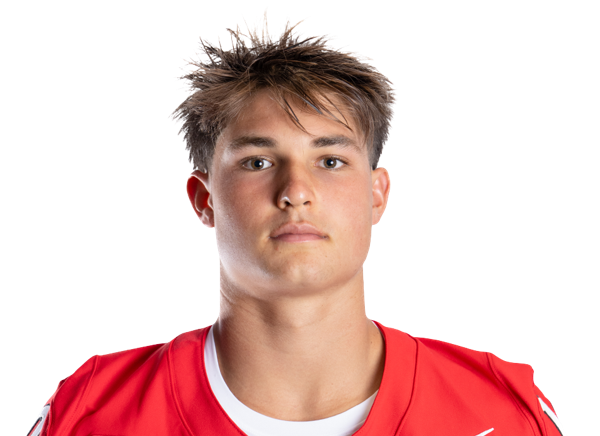 AJ Surace#10 | 3/7 | 40 | 5.7 | 1 | 0 | 14.7 |
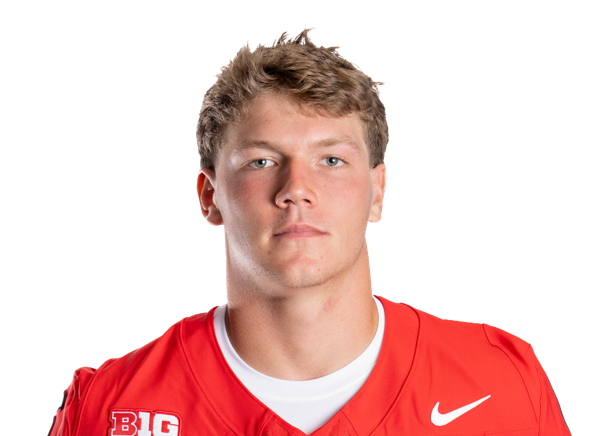 Sean Ashenfelder#6 | 1/1 | 14 | 14.0 | 0 | 0 | -- |
Howard| Player | CAR | YDS | AVG | TD | LONG |
|---|---|---|---|---|---|
| Eden James#5 | 7 | 116 | 16.6 | 1 | 75 |
| Ja'Shawn Scroggins#6 | 7 | 18 | 2.6 | 0 | 14 |
 Travis Kerney#4 | 8 | 17 | 2.1 | 0 | 6 |
 Billy Roberson II#24 | 4 | 11 | 2.8 | 0 | 4 |
| Isaiah Freeman#1 | 2 | -7 | -3.5 | 0 | 0 |
| Team | 1 | -22 | -22.0 | 0 | 0 |
Rutgers| Player | CAR | YDS | AVG | TD | LONG |
|---|---|---|---|---|---|
| Antwan Raymond#3 | 16 | 140 | 8.8 | 3 | 51 |
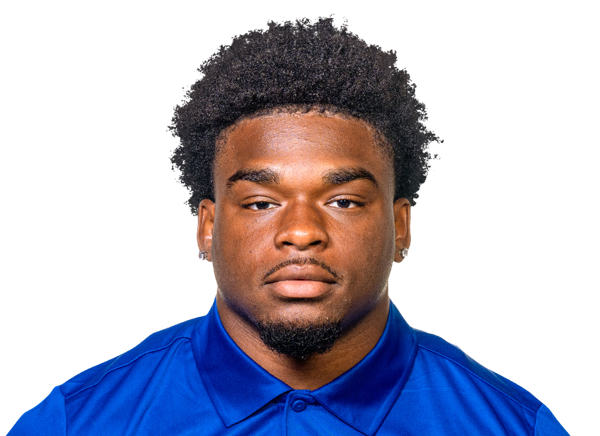 Clay Thevenin#9 | 16 | 69 | 4.3 | 1 | 10 |
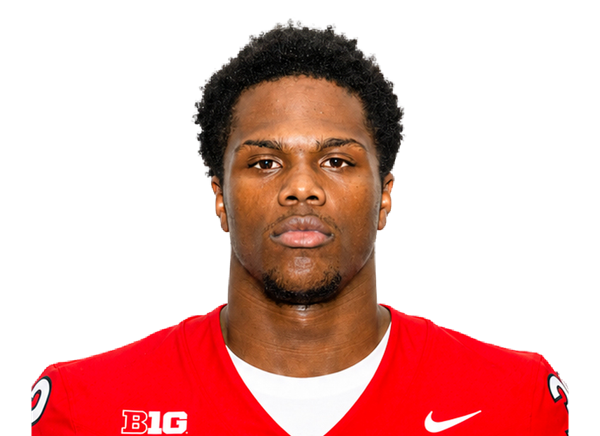 Aiden Gibson#32 | 9 | 37 | 4.1 | 0 | 9 |
| Dylan Lonergan#12 | 2 | 13 | 6.5 | 0 | 10 |
 Ja'shon Benjamin#20 | 3 | 12 | 4.0 | 0 | 6 |
| Team | 1 | -5 | -5.0 | 0 | 0 |
Howard| Player | REC | YDS | AVG | TD | LONG |
|---|---|---|---|---|---|
| Zaden Jackson#15 | 4 | 33 | 8.3 | 0 | 10 |
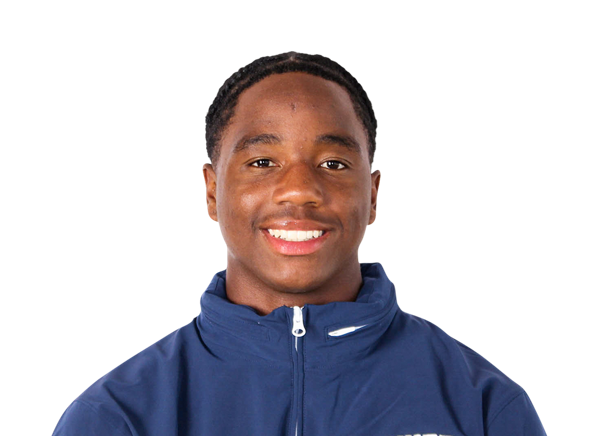 Antonio Hunter#3 | 1 | 18 | 18.0 | 0 | 18 |
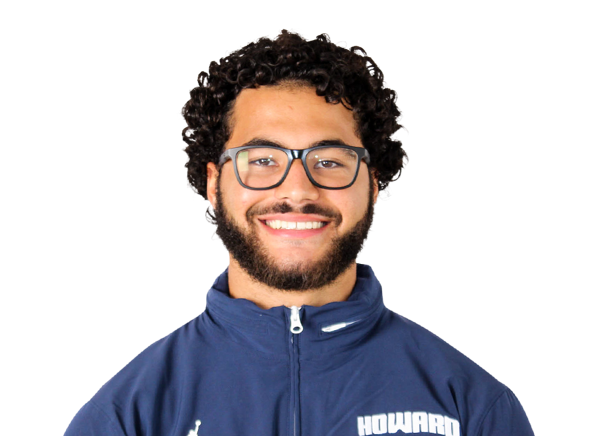 Nathanial Clark#86 | 2 | 0 | 0.0 | 0 | 6 |
| Billy Roberson II#24 | 1 | 0 | 0.0 | 0 | 0 |
Rutgers| Player | REC | YDS | AVG | TD | LONG |
|---|---|---|---|---|---|
| KJ Duff#8 | 5 | 131 | 26.2 | 1 | 77 |
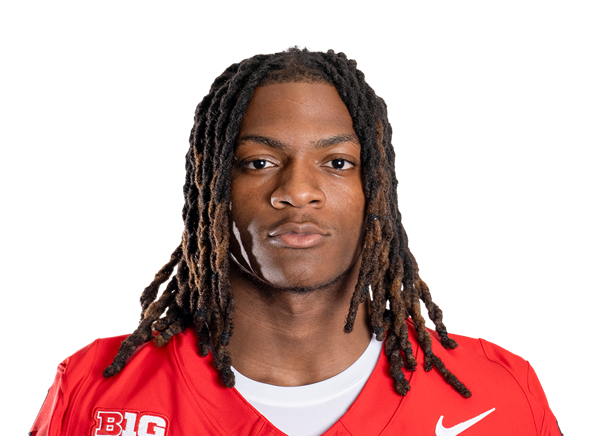 Jourdin Houston#4 | 3 | 50 | 16.7 | 0 | 26 |
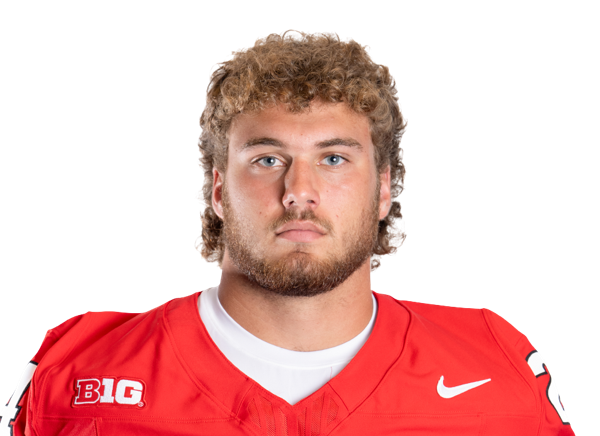 Ben Rothhaar#24 | 1 | 23 | 23.0 | 0 | 23 |
 Kam Anthony#85 | 2 | 22 | 11.0 | 0 | 14 |
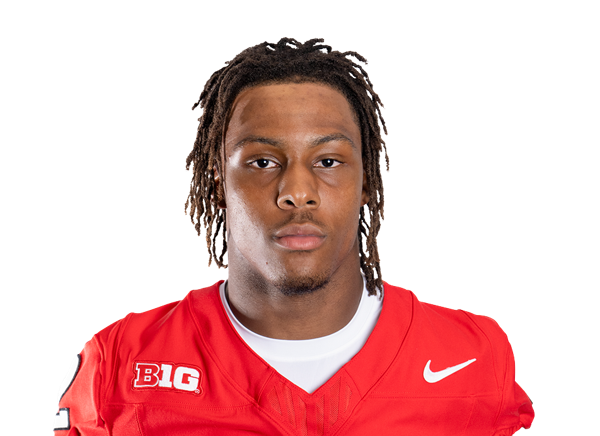 Ben Black III#2 | 2 | 17 | 8.5 | 1 | 16 |
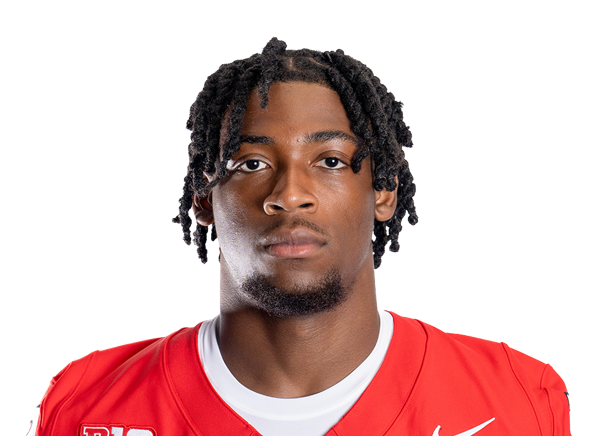 Vernon Allen III#5 | 1 | 9 | 9.0 | 1 | 9 |
| Dyzier Carter | 1 | 9 | 9.0 | 0 | 9 |
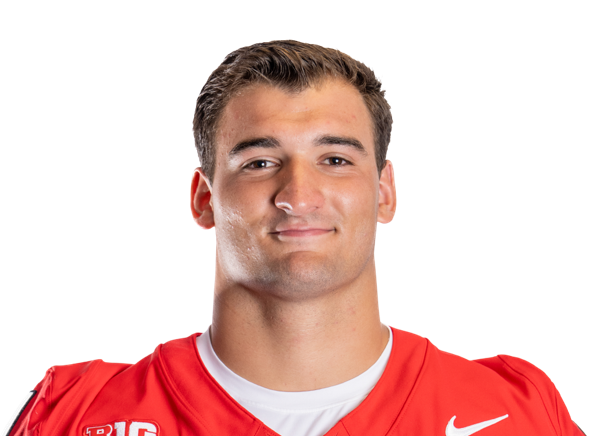 Logan Blake#11 | 1 | 7 | 7.0 | 0 | 7 |
Howard| Player | TOT | SOLO | SACKS | TFL | PD | QB HUR | TD |
|---|---|---|---|---|---|---|---|
| Michael Grandy#3 | 8 | 5 | 0 | 0 | 0 | 0 | 0 |
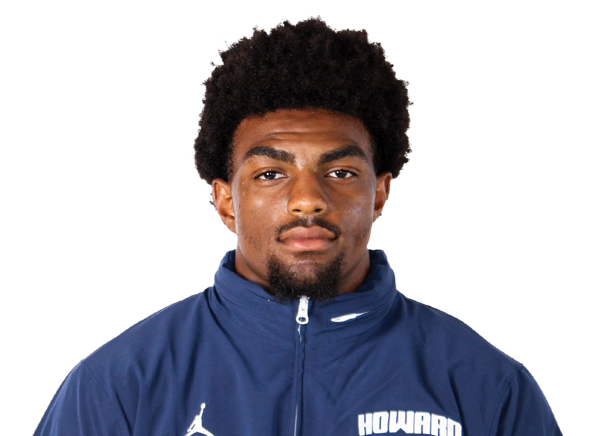 Glen Vinson III#26 | 8 | 3 | 0 | 0 | 0 | 0 | 0 |
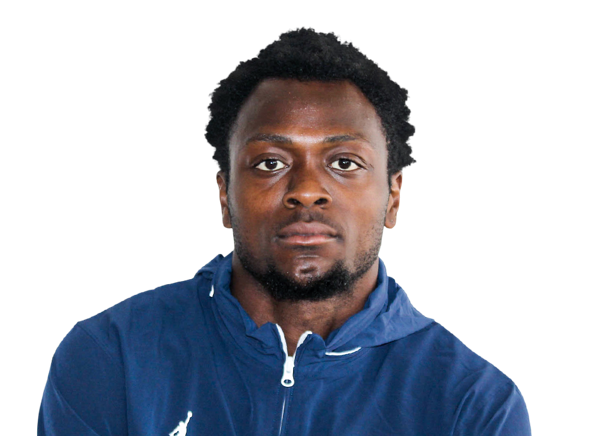 Kaleb Gallop#8 | 6 | 3 | 0 | 0.5 | 0 | 0 | 0 |
 Aidan Foster#36 | 6 | 2 | 0 | 0 | 0 | 0 | 0 |
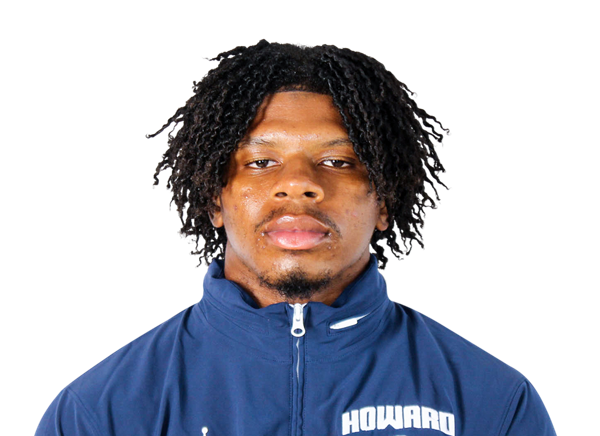 Ben Chandler IV#6 | 5 | 2 | 0 | 0 | 0 | 0 | 0 |
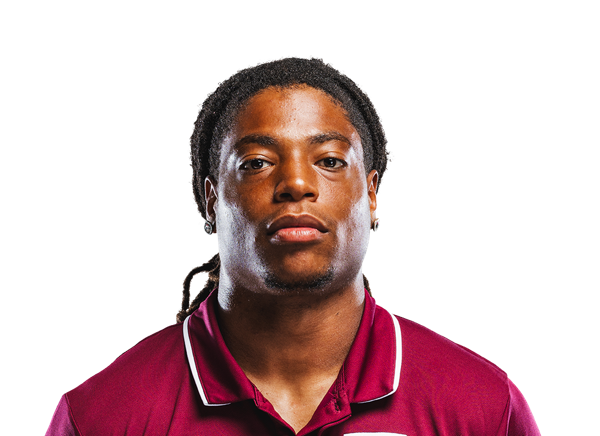 Gabe Stephens#7 | 5 | 1 | 0 | 1 | 0 | 0 | 0 |
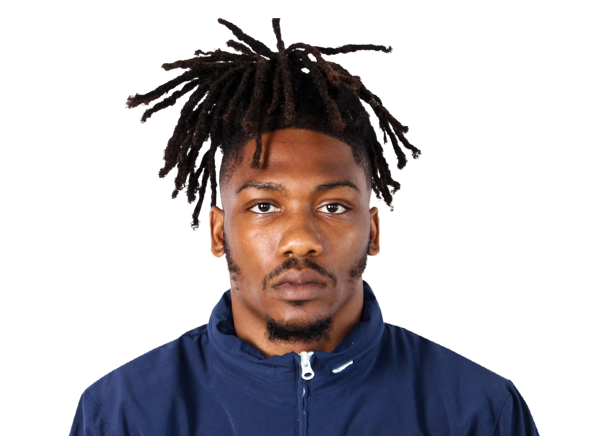 Kedrick Green#11 | 4 | 2 | 0 | 0 | 0 | 0 | 0 |
 Masiah Thorne#1 | 4 | 1 | 0 | 0 | 0 | 0 | 0 |
 Jason Seraphin#9 | 4 | 0 | 0 | 0 | 0 | 0 | 0 |
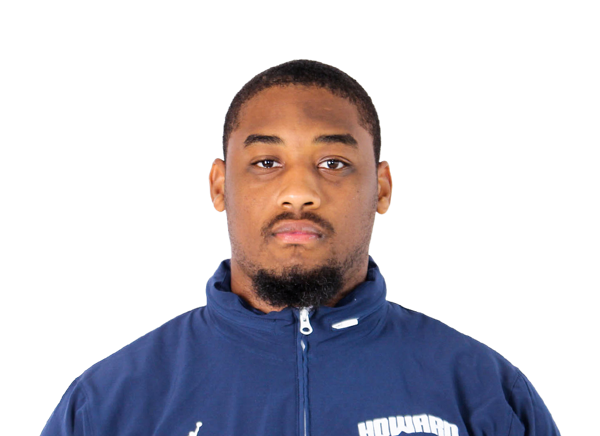 Reggie Reed Jr.#15 | 3 | 1 | 0 | 0 | 0 | 0 | 0 |
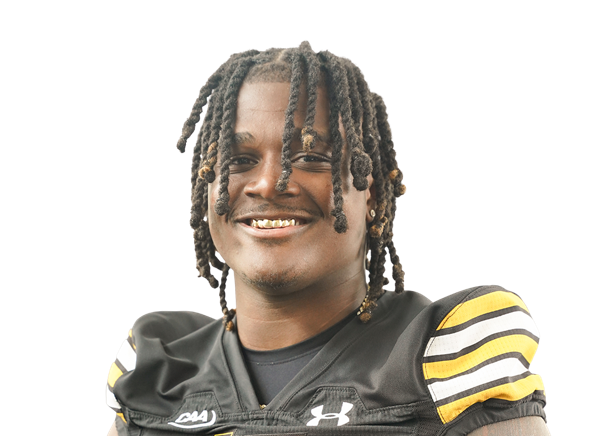 Rodney Roane#4 | 3 | 1 | 0 | 0 | 0 | 0 | 0 |
 CJ Dale Jr.#12 | 2 | 1 | 0 | 0 | 1 | 0 | 0 |
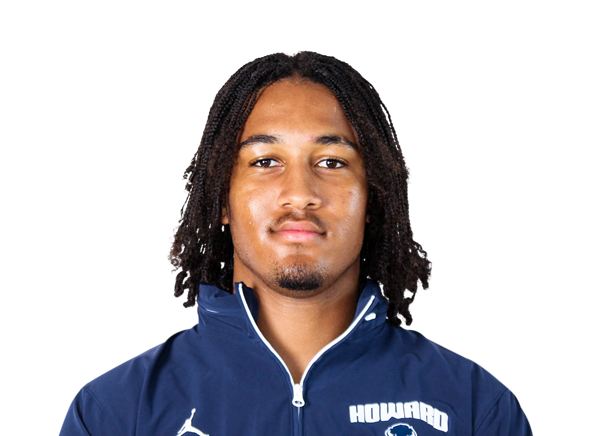 Phoenix-Orion DiCosmo#91 | 2 | 1 | 0 | 0 | 0 | 0 | 0 |
| Jaylen Daniels#56 | 2 | 1 | 0 | 0 | 0 | 0 | 0 |
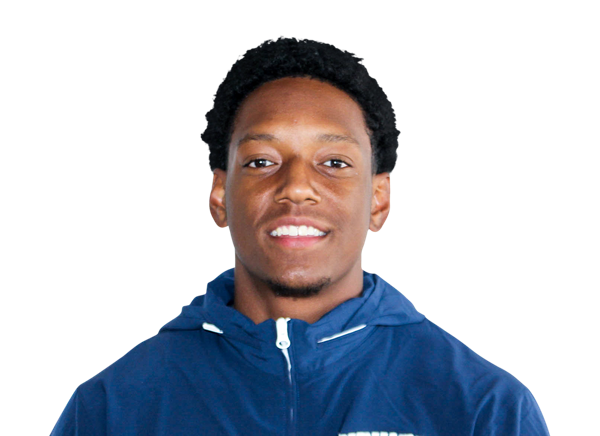 J. Augustus Olidge#32 | 2 | 0 | 0 | 0 | 0 | 0 | 0 |
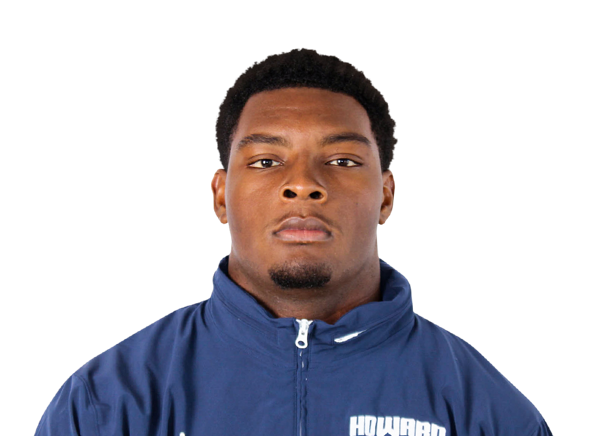 Israel Lucas#95 | 2 | 0 | 0 | 0.5 | 0 | 0 | 0 |
 Cameron Demma#37 | 2 | 0 | 0 | 0 | 0 | 0 | 0 |
 Faisal Mass#10 | 1 | 1 | 0 | 0 | 0 | 0 | 0 |
 AJ Smith-Jones#17 | 1 | 1 | 0 | 0 | 0 | 0 | 0 |
 Dre Miller-Ross#21 | 1 | 1 | 0 | 0 | 0 | 0 | 0 |
| Kavontae Whipple#18 | 1 | 1 | 0 | 0 | 0 | 0 | 0 |
 John Washington III#21 | 1 | 1 | 0 | 0 | 0 | 0 | 0 |
 Julian Green#23 | 1 | 1 | 0 | 0 | 0 | 0 | 0 |
| Del Cowsette II#27 | 1 | 1 | 0 | 0 | 0 | 0 | 0 |
 DJ Lawrence#14 | 1 | 0 | 0 | 0 | 0 | 0 | 0 |
 Joseph Tabe#2 | 1 | 0 | 0 | 0 | 0 | 0 | 0 |
 Ishaun Abdul-Ali#5 | 1 | 0 | 0 | 0 | 0 | 0 | 0 |
 Ryan Odita#98 | 1 | 0 | 0 | 0 | 0 | 0 | 0 |
 Kyle Dillon#44 | 1 | 0 | 0 | 0 | 0 | 1 | 0 |
| Orrin Ford III#97 | 1 | 0 | 0 | 0 | 0 | 0 | 0 |
Rutgers| Player | TOT | SOLO | SACKS | TFL | PD | QB HUR | TD |
|---|---|---|---|---|---|---|---|
| Moses Walker#2 | 5 | 3 | 0.5 | 2.5 | 0 | 0 | 0 |
| JJ Conyers#25 | 4 | 3 | 0 | 0 | 0 | 0 | 0 |
 Rondo Porter#99 | 3 | 1 | 1 | 1.5 | 0 | 0 | 0 |
| Keshon Griffin#96 | 2 | 1 | 1 | 1 | 0 | 0 | 0 |
 J'Dan Burnett#94 | 2 | 1 | 0.5 | 1.5 | 0 | 0 | 0 |
 Abram Wright#6 | 2 | 1 | 0 | 0 | 0 | 0 | 0 |
 Chris Joines#20 | 2 | 1 | 0 | 0 | 0 | 0 | 0 |
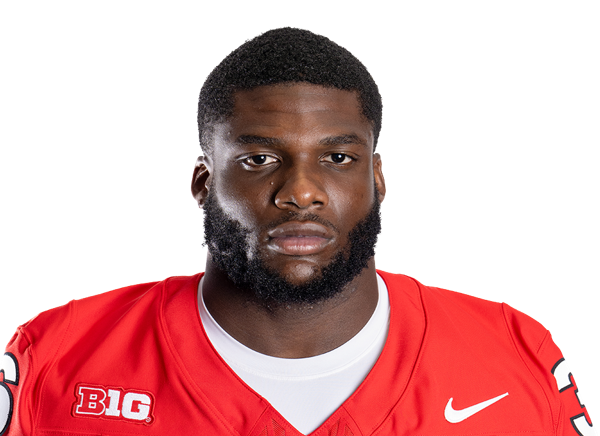 Kamar Archie#36 | 2 | 1 | 0 | 0 | 0 | 0 | 0 |
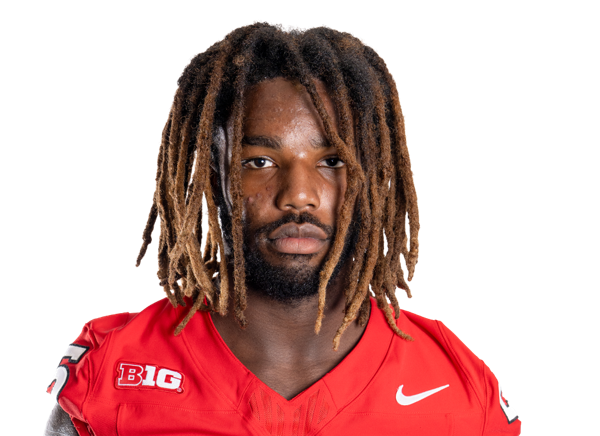 DK Gilley#9 | 2 | 1 | 0 | 0 | 0 | 0 | 0 |
 Ty Morris#10 | 2 | 1 | 0 | 0 | 0 | 0 | 0 |
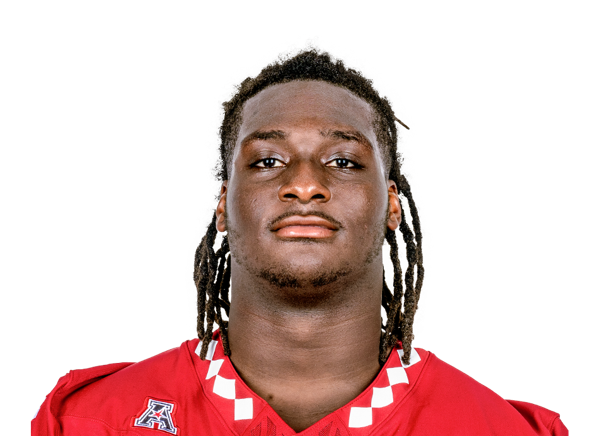 Sekou Kromah#8 | 2 | 0 | 0.5 | 0.5 | 0 | 0 | 0 |
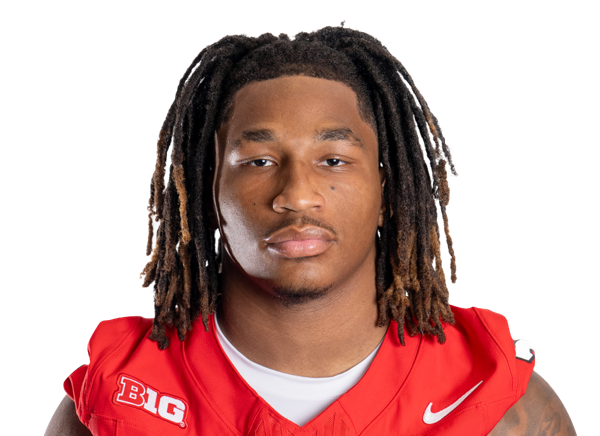 Kaj Sanders#1 | 1 | 1 | 0 | 0 | 0 | 0 | 0 |
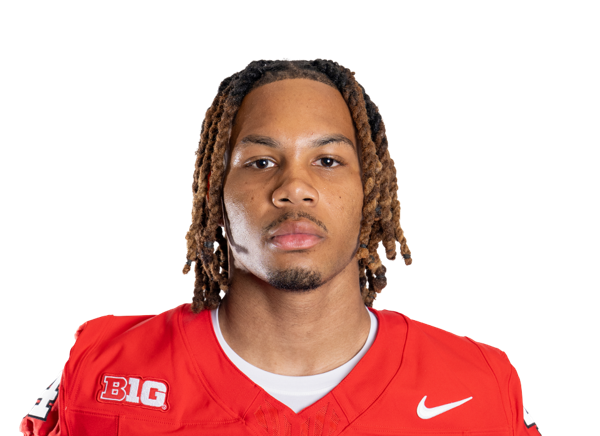 Tariq Hayer#44 | 1 | 1 | 0 | 0 | 0 | 0 | 0 |
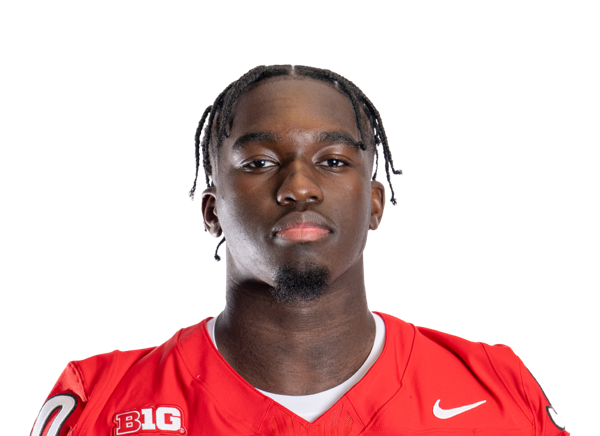 Farell Gnago#90 | 1 | 1 | 0 | 1 | 0 | 1 | 0 |
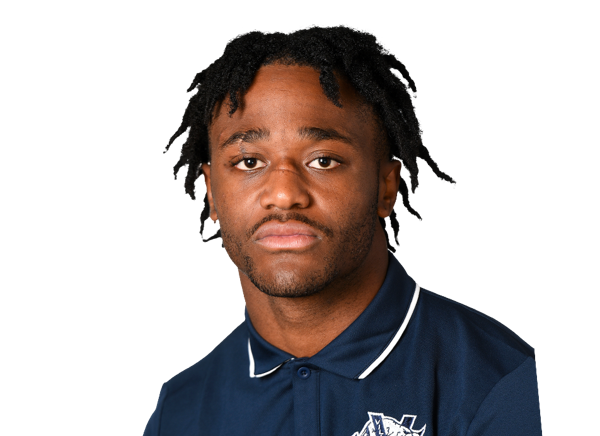 Zahmir Dawud#12 | 1 | 1 | 0 | 0 | 0 | 0 | 0 |
| Braxton Kyle#98 | 1 | 1 | 0 | 0 | 0 | 0 | 0 |
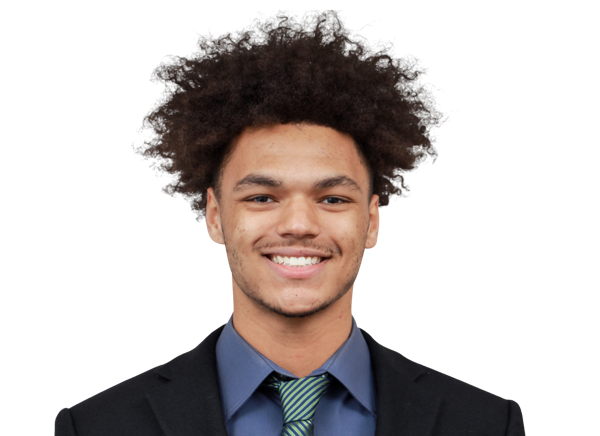 Malachi Davis#11 | 1 | 0 | 0.5 | 0.5 | 0 | 1 | 0 |
 Sean Allison#41 | 1 | 0 | 0 | 0 | 0 | 0 | 0 |
 DJ Allen#42 | 1 | 0 | 0 | 0 | 0 | 0 | 0 |
 Bradlee Jones#5 | 1 | 0 | 0 | 0.5 | 0 | 0 | 0 |
 Sage Clawges#27 | 1 | 0 | 0 | 0 | 0 | 0 | 0 |
 RJ Johnson Jr.#14 | 1 | 0 | 0 | 0 | 0 | 0 | 0 |
| Joey Kopec#38 | 1 | 0 | 0 | 0 | 0 | 0 | 0 |
 Messiah Tilson#18 | 1 | 0 | 0 | 0 | 0 | 0 | 0 |
| Jermaine Polk#92 | 1 | 0 | 0 | 0 | 0 | 0 | 0 |
 RJ Wortman#37 | 1 | 0 | 0 | 0 | 0 | 0 | 0 |
| Devonte Anderson#21 | 0 | 0 | 0 | 0 | 1 | 0 | 0 |
Howard| Player | FUM | LOST | REC |
|---|---|---|---|
| Team | 3 | 0 | 0 |
| Ja'Shawn Scroggins#6 | 1 | 1 | 0 |
Rutgers| Player | FUM | LOST | REC |
|---|---|---|---|
| DJ Allen#42 | 0 | 0 | 1 |
Howard| Player | FG | PCT | LONG | XP | PTS |
|---|---|---|---|---|---|
 Matt Conord#48 | 0/0 | 0.0 | 0 | 1/1 | 1 |
Rutgers| Player | FG | PCT | LONG | XP | PTS |
|---|---|---|---|---|---|
 Dane Pizzaro#29 | 3/3 | 100.0 | 47 | 7/7 | 16 |
Howard| Player | NO | YDS | AVG | TB | In 20 | LONG |
|---|---|---|---|---|---|---|
| Matt Conord#48 | 5 | 199 | 39.8 | 0 | 0 | 43 |
 Liam Allen IV#40 | 2 | 58 | 29.0 | 0 | 0 | 34 |
Rutgers| Player | NO | YDS | AVG | TB | In 20 | LONG |
|---|---|---|---|---|---|---|
 Jakob Anderson#94 | 1 | 49 | 49.0 | 1 | 0 | 49 |
Howard| Player | NO | YDS | AVG | LONG | TD |
|---|---|---|---|---|---|
| Naseem Pacheco#13 | 1 | 17 | 17.0 | 17 | 0 |
| John Washington III#21 | 1 | 12 | 12.0 | 12 | 0 |
| Derrick Miller#9 | 1 | 3 | 3.0 | 3 | 0 |
Rutgers| Player | NO | YDS | AVG | LONG | TD |
|---|---|---|---|---|---|
 Quentin Redding#18 | 1 | 0 | 0.0 | 0 | 0 |
Rutgers| Player | INT | YDS | TD |
|---|---|---|---|
| Bradlee Jones#5 | 2 | 1 | 0 |
Drive Summary
RUTG
Touchdown
75
HOW
Interception
20
RUTG
Touchdown
77
HOW
Punt
0
RUTG
Touchdown
49
HOW
Touchdown
75
RUTG
Touchdown
75
HOW
Interception
14
RUTG
Field Goal
26
HOW
Punt
-6
RUTG
Touchdown
40
HOW
Fumble
42
RUTG
Field Goal
49
HOW
End of Half
21
HOW
Punt
1
RUTG
Touchdown
69
HOW
Punt
-11
RUTG
Punt
1
HOW
Punt
-7
RUTG
Field Goal
13
HOW
Punt
-4
RUTG
Touchdown
53
HOW
Punt
9
RUTG
End of Half
42
Injury Report
No current injury report is available for this matchup.
Head-to-Head
Historical meetings are not available for this matchup.
Game Information
StageWeek 4
Season2026
KickoffFri, Sep 25, 7:00 pm
VenueSHI Stadium
LocationPiscataway, NJ
SurfaceArtificial Turf
BroadcastBTN
Attendance34,466
Division Standings
FCS — Mid-Eastern Athletic Conference
| Team | W | L | T | Pct | PF | PA | Home | Away | Strk |
|---|---|---|---|---|---|---|---|---|---|
 South Carolina State | 0 | 0 | 0 | .000 | 0 | 0 | — | — | — |
 Morgan State | 0 | 1 | 0 | 0.000 | 7 | 70 | 0-0 | 0-1 | L1 |
 Delaware State | 0 | 1 | 0 | 0.000 | 17 | 59 | 0-0 | 0-1 | L1 |
 Norfolk State | 0 | 2 | 0 | 0.000 | 13 | 90 | 0-0 | 0-2 | L2 |
 North Carolina Central | 0 | 1 | 0 | 0.000 | 9 | 42 | 0-0 | 0-1 | L1 |
| Howard | 0 | 2 | 0 | 0.000 | 7 | 113 | 0-0 | 0-2 | L2 |
FBS — Big Ten Conference
| Team | W | L | T | Pct | PF | PA | Home | Away | Strk |
|---|---|---|---|---|---|---|---|---|---|
 UCLA | 9 | 0 | 0 | 1.000 | 302 | 127 | 5-0 | 4-0 | W9 |
 Indiana | 8 | 1 | 0 | 0.889 | 292 | 112 | 5-1 | 3-0 | W2 |
 Iowa | 7 | 2 | 0 | 0.778 | 250 | 110 | 4-1 | 3-1 | W2 |
 Nebraska | 5 | 4 | 0 | 0.556 | 272 | 149 | 4-2 | 1-2 | L4 |
 Minnesota | 5 | 4 | 0 | 0.556 | 222 | 198 | 4-2 | 1-2 | L2 |
 Ohio State | 6 | 3 | 0 | 0.667 | 321 | 165 | 4-1 | 2-2 | L2 |
 Oregon | 6 | 3 | 0 | 0.667 | 307 | 199 | 4-1 | 2-2 | W2 |
 Wisconsin | 6 | 3 | 0 | 0.667 | 220 | 147 | 5-0 | 1-3 | W1 |
 USC | 7 | 2 | 0 | 0.778 | 292 | 218 | 5-1 | 2-1 | W1 |
 Michigan | 5 | 4 | 0 | 0.556 | 176 | 146 | 4-3 | 1-1 | L1 |
 Penn State | 5 | 4 | 0 | 0.556 | 260 | 174 | 3-2 | 2-2 | W2 |
 Washington | 5 | 4 | 0 | 0.556 | 237 | 197 | 3-3 | 2-1 | L1 |
 Northwestern | 6 | 3 | 0 | 0.667 | 279 | 174 | 5-1 | 1-2 | L2 |
 Illinois | 6 | 3 | 0 | 0.667 | 256 | 207 | 4-2 | 2-1 | W4 |
 Maryland | 3 | 6 | 0 | 0.333 | 249 | 282 | 1-4 | 2-2 | W1 |
 Michigan State | 3 | 6 | 0 | 0.333 | 174 | 212 | 2-3 | 1-3 | W1 |
 Purdue | 3 | 6 | 0 | 0.333 | 265 | 291 | 2-4 | 1-2 | L3 |
| Rutgers | 2 | 7 | 0 | 0.222 | 232 | 292 | 1-4 | 1-3 | L3 |
Howard
4th in MEAC
VS
Rutgers
16th in Big Ten
Quarterbacks & Specialists
#40
Liam Allen IV
#1
Isaiah Freeman
#6
Ja'Shawn Scroggins
Receivers & Backs
#86
Nathanial Clark
#3
Antonio Hunter
#15
Zaden Jackson
#5
Eden James
#4
Travis Kerney
#9
Derrick Miller
#13
Naseem Pacheco
#24
Billy Roberson II
#21
John Washington III
Defensive Line & Linebackers
#5
Ishaun Abdul-Ali
#56
Jaylen Daniels
#37
Cameron Demma
#91
Phoenix-Orion DiCosmo
#44
Kyle Dillon
#97
Orrin Ford III
#36
Aidan Foster
#95
Israel Lucas
#10
Faisal Mass
#98
Ryan Odita
#15
Reggie Reed Jr.
#4
Rodney Roane
#9
Jason Seraphin
#7
Gabe Stephens
#26
Glen Vinson III
Defensive Backs
#6
Ben Chandler IV
#27
Del Cowsette II
#12
CJ Dale Jr.
#8
Kaleb Gallop
#3
Michael Grandy
#23
Julian Green
#11
Kedrick Green
#14
DJ Lawrence
#21
Dre Miller-Ross
#32
J. Augustus Olidge
#17
AJ Smith-Jones
#2
Joseph Tabe
#1
Masiah Thorne
#18
Kavontae Whipple
Other
#48
Matt Conord
Quarterbacks & Specialists
#94
Jakob Anderson
#6
Sean Ashenfelder
#12
Dylan Lonergan
#10
AJ Surace
Receivers & Backs
#5
Vernon Allen III
#85
Kam Anthony
#20
Ja'shon Benjamin
#2
Ben Black III
#11
Logan Blake
Dyzier Carter
#8
KJ Duff
#32
Aiden Gibson
#4
Jourdin Houston
#3
Antwan Raymond
#18
Quentin Redding
#24
Ben Rothhaar
#9
Clay Thevenin
Defensive Line & Linebackers
#42
DJ Allen
#41
Sean Allison
#36
Kamar Archie
#94
J'Dan Burnett
#11
Malachi Davis
#90
Farell Gnago
#96
Keshon Griffin
#14
RJ Johnson Jr.
#38
Joey Kopec
#8
Sekou Kromah
#98
Braxton Kyle
#10
Ty Morris
#92
Jermaine Polk
#99
Rondo Porter
#2
Moses Walker
#6
Abram Wright
Defensive Backs
#21
Devonte Anderson
#27
Sage Clawges
#25
JJ Conyers
#12
Zahmir Dawud
#9
DK Gilley
#44
Tariq Hayer
#20
Chris Joines
#5
Bradlee Jones
#1
Kaj Sanders
#18
Messiah Tilson
#37
RJ Wortman
Other
#29
Dane Pizzaro
Howard
4th in MEAC
VS
Rutgers
16th in Big Ten
Passing
49.8
Completion Percentage
55.1
143
Completions
135
2.80
Interception Percentage
4.90
8
Interceptions
12
54
Longest Pass
80
1,434
Net Passing Yards
1,979
143.4
Net Passing Yards Per Game
219.9
287
Passing Attempts
245
3.50
Passing Touchdown %
7.30
10
Passing Touchdowns
18
97.7
Passer Rating
137.6
33
Total Sacks
25
196
Sack Yards Lost
142
5.0
Yards Per Pass Attempt
8.1
1,434
Passing Yards
1,979
0
Passing Fumbles Lost
0
10
Team Games Played
9
263.8
Yards Per Game
363.1
19.1
Total Points Per Game
25.8
191
Total Points
232
23
Total Touchdowns
29
143.4
Passing Yards Per Game
219.9
143-287
Comp-Att
135-245
33-196
Sacks-Yards Lost
25-142
Rushing
338
Rushing Attempts
320
1,204
Rushing Yards
1,289
3.6
Yards Per Rush Attempt
4.0
75
Long Rushing
54
0
20+ Yard Rushing Plays
0
11
Rushing Touchdowns
11
120.4
Rushing Yards Per Game
143.2
0
Rushing Fumbles
0
0
Rushing Fumbles Lost
0
64
Rushing 1st downs
72
10
Team Games Played
9
2,638
Total Yards
3,268
658
Total Offensive Plays
590
19.1
Total Points Per Game
25.8
191
Total Points
232
23
Total Touchdowns
29
Receiving
143
Receptions
135
0
Receiving Targets
0
1,434
Receiving Yards
1,979
1,434
Receiving Yards
1,979
10
Receiving Touchdowns
18
54
Long Reception
80
0
20+ Yard Receiving Plays
0
143.4
Receiving Yards Per Game
219.9
0
Receiving Fumbles
0
0
Receiving Fumbles Lost
0
47
Receiving Yards After Catch
676
64
Receiving First Downs
86
10
Team Games Played
9
10.0
Yards Per Reception
14.7
19.1
Total Points Per Game
25.8
191
Total Points
232
23
Total Touchdowns
29
Miscellaneous
146
Total 1st downs
172
64
Rushing 1st downs
72
66
Passing 1st downs
86
16
1st downs by penalty
14
43
Third Down Conversions
44
147
Third Down Attempts
113
29.25
3rd down %
38.94
10
Fourth Down Conversions
15
16
First Downs Attempts
27
62.50
4th down %
55.56
83
Total Penalties
39
760
Total Penalty Yards
313
17493
Possession Time Seconds
16528
0.00
Red Zone Field Goal Percentage
0.00
0.00
Red Zone Scoring Percentage
0.00
0.00
Red Zone Efficiency Percentage
0.00
0.00
Red Zone Touchdown Percentage
0.00
19
Total Takeaways
16
14
Total Giveaways
14
5
Turnover Ratio
2
0
Fumbles Lost
0
43-147
3rd down efficiency
44-113
10-16
4th down efficiency
15-27
83-760
Total-Yards
39-313
Defense
357
Solo Tackles
266
264
Assist Tackles
298
621
Total Tackles
564
22
Sacks
11
154
Sack Yards
62
71
Stuffs
58
40
Passes Defended
20
36.0
Average Interception Yards
3.2
87
Long Interception
8
0
Miscellaneous Touchdowns
0
1
Kicks Blocked
0
37
Tackles For Loss
29
10
Team Games Played
9
Defensive Interceptions
4
Interceptions
5
144
Interception Yards
16
1
Interception Touchdowns
0
4-144
INT: Total
5-16
General
16
Fumbles
4
7
Forced Fumbles
3
11
Fumbles Recovered
4
1
Fumbles Touchdowns
0
10
Games Played
9
16-0
Fumbles-Lost
4-0
Returning
39
Kick Returns
5
773
Kick Return Yards
104
19.8
Yards Per Kick Return
20.8
61
Long Kick Return
29
0
Kick Return Touchdowns
0
15
Punt Returns
3
55
Punt Return Yards
24
3.7
Yards Per Punt Return
8.0
23
Long Punt Return
14
0
Punt Return Touchdowns
0
0
Punt Return Fair Catches
0
0
Kick Return Fumbles Lost
0
0
Punt Return Fumbles Lost
0
10
Team Games Played
9
15-55
Punt: Total
3-24
Kicking
10
Field Goal Made
9
11
Field Goal Attempts
10
90.9
Field Goal Percentage
90.0
39
Long Field Goal Made
47
2
Field Goal Attempts 1-19
0
4
Field Goal Attempts 20-29
2
4
Field Goal Attempts 30-39
2
1
Field Goal Attempts 40-49
6
0
Field Goal Attempts 50+
0
21
Extra Points Made
25
21
Extra Point Attempts
26
100.0
Extra Point Percentage
96.2
2
Field Goals Made 1-19
0
4
Field Goals Made 20-29
2
4
Field Goals Made 30-39
2
0
Field Goals Made 40-49
5
0
Field Goals Made 50+
0
51
Total Kicking Points
52
10
Team Games Played
9
15
Touchback Percentage
67
0.0
Average Kickoff Return Yards
0.0
0
Kickoff Return Yards
0
0
Kickoff Returns
0
0-0
Kickoffs: Total
0-0
10-11
FG: Good-Attempts
9-10
Punting
69
Punts
29
2,654
Punt Yards
1,234
68
Long Punt
70
38.5
Gross Average Punt Yards
42.6
38.5
Net Average Punt Yards
42.6
0
Punts Blocked
0
18
Punts Inside 20
6
1
Touchbacks
3
23
Fair Catches
10
22
Punt Returns
0
0
Punt Return Yards
0
0.0
Average Punt Return Yards
0.0
10
Team Games Played
9
69-2,654
Punt: Total Yards
29-1,234
Scoring
11
Rushing Touchdowns
11
10
Receiving Touchdowns
18
0
Return Touchdowns
0
22
Total Touchdowns
29
10
Field Goals
9
21
Kick Extra Points
25
1
Total Two Point Conversions
3
191
Total Points
232
19.1
Total Points Per Game
25.8