

Kennesaw State vs Tennessee Live Score (19 Sep, 2026)
Score by Quarter
| Team | Q1 | Q2 | Q3 | Q4 | Final |
|---|---|---|---|---|---|
 Kennesaw State |
3 | 0 | 0 | 6 | 9 |
 Tennessee |
15 | 6 | 14 | 7 | 42 |
Scoring Plays
Q1
11:32
11:32
DeSean Bishop 3 Yd Run (Cooper Ranvier Kick)
Rushing Touchdown
0 – 7
Q1
3:51
3:51
Daniel Kinney 35 Yd Field Goal
Field Goal Good
3 – 7
Q1
0:26
0:26
Braylon Staley 13 Yd pass from Faizon Brandon (Luca Wolf Run for Two-Point Conversion)
Passing Touchdown
3 – 15
Q2
10:34
10:34
Cooper Ranvier 40 Yd Field Goal
Field Goal Good
3 – 18
Q2
0:23
0:23
Cooper Ranvier 43 Yd Field Goal
Field Goal Good
3 – 21
Q3
11:17
11:17
Daune Morris 42 Yd Run (Cooper Ranvier Kick)
Rushing Touchdown
3 – 28
Q3
4:25
4:25
Faizon Brandon 5 Yd Run (Cooper Ranvier Kick)
Rushing Touchdown
3 – 35
Q4
12:49
12:49
Daniel Kinney 25 Yd Field Goal
Field Goal Good
6 – 35
Q4
8:49
8:49
Hunter Barnes 3 Yd Run (Cooper Ranvier Kick)
Rushing Touchdown
6 – 42
Q4
2:45
2:45
Daniel Kinney 20 Yd Field Goal
Field Goal Good
9 – 42
Game Leaders
Kennesaw StateTennessee
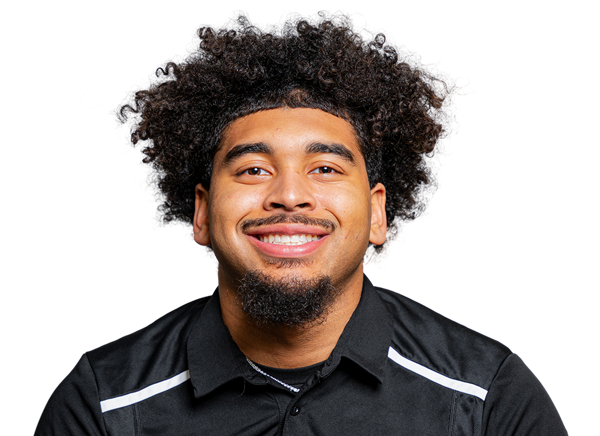 R. Collins QB
Passing Yards
 F. Brandon QBR. Collins QB
Rushing Yards
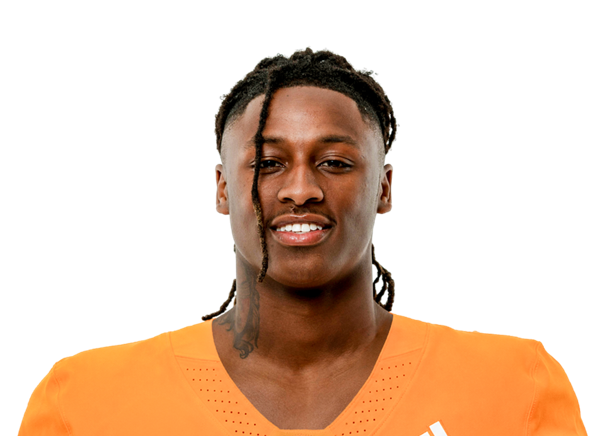 D. Morris RB
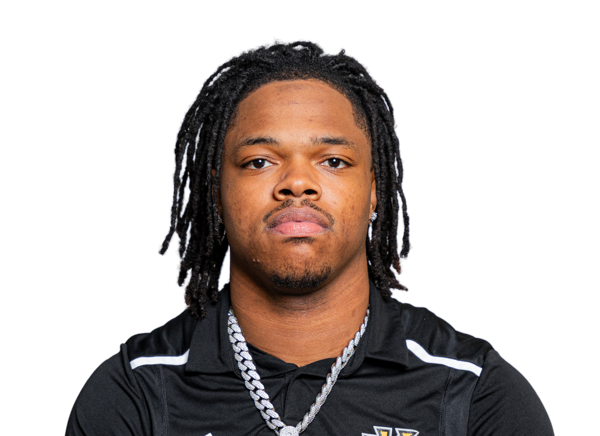 Z. Booker WR
Receiving Yards
 B. Staley WR
 K. Russell LB
Sacks
 A. Carter LB
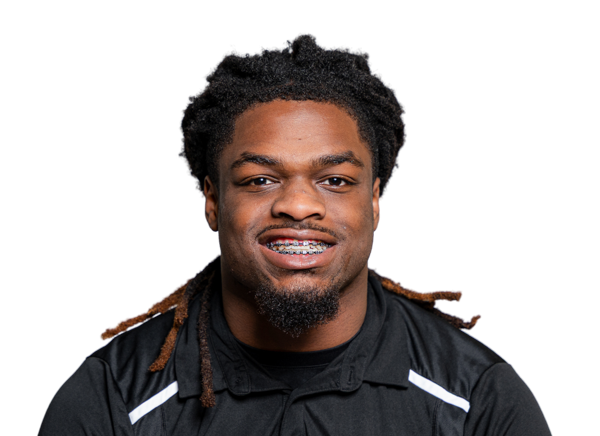 A. Thomas LB
Tackles
A. Carter LBPlayer Box Score
Kennesaw State| Player | C/ATT | YDS | AVG | TD | INT | QBR |
|---|---|---|---|---|---|---|
| Rickie Collins#1 | 22/34 | 189 | 5.6 | 0 | 0 | 41.9 |
Tennessee| Player | C/ATT | YDS | AVG | TD | INT | QBR |
|---|---|---|---|---|---|---|
| Faizon Brandon#11 | 18/26 | 178 | 6.8 | 1 | 0 | 46.4 |
Kennesaw State| Player | CAR | YDS | AVG | TD | LONG |
|---|---|---|---|---|---|
| Rickie Collins#1 | 14 | 36 | 2.6 | 0 | 18 |
 Latrelle Murrell#6 | 6 | 31 | 5.2 | 0 | 14 |
 Triston Morgan#21 | 4 | 20 | 5.0 | 0 | 12 |
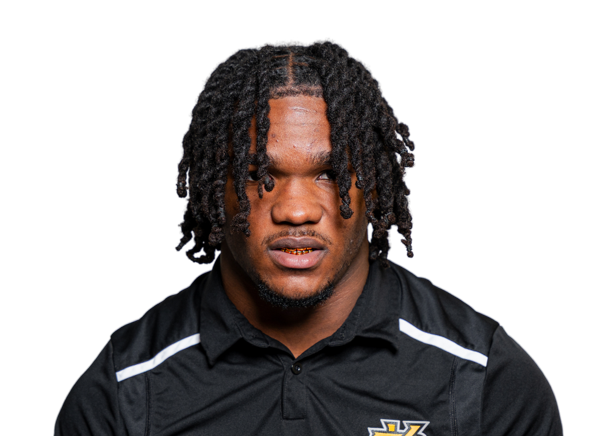 Boogie Woods III#24 | 5 | 13 | 2.6 | 0 | 6 |
 Devin Ingram#26 | 1 | 2 | 2.0 | 0 | 2 |
Tennessee| Player | CAR | YDS | AVG | TD | LONG |
|---|---|---|---|---|---|
| Daune Morris#17 | 14 | 116 | 8.3 | 1 | 42 |
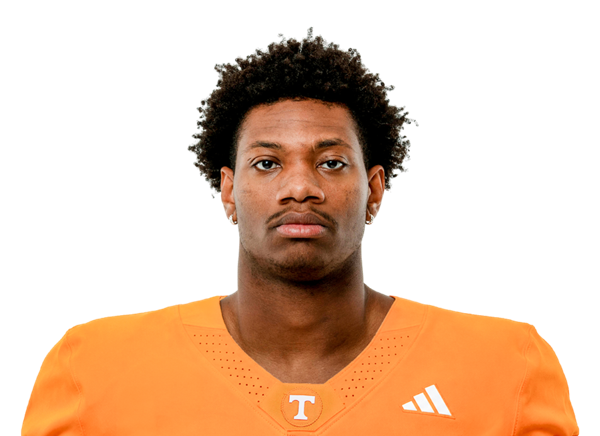 Hunter Barnes#24 | 7 | 63 | 9.0 | 1 | 38 |
| Faizon Brandon#11 | 11 | 47 | 4.3 | 1 | 13 |
 DeSean Bishop#18 | 9 | 42 | 4.7 | 1 | 10 |
Kennesaw State| Player | REC | YDS | AVG | TD | LONG |
|---|---|---|---|---|---|
| Zion Booker#4 | 10 | 78 | 7.8 | 0 | 13 |
 Brayden Munroe#11 | 2 | 34 | 17.0 | 0 | 26 |
 Dylan Gary#13 | 2 | 27 | 13.5 | 0 | 14 |
 Jamari Harrold#88 | 3 | 25 | 8.3 | 0 | 13 |
 Javon Rogers#15 | 2 | 20 | 10.0 | 0 | 11 |
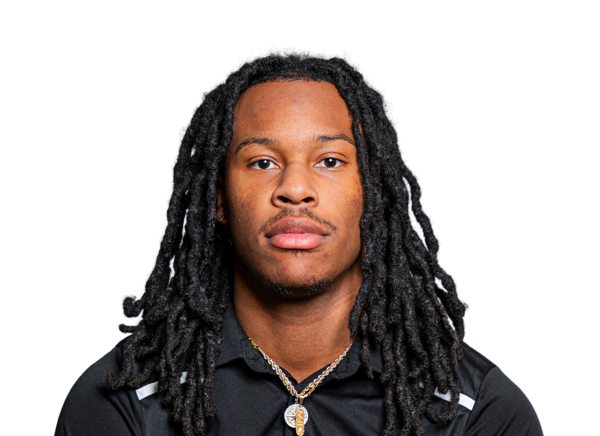 Navelle Dean#7 | 1 | 9 | 9.0 | 0 | 9 |
| Latrelle Murrell#6 | 1 | 0 | 0.0 | 0 | 0 |
| Boogie Woods III#24 | 1 | -4 | -4.0 | 0 | 0 |
Tennessee| Player | REC | YDS | AVG | TD | LONG |
|---|---|---|---|---|---|
| Braylon Staley#14 | 4 | 59 | 14.8 | 1 | 35 |
 Mike Matthews#4 | 4 | 41 | 10.3 | 0 | 18 |
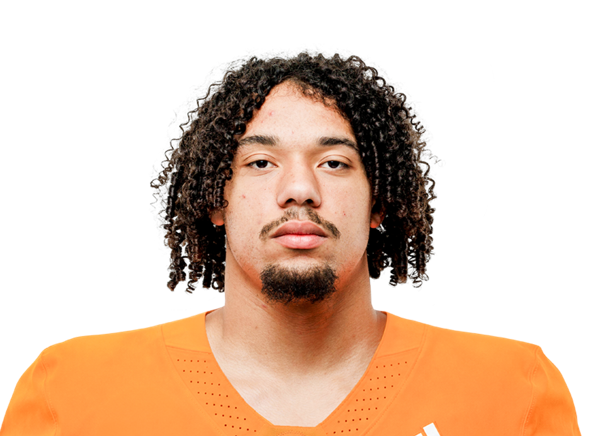 Trent Thomas#82 | 1 | 17 | 17.0 | 0 | 17 |
| DeSean Bishop#18 | 1 | 15 | 15.0 | 0 | 15 |
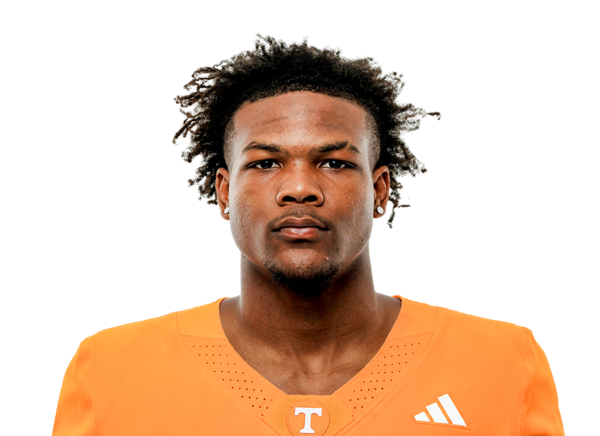 TK Keys#5 | 2 | 12 | 6.0 | 0 | 7 |
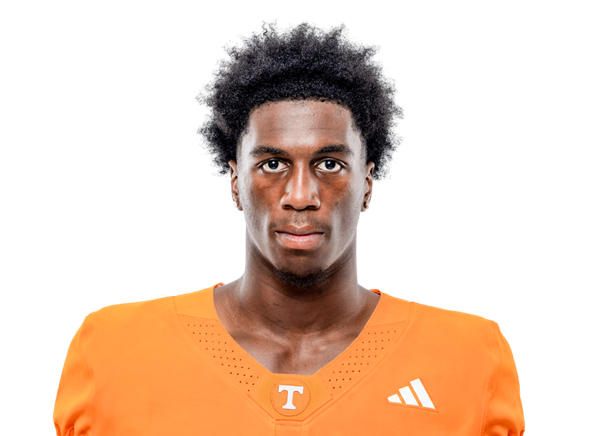 Radarious Jackson#3 | 2 | 11 | 5.5 | 0 | 8 |
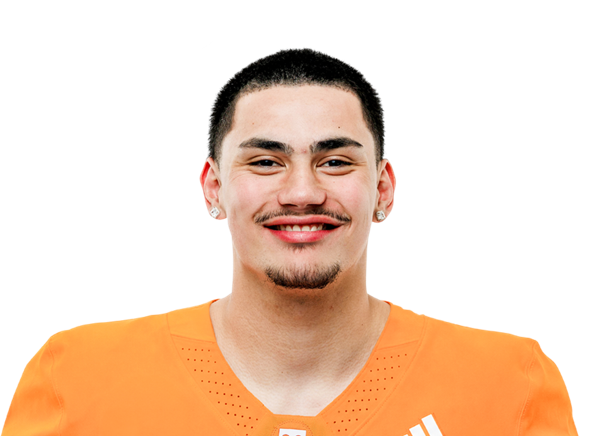 Luca Wolf#87 | 1 | 9 | 9.0 | 0 | 9 |
| Daune Morris#17 | 2 | 9 | 4.5 | 0 | 5 |
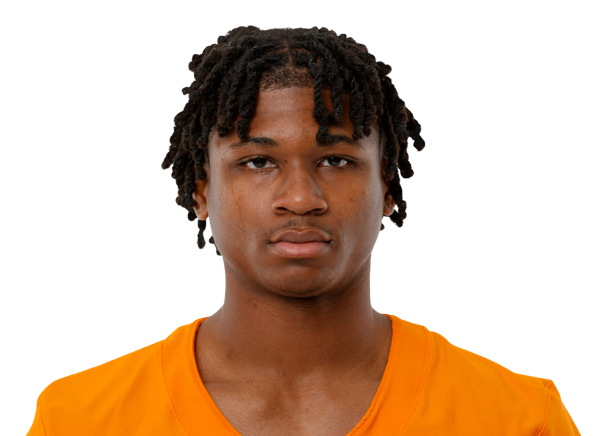 Travis Smith Jr.#1 | 1 | 5 | 5.0 | 0 | 5 |
Kennesaw State| Player | TOT | SOLO | SACKS | TFL | PD | QB HUR | TD |
|---|---|---|---|---|---|---|---|
| Alfred Thomas#16 | 10 | 3 | 0 | 0 | 0 | 0 | 0 |
 Tywon Christopher#11 | 9 | 6 | 0 | 0 | 0 | 0 | 0 |
 Cam Miller#13 | 9 | 2 | 0 | 0 | 0 | 0 | 0 |
 Karson Moss#28 | 8 | 4 | 0 | 0 | 0 | 0 | 0 |
 Perry Fisher | 8 | 3 | 0 | 0 | 0 | 0 | 0 |
| Kai Russell#31 | 7 | 3 | 1 | 1 | 2 | 0 | 0 |
 Josh Anglin#18 | 6 | 2 | 0 | 0 | 0 | 0 | 0 |
 Luke Evans#7 | 4 | 2 | 0 | 0 | 0 | 0 | 0 |
 Tay'vion Lawson#5 | 4 | 2 | 0 | 0 | 0 | 0 | 0 |
 Jaiden Grimes#96 | 2 | 1 | 0 | 0 | 0 | 0 | 0 |
 Marcus Patterson#6 | 1 | 1 | 0 | 0 | 0 | 0 | 0 |
 Kody Jones#12 | 1 | 1 | 0 | 0 | 0 | 0 | 0 |
 Isaac Paul#9 | 1 | 1 | 0 | 0 | 0 | 0 | 0 |
 Jackson Cooper#92 | 1 | 1 | 0 | 0 | 0 | 0 | 0 |
 Jordan Holmes#27 | 1 | 1 | 0 | 0 | 0 | 0 | 0 |
 Zay Wilson#56 | 1 | 1 | 0 | 0 | 0 | 0 | 0 |
 Ugonna Nwoha#55 | 1 | 0 | 0 | 0 | 0 | 0 | 0 |
 Jeremy Greaves Jr.#46 | 1 | 0 | 0 | 0 | 0 | 0 | 0 |
 Jaiden Crawford#97 | 1 | 0 | 0 | 0 | 0 | 0 | 0 |
Tennessee| Player | TOT | SOLO | SACKS | TFL | PD | QB HUR | TD |
|---|---|---|---|---|---|---|---|
| Arion Carter#7 | 8 | 6 | 1 | 2 | 0 | 1 | 0 |
 Kayin Lee#14 | 5 | 4 | 0 | 0 | 0 | 0 | 0 |
 Edwin Spillman#13 | 5 | 3 | 0 | 0 | 1 | 0 | 0 |
 Xavier Gilliam#2 | 4 | 0 | 0 | 0 | 0 | 2 | 0 |
 Amare Campbell | 3 | 3 | 0 | 0 | 0 | 0 | 0 |
 TJ Metcalf#1 | 3 | 2 | 0 | 0 | 0 | 1 | 0 |
 Qua Moss#6 | 3 | 2 | 0 | 0 | 0 | 0 | 0 |
 Jeremiah Telander#22 | 3 | 1 | 0 | 0 | 1 | 0 | 0 |
 Brayden Rouse#28 | 3 | 1 | 0 | 0 | 0 | 0 | 0 |
 Tim Merritt#25 | 2 | 2 | 0 | 0 | 0 | 0 | 0 |
 Jordan Norman#33 | 2 | 1 | 1 | 1 | 0 | 1 | 0 |
 Tre Poteat III#3 | 2 | 1 | 0 | 0 | 0 | 0 | 0 |
 Mariyon Dye#9 | 2 | 1 | 0 | 1 | 0 | 0 | 0 |
 Sidney Walton#23 | 2 | 1 | 0 | 0 | 0 | 0 | 0 |
 Carson Gentle#35 | 2 | 0 | 0 | 0 | 0 | 1 | 0 |
 Dylan Lewis#24 | 2 | 0 | 0 | 0 | 0 | 0 | 0 |
 Tyree Weathersby#18 | 1 | 1 | 0 | 0 | 0 | 1 | 0 |
 Ryan Scott#50 | 1 | 1 | 0 | 0 | 0 | 0 | 0 |
 JJ Finch#26 | 1 | 1 | 0 | 0 | 0 | 0 | 0 |
 Dejuan Lane#10 | 1 | 0 | 0 | 0 | 0 | 0 | 0 |
 Isaiah Campbell#47 | 1 | 0 | 0 | 0 | 0 | 0 | 0 |
 Ty Redmond#4 | 1 | 0 | 0 | 0 | 0 | 0 | 0 |
 Ethan Utley#17 | 1 | 0 | 0 | 0 | 1 | 1 | 0 |
 Tevis Metcalf#20 | 1 | 0 | 0 | 0 | 0 | 0 | 0 |
| Kedric Golston II#37 | 1 | 0 | 0 | 0 | 0 | 1 | 0 |
 Carter Gooden#36 | 1 | 0 | 0 | 0 | 0 | 0 | 0 |
 Breeze Carter#95 | 0 | 0 | 0 | 0 | 0 | 1 | 0 |
Kennesaw State| Player | FUM | LOST | REC |
|---|---|---|---|
| Rickie Collins#1 | 1 | 1 | 0 |
| Jamari Harrold#88 | 1 | 0 | 0 |
| Jaiden Grimes#96 | 0 | 0 | 1 |
Tennessee| Player | FUM | LOST | REC |
|---|---|---|---|
| Faizon Brandon#11 | 2 | 1 | 0 |
| Tyree Weathersby#18 | 0 | 0 | 1 |
Kennesaw State| Player | FG | PCT | LONG | XP | PTS |
|---|---|---|---|---|---|
 Daniel Kinney#89 | 3/3 | 100.0 | 35 | 0/0 | 9 |
Tennessee| Player | FG | PCT | LONG | XP | PTS |
|---|---|---|---|---|---|
 Cooper Ranvier#28 | 2/2 | 100.0 | 43 | 4/4 | 10 |
Kennesaw State| Player | NO | YDS | AVG | TB | In 20 | LONG |
|---|---|---|---|---|---|---|
 Matt McKenzie#34 | 5 | 213 | 42.6 | 0 | 0 | 51 |
Tennessee| Player | NO | YDS | AVG | TB | In 20 | LONG |
|---|---|---|---|---|---|---|
 Jackson Ross#98 | 2 | 92 | 46.0 | 0 | 1 | 47 |
Kennesaw State| Player | NO | YDS | AVG | LONG | TD |
|---|---|---|---|---|---|
| Triston Morgan#21 | 1 | 20 | 20.0 | 20 | 0 |
Tennessee| Player | NO | YDS | AVG | LONG | TD |
|---|---|---|---|---|---|
| Daune Morris#17 | 1 | 25 | 25.0 | 25 | 0 |
Tennessee| Player | NO | YDS | AVG | LONG | TD |
|---|---|---|---|---|---|
| Qua Moss#6 | 1 | 24 | 24.0 | 24 | 0 |
Drive Summary
TENN
Touchdown
75
KENN
Field Goal
59
TENN
Touchdown
75
KENN
Punt
3
TENN
Field Goal
51
KENN
Punt
4
TENN
Punt
23
KENN
Punt
20
TENN
Fumble
20
KENN
Fumble
15
TENN
Field Goal
20
KENN
End Of Half
0
KENN
Punt
-9
TENN
Touchdown
53
KENN
Punt
9
TENN
Touchdown
71
KENN
Field Goal
68
TENN
Touchdown
75
KENN
Field Goal
85
TENN
Punt
8
KENN
End of Game
2
Injury Report
No current injury report is available for this matchup.
Head-to-Head
Historical meetings are not available for this matchup.
Game Information
StageWeek 3
Season2026
KickoffSat, Sep 19, 7:45 pm
VenueNeyland Stadium
LocationKnoxville, TN
SurfaceGrass
BroadcastSECN+
Attendance101,915
Division Standings
FBS — Conference USA
| Team | W | L | T | Pct | PF | PA | Home | Away | Strk |
|---|---|---|---|---|---|---|---|---|---|
 Delaware | 5 | 5 | 0 | 0.500 | 297 | 278 | 4-1 | 1-4 | W1 |
 Liberty | 9 | 1 | 0 | 0.900 | 328 | 145 | 5-0 | 4-1 | W9 |
 Middle Tennessee | 5 | 5 | 0 | 0.500 | 265 | 307 | 4-1 | 1-4 | L1 |
 Jacksonville State | 7 | 3 | 0 | 0.700 | 286 | 208 | 5-0 | 2-3 | L1 |
 Florida International | 4 | 6 | 0 | 0.400 | 190 | 207 | 4-1 | 0-5 | L1 |
| Kennesaw State | 4 | 6 | 0 | 0.400 | 252 | 250 | 2-3 | 2-3 | W3 |
 Missouri State | 4 | 6 | 0 | 0.400 | 242 | 291 | 4-1 | 0-5 | W1 |
 New Mexico State | 3 | 7 | 0 | 0.300 | 207 | 259 | 2-3 | 1-4 | L3 |
 Sam Houston | 1 | 9 | 0 | 0.100 | 165 | 274 | 1-4 | 0-5 | L7 |
 Western Kentucky | 4 | 6 | 0 | 0.400 | 247 | 324 | 3-1 | 1-5 | W1 |
FBS — Southeastern Conference
| Team | W | L | T | Pct | PF | PA | Home | Away | Strk |
|---|---|---|---|---|---|---|---|---|---|
 Alabama | 8 | 2 | 0 | 0.800 | 358 | 189 | 4-1 | 4-1 | W3 |
 Florida | 6 | 4 | 0 | 0.600 | 313 | 262 | 3-2 | 3-2 | W1 |
 Georgia | 9 | 1 | 0 | 0.900 | 418 | 147 | 6-1 | 3-0 | W3 |
 Mississippi State | 4 | 6 | 0 | 0.400 | 245 | 291 | 2-4 | 2-2 | L6 |
 Ole Miss | 6 | 3 | 0 | 0.667 | 304 | 234 | 5-1 | 1-2 | L1 |
 Kentucky | 7 | 3 | 0 | 0.700 | 283 | 253 | 4-2 | 3-1 | L2 |
 Missouri | 6 | 4 | 0 | 0.600 | 293 | 229 | 4-1 | 2-3 | L2 |
| Tennessee | 8 | 2 | 0 | 0.800 | 314 | 143 | 5-1 | 3-1 | W2 |
 Texas | 8 | 2 | 0 | 0.800 | 302 | 178 | 5-1 | 3-1 | W4 |
 Vanderbilt | 4 | 6 | 0 | 0.400 | 213 | 286 | 3-3 | 1-3 | L1 |
 Oklahoma | 5 | 4 | 0 | 0.556 | 199 | 173 | 3-2 | 2-2 | W1 |
 Auburn | 6 | 4 | 0 | 0.600 | 260 | 246 | 4-2 | 2-2 | W2 |
 LSU | 6 | 4 | 0 | 0.600 | 355 | 181 | 5-2 | 1-2 | L2 |
 South Carolina | 6 | 4 | 0 | 0.600 | 318 | 245 | 4-2 | 2-2 | L1 |
 Texas A&M | 4 | 6 | 0 | 0.400 | 242 | 190 | 4-2 | 0-4 | L3 |
 Arkansas | 4 | 6 | 0 | 0.400 | 214 | 253 | 3-3 | 1-3 | W1 |
Kennesaw State
3rd in CUSA
VS
Tennessee
2nd in SEC
Quarterbacks & Specialists
#1
Rickie Collins
#34
Matt McKenzie
Receivers & Backs
#4
Zion Booker
#7
Navelle Dean
#13
Dylan Gary
#88
Jamari Harrold
#26
Devin Ingram
#21
Triston Morgan
#11
Brayden Munroe
#6
Latrelle Murrell
#15
Javon Rogers
#24
Boogie Woods III
Defensive Line & Linebackers
#18
Josh Anglin
#11
Tywon Christopher
#92
Jackson Cooper
#97
Jaiden Crawford
#46
Jeremy Greaves Jr.
#96
Jaiden Grimes
#28
Karson Moss
#55
Ugonna Nwoha
#6
Marcus Patterson
#31
Kai Russell
#16
Alfred Thomas
#56
Zay Wilson
Defensive Backs
#7
Luke Evans
Perry Fisher
#27
Jordan Holmes
#12
Kody Jones
#5
Tay'vion Lawson
#13
Cam Miller
#9
Isaac Paul
Other
#89
Daniel Kinney
Quarterbacks & Specialists
#11
Faizon Brandon
#98
Jackson Ross
Receivers & Backs
#24
Hunter Barnes
#18
DeSean Bishop
#3
Radarious Jackson
#5
TK Keys
#4
Mike Matthews
#17
Daune Morris
#1
Travis Smith Jr.
#14
Braylon Staley
#82
Trent Thomas
#87
Luca Wolf
Defensive Line & Linebackers
Amare Campbell
#47
Isaiah Campbell
#7
Arion Carter
#95
Breeze Carter
#9
Mariyon Dye
#26
JJ Finch
#35
Carson Gentle
#2
Xavier Gilliam
#37
Kedric Golston II
#36
Carter Gooden
#33
Jordan Norman
#28
Brayden Rouse
#50
Ryan Scott
#13
Edwin Spillman
#22
Jeremiah Telander
#17
Ethan Utley
#18
Tyree Weathersby
Defensive Backs
#10
Dejuan Lane
#14
Kayin Lee
#24
Dylan Lewis
#25
Tim Merritt
#20
Tevis Metcalf
#1
TJ Metcalf
#6
Qua Moss
#3
Tre Poteat III
#4
Ty Redmond
#23
Sidney Walton
Other
#28
Cooper Ranvier
Kennesaw State
3rd in CUSA
VS
Tennessee
3rd in SEC
Passing
66.0
Completion Percentage
65.4
223
Completions
157
2.70
Interception Percentage
1.70
9
Interceptions
4
70
Longest Pass
68
2,288
Net Passing Yards
1,715
228.8
Net Passing Yards Per Game
171.5
338
Passing Attempts
240
2.70
Passing Touchdown %
4.60
9
Passing Touchdowns
11
126.5
Passer Rating
136.8
14
Total Sacks
23
88
Sack Yards Lost
133
6.8
Yards Per Pass Attempt
7.1
2,288
Passing Yards
1,715
0
Passing Fumbles Lost
0
10
Team Games Played
10
355.1
Yards Per Game
385.5
25.2
Total Points Per Game
31.4
252
Total Points
314
31
Total Touchdowns
37
228.8
Passing Yards Per Game
171.5
223-338
Comp-Att
157-240
14-88
Sacks-Yards Lost
23-133
Rushing
313
Rushing Attempts
445
1,263
Rushing Yards
2,140
4.0
Yards Per Rush Attempt
4.8
60
Long Rushing
73
0
20+ Yard Rushing Plays
0
19
Rushing Touchdowns
24
126.3
Rushing Yards Per Game
214.0
0
Rushing Fumbles
0
0
Rushing Fumbles Lost
0
77
Rushing 1st downs
115
10
Team Games Played
10
3,551
Total Yards
3,855
665
Total Offensive Plays
708
25.2
Total Points Per Game
31.4
252
Total Points
314
31
Total Touchdowns
37
Receiving
223
Receptions
157
0
Receiving Targets
0
2,288
Receiving Yards
1,715
2,288
Receiving Yards
1,715
9
Receiving Touchdowns
11
70
Long Reception
68
0
20+ Yard Receiving Plays
0
228.8
Receiving Yards Per Game
171.5
0
Receiving Fumbles
0
0
Receiving Fumbles Lost
0
1104
Receiving Yards After Catch
1039
101
Receiving First Downs
73
10
Team Games Played
10
10.3
Yards Per Reception
10.9
25.2
Total Points Per Game
31.4
252
Total Points
314
31
Total Touchdowns
37
Miscellaneous
202
Total 1st downs
211
77
Rushing 1st downs
115
101
Passing 1st downs
73
23
1st downs by penalty
23
52
Third Down Conversions
50
133
Third Down Attempts
139
39.10
3rd down %
35.97
5
Fourth Down Conversions
14
14
First Downs Attempts
18
35.71
4th down %
77.78
89
Total Penalties
70
782
Total Penalty Yards
582
16140
Possession Time Seconds
18846
0.00
Red Zone Field Goal Percentage
0.00
0.00
Red Zone Scoring Percentage
0.00
0.00
Red Zone Efficiency Percentage
0.00
0.00
Red Zone Touchdown Percentage
0.00
17
Total Takeaways
15
12
Total Giveaways
11
5
Turnover Ratio
4
0
Fumbles Lost
0
52-133
3rd down efficiency
50-139
5-14
4th down efficiency
14-18
89-782
Total-Yards
70-582
Defense
357
Solo Tackles
320
336
Assist Tackles
284
693
Total Tackles
604
16
Sacks
39
107
Sack Yards
218
69
Stuffs
89
29
Passes Defended
38
31.7
Average Interception Yards
13.5
88
Long Interception
41
0
Miscellaneous Touchdowns
0
1
Kicks Blocked
1
43
Tackles For Loss
64
10
Team Games Played
10
Defensive Interceptions
6
Interceptions
11
190
Interception Yards
148
2
Interception Touchdowns
1
6-190
INT: Total
11-148
General
9
Fumbles
16
11
Forced Fumbles
7
8
Fumbles Recovered
11
0
Fumbles Touchdowns
0
10
Games Played
10
9-0
Fumbles-Lost
16-0
Returning
25
Kick Returns
8
591
Kick Return Yards
130
23.6
Yards Per Kick Return
16.3
99
Long Kick Return
25
1
Kick Return Touchdowns
0
13
Punt Returns
13
166
Punt Return Yards
148
12.8
Yards Per Punt Return
11.4
49
Long Punt Return
57
0
Punt Return Touchdowns
1
0
Punt Return Fair Catches
0
0
Kick Return Fumbles Lost
0
0
Punt Return Fumbles Lost
0
10
Team Games Played
10
13-166
Punt: Total
13-148
Kicking
14
Field Goal Made
18
17
Field Goal Attempts
19
82.4
Field Goal Percentage
94.7
47
Long Field Goal Made
49
0
Field Goal Attempts 1-19
0
8
Field Goal Attempts 20-29
3
5
Field Goal Attempts 30-39
9
4
Field Goal Attempts 40-49
6
0
Field Goal Attempts 50+
1
20
Extra Points Made
36
23
Extra Point Attempts
36
87.0
Extra Point Percentage
100.0
0
Field Goals Made 1-19
0
8
Field Goals Made 20-29
3
4
Field Goals Made 30-39
9
2
Field Goals Made 40-49
6
0
Field Goals Made 50+
0
62
Total Kicking Points
90
10
Team Games Played
10
72
Touchback Percentage
78
0.0
Average Kickoff Return Yards
0.0
0
Kickoff Return Yards
0
0
Kickoff Returns
0
0-0
Kickoffs: Total
0-0
14-17
FG: Good-Attempts
18-19
Punting
44
Punts
42
1,922
Punt Yards
1,835
61
Long Punt
57
43.7
Gross Average Punt Yards
43.7
43.7
Net Average Punt Yards
43.7
0
Punts Blocked
0
12
Punts Inside 20
18
1
Touchbacks
2
18
Fair Catches
22
12
Punt Returns
10
0
Punt Return Yards
0
0.0
Average Punt Return Yards
0.0
10
Team Games Played
10
44-1,922
Punt: Total Yards
42-1,835
Scoring
19
Rushing Touchdowns
24
9
Receiving Touchdowns
11
1
Return Touchdowns
1
29
Total Touchdowns
36
14
Field Goals
18
20
Kick Extra Points
36
2
Total Two Point Conversions
1
252
Total Points
314
25.2
Total Points Per Game
31.4