

Lindenwood vs Missouri State Live Score (12 Sep, 2026)
Score by Quarter
| Team | Q1 | Q2 | Q3 | Q4 | Final |
|---|---|---|---|---|---|
 Lindenwood | 0 | 0 | 7 | 7 | 14 |
 Missouri State | 14 | 20 | 14 | 0 | 48 |
Scoring Plays
Q1
10:39
10:39
I. Myers run for 24 yds, for a TD (S. McDonald KICK)
Rushing Touchdown
0 – 7
Q1
0:07
0:07
C. Lair run for 1 yd, for a TD (S. McDonald KICK)
Rushing Touchdown
0 – 14
Q2
11:21
11:21
R. Green Jr. run for 1 yd, for a TD (S. McDonald KICK)
Rushing Touchdown
0 – 21
Q2
10:01
10:01
S. Locklear pass to I. Myers for 72 yds, for a TD (S. McDonald PAT MISSED)
Pass Reception
0 – 27
Q2
5:20
5:20
B. Dubar run for 10 yds, for a TD (S. McDonald KICK)
Rushing Touchdown
0 – 34
Q3
7:13
7:13
R. Green Jr. run for 1 yd, for a TD (S. McDonald KICK)
Rushing Touchdown
0 – 41
Q3
4:07
4:07
P. Battle pass to D. Krobath for 15 yds, for a TD (W. Graham KICK)
Passing Touchdown
7 – 41
Q3
0:04
0:04
H. Belin IV run for 16 yds, for a TD (S. McDonald KICK)
Rushing Touchdown
7 – 48
Q4
12:21
12:21
P. Battle pass to E. Roy for 32 yds, for a TD (W. Graham KICK)
Passing Touchdown
14 – 48
Game Leaders
LindenwoodMissouri State
 P. Battle QB
Passing Yards
 S. Locklear QBP. Battle QB
Rushing Yards
 R. Green Jr. RB
 E. Roy WR
Receiving Yards
 I. Myers WR
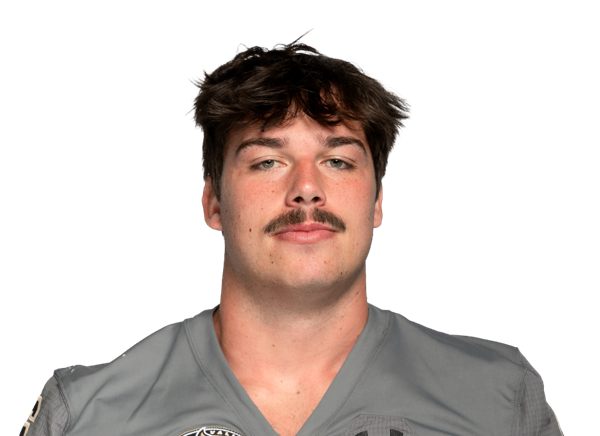 J. Smith DE
Sacks
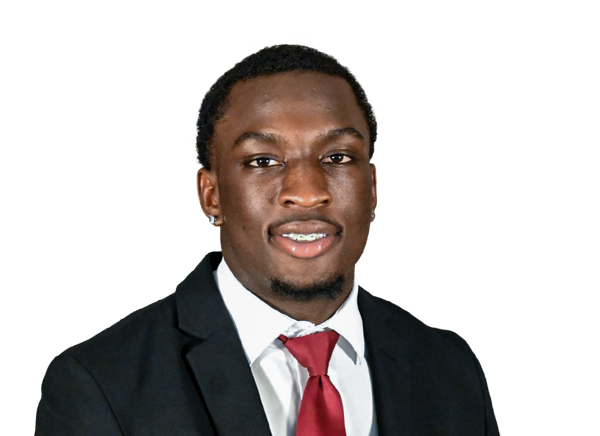 M. Ganaway CB
 C. Jacobmeier LB
Tackles
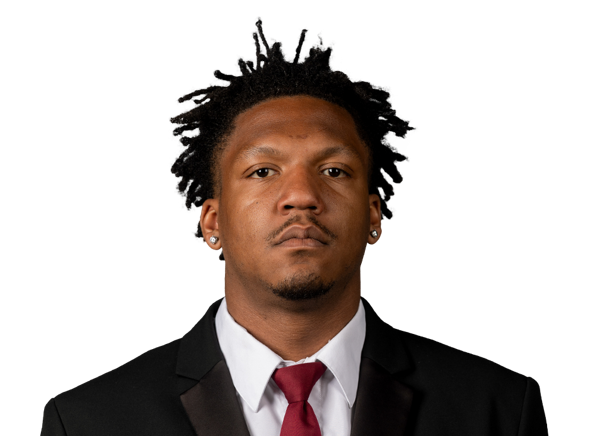 J. Lloyd LB
Player Box Score
Lindenwood| Player | C/ATT | YDS | AVG | TD | INT |
|---|---|---|---|---|---|
| Pops Battle#9 | 8/20 | 105 | 5.3 | 2 | 1 |
Missouri State| Player | C/ATT | YDS | AVG | TD | INT |
|---|---|---|---|---|---|
| Skyler Locklear#9 | 17/20 | 258 | 12.9 | 1 | 0 |
 Henry Belin IV#2 | 3/4 | 55 | 13.8 | 0 | 0 |
 Elijah Leonard#7 | 1/1 | 7 | 7.0 | 0 | 0 |
Lindenwood| Player | CAR | YDS | AVG | TD | LONG |
|---|---|---|---|---|---|
| Pops Battle#9 | 14 | 63 | 4.5 | 0 | 21 |
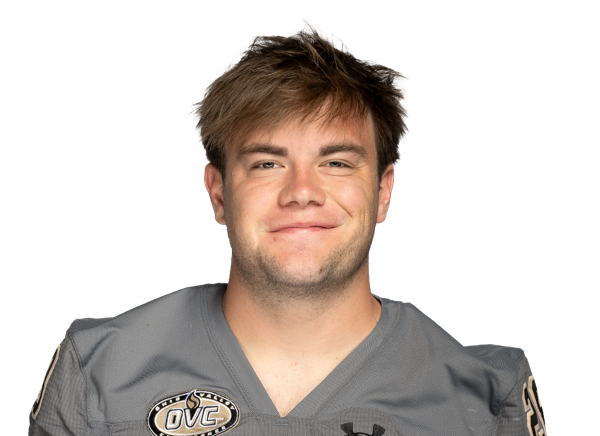 Noah Triplett#28 | 8 | 37 | 4.6 | 0 | 18 |
 Jared Rhodes#7 | 9 | 14 | 1.6 | 0 | 7 |
 Carter Dowell#32 | 1 | 5 | 5.0 | 0 | 5 |
 Robert Giaimo#21 | 2 | -1 | -0.5 | 0 | 2 |
Missouri State| Player | CAR | YDS | AVG | TD | LONG |
|---|---|---|---|---|---|
| Ramone Green Jr.#22 | 12 | 80 | 6.7 | 2 | 19 |
 Breezy Dubar#1 | 15 | 77 | 5.1 | 1 | 25 |
 Amar'e Johnson#43 | 7 | 37 | 5.3 | 0 | 12 |
| Isaiah Myers#3 | 1 | 24 | 24.0 | 1 | 24 |
 King Davis#10 | 5 | 19 | 3.8 | 0 | 11 |
| Henry Belin IV#2 | 1 | 16 | 16.0 | 1 | 16 |
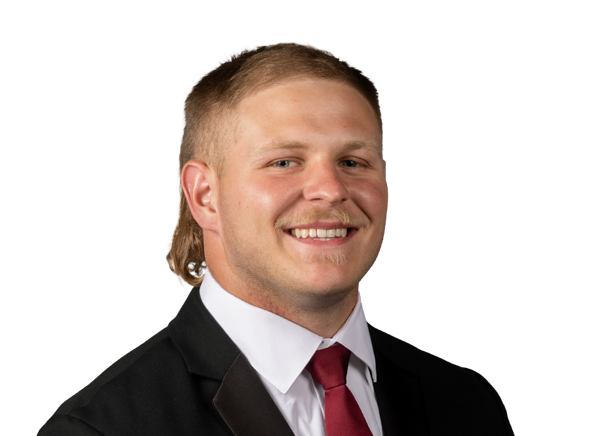 Connor Lair#40 | 4 | 9 | 2.3 | 1 | 5 |
| Skyler Locklear#9 | 4 | 6 | 1.5 | 0 | 5 |
| Jared Lloyd | 1 | 4 | 4.0 | 0 | 4 |
 Team | 3 | -8 | -2.7 | 0 | 8 |
Lindenwood| Player | REC | YDS | AVG | TD | LONG |
|---|---|---|---|---|---|
| Elijah Roy#18 | 4 | 72 | 18.0 | 1 | 32 |
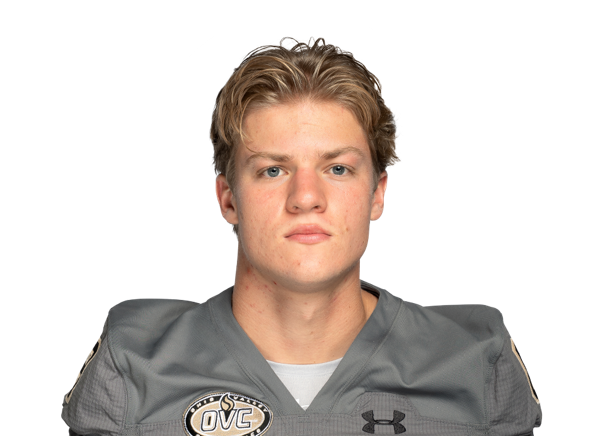 Drew Krobath#8 | 1 | 15 | 15.0 | 1 | 15 |
 Jalen Smith#4 | 2 | 10 | 5.0 | 0 | 7 |
| Jared Rhodes#7 | 1 | 8 | 8.0 | 0 | 8 |
Missouri State| Player | REC | YDS | AVG | TD | LONG |
|---|---|---|---|---|---|
| Isaiah Myers#3 | 5 | 155 | 31.0 | 1 | 72 |
 Mekhi Miller#6 | 2 | 55 | 27.5 | 0 | 42 |
 Dillon Hipp#85 | 2 | 52 | 26.0 | 0 | 47 |
 Jmariyae Robinson | 5 | 40 | 8.0 | 0 | 14 |
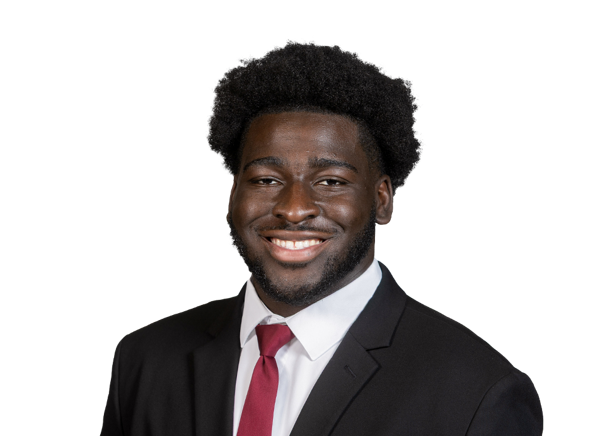 Michael Osei-Bonsu#80 | 1 | 7 | 7.0 | 0 | 7 |
 James Rexroat#86 | 1 | 5 | 5.0 | 0 | 5 |
 Isaiah McMorris#8 | 1 | 3 | 3.0 | 0 | 3 |
| Ramone Green Jr.#22 | 1 | 3 | 3.0 | 0 | 3 |
| Breezy Dubar#1 | 2 | 1 | 0.5 | 0 | 3 |
 Matthew Greene#54 | 1 | -1 | -1.0 | 0 | 0 |
Lindenwood| Player | TOT | SOLO | SACKS | TFL | PD | QB HUR | TD |
|---|---|---|---|---|---|---|---|
| Caleb Jacobmeier#30 | 8 | 8 | 0 | 0 | 0 | 0 | 0 |
 Brayon Crawford#16 | 7 | 4 | 0 | 1 | 0 | 0 | 0 |
 Aiden Knapke#22 | 6 | 2 | 0 | 0 | 1 | 0 | 0 |
 Nolan O'Hara#24 | 5 | 3 | 0 | 0 | 0 | 0 | 0 |
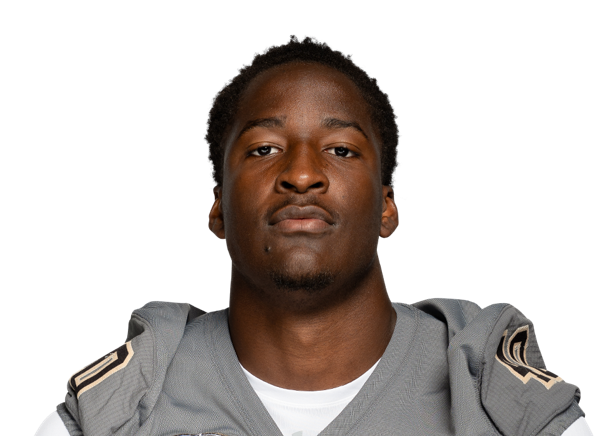 David Amaliri#40 | 5 | 1 | 0 | 0 | 0 | 0 | 0 |
 Mason Van Der Brink#31 | 5 | 0 | 0 | 0 | 0 | 0 | 0 |
 Elijah Thomas#7 | 4 | 4 | 0 | 1 | 0 | 1 | 0 |
 Zach Lewis#15 | 4 | 4 | 0 | 0 | 0 | 0 | 0 |
 King Smith#53 | 4 | 1 | 0 | 1.5 | 0 | 0 | 0 |
| Jesse Smith#6 | 3 | 2 | 1 | 1 | 0 | 0 | 0 |
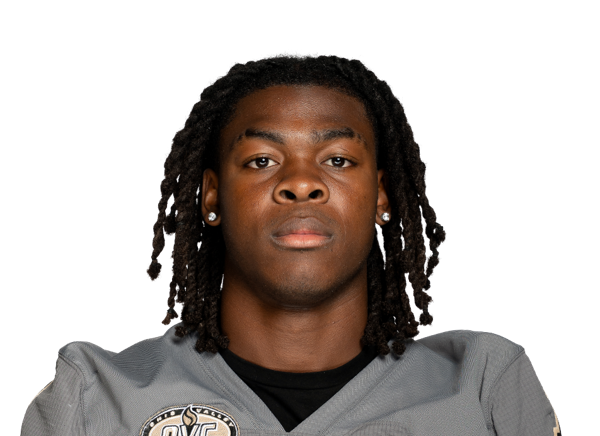 Sam Owens#1 | 3 | 1 | 0 | 0 | 0 | 0 | 0 |
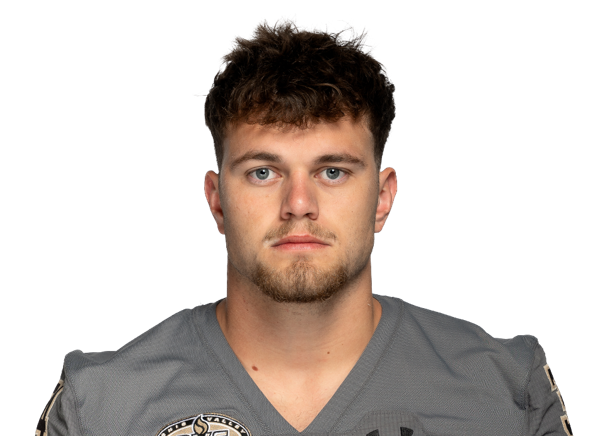 Owen Thomas#34 | 3 | 1 | 0 | 0 | 0 | 0 | 0 |
 DeVonta Owens#2 | 2 | 2 | 0 | 0 | 0 | 0 | 0 |
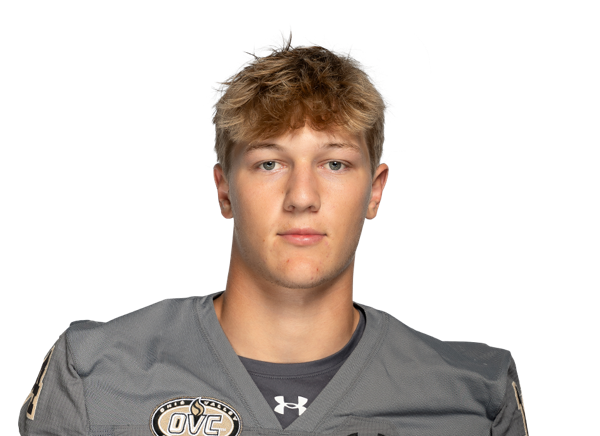 Carter Johnson#14 | 2 | 2 | 0 | 0 | 0 | 0 | 0 |
| Isaac Edwards#10 | 2 | 2 | 0 | 0 | 0 | 0 | 0 |
 Keshawn Lyons#3 | 2 | 1 | 0 | 0 | 0 | 0 | 0 |
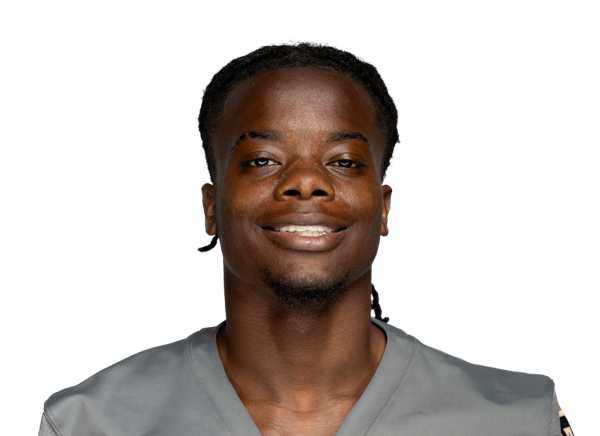 Zech Pratt | 2 | 1 | 0 | 0 | 0 | 0 | 0 |
 Ke'Andre McClendon#9 | 2 | 1 | 0 | 0 | 0 | 0 | 0 |
 Eddie Becu#99 | 2 | 1 | 0 | 0 | 0 | 0 | 0 |
 Andrew Baumgart#23 | 2 | 0 | 0 | 0 | 0 | 0 | 0 |
 Caelum Jones#11 | 2 | 0 | 0 | 0 | 0 | 0 | 0 |
 Luke Zook#25 | 1 | 1 | 0 | 0 | 0 | 0 | 0 |
 Tristan Ginn#49 | 1 | 1 | 0 | 0 | 0 | 0 | 0 |
 Connor Cook#67 | 1 | 1 | 0 | 0 | 0 | 0 | 0 |
 Reece Satterwhite#92 | 1 | 1 | 0 | 0 | 0 | 0 | 0 |
 Andrew Zook#98 | 1 | 0 | 0 | 0 | 0 | 0 | 0 |
 Ethan Beard#17 | 1 | 0 | 0 | 0 | 0 | 0 | 0 |
 Jacob Waller#5 | 1 | 0 | 0 | 0 | 0 | 0 | 0 |
 Mason Burke#4 | 1 | 0 | 0 | 0.5 | 0 | 0 | 0 |
 Cornell Mcintosh#96 | 1 | 0 | 0 | 0 | 0 | 0 | 0 |
 Keenan Paschall#95 | 1 | 0 | 0 | 0 | 0 | 0 | 0 |
Missouri State| Player | TOT | SOLO | SACKS | TFL | PD | QB HUR | TD |
|---|---|---|---|---|---|---|---|
| Jared Lloyd | 6 | 4 | 1 | 2 | 0 | 0 | 0 |
 Jashawn Cooper#21 | 6 | 2 | 0 | 0.5 | 0 | 0 | 0 |
 Anthony Mattison#33 | 4 | 2 | 0 | 0.5 | 0 | 0 | 0 |
| Malik Ganaway#7 | 3 | 3 | 1 | 1 | 0 | 0 | 0 |
 Christian Ford#29 | 3 | 3 | 0 | 0 | 1 | 0 | 0 |
 Joel Boamah#12 | 3 | 3 | 0 | 0 | 0 | 0 | 0 |
 Antonio Smith#2 | 2 | 2 | 0 | 0 | 0 | 0 | 0 |
 Josh Lukusa#92 | 2 | 1 | 0 | 0 | 0 | 0 | 0 |
 Kellen Lindstrom#5 | 2 | 1 | 0 | 1 | 0 | 0 | 0 |
 Caden Wiest#30 | 2 | 1 | 0 | 0 | 1 | 0 | 0 |
 Tim Brantley Jr.#11 | 2 | 1 | 0 | 0 | 0 | 0 | 0 |
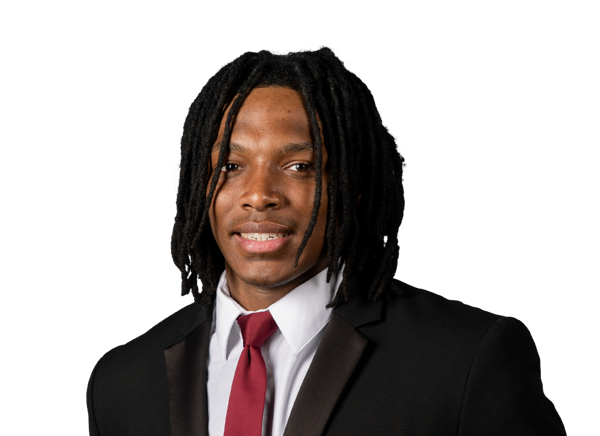 Martavis Blackmon#15 | 2 | 1 | 0 | 0 | 1 | 0 | 0 |
 Gilles Tchio#57 | 1 | 1 | 1 | 1 | 0 | 0 | 0 |
 Dylan Brooks#49 | 1 | 1 | 0 | 0 | 2 | 2 | 0 |
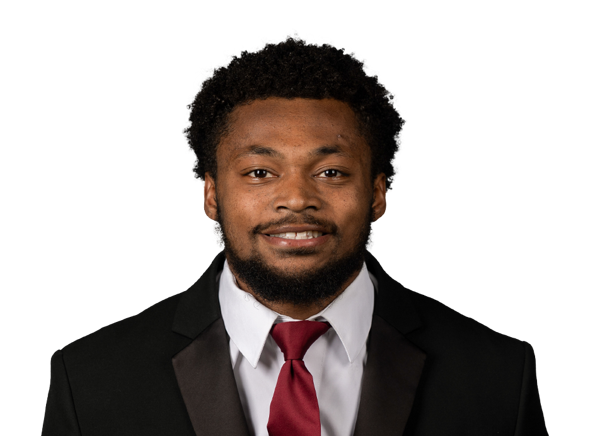 Khalil Anderson#3 | 1 | 1 | 0 | 0 | 0 | 0 | 0 |
 J.J. O'Neal#16 | 1 | 1 | 0 | 0 | 0 | 0 | 0 |
 Stratton Shufelt#38 | 1 | 1 | 0 | 0 | 0 | 0 | 0 |
 Gionni McBride#23 | 1 | 1 | 0 | 0 | 0 | 0 | 0 |
 Caleb Olabode#24 | 1 | 1 | 0 | 1 | 0 | 0 | 0 |
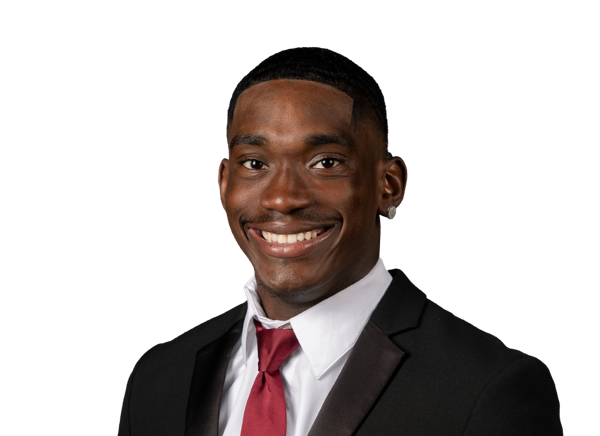 Joel Kpassou#8 | 1 | 1 | 0 | 0 | 0 | 0 | 0 |
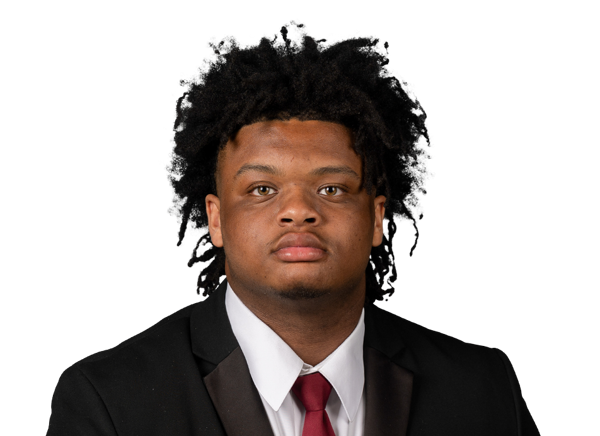 Brandon Hightower#90 | 1 | 0 | 0 | 0 | 0 | 0 | 0 |
| Michael Osei-Bonsu#80 | 0 | 0 | 0 | 0 | 0 | 1 | 0 |
Lindenwood| Player | FUM | LOST | REC |
|---|---|---|---|
| Pops Battle#9 | 1 | 1 | 0 |
| Carter Dowell#32 | 1 | 0 | 0 |
Missouri State| Player | FUM | LOST | REC |
|---|---|---|---|
| Stratton Shufelt#38 | 0 | 0 | 1 |
Lindenwood| Player | FG | PCT | LONG | XP | PTS |
|---|---|---|---|---|---|
 Will Graham#37 | 0/1 | 0.0 | 0 | 2/2 | 2 |
Missouri State| Player | FG | PCT | LONG | XP | PTS |
|---|---|---|---|---|---|
 Stewart McDonald#25 | 0/1 | 0.0 | 0 | 6/7 | 6 |
Lindenwood| Player | NO | YDS | AVG | TB | In 20 | LONG |
|---|---|---|---|---|---|---|
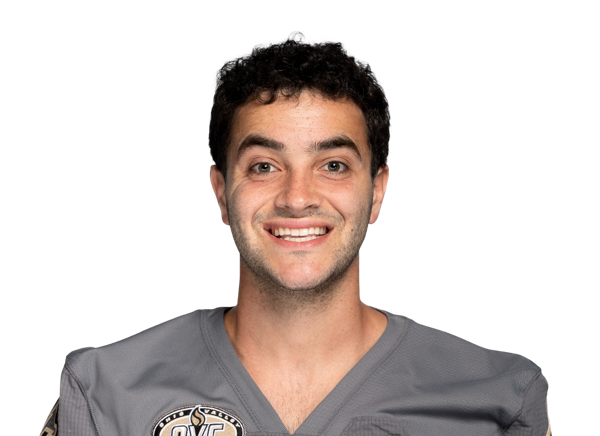 Connor Lander#43 | 6 | 267 | 44.5 | 0 | 0 | 59 |
Missouri State| Player | NO | YDS | AVG | TB | In 20 | LONG |
|---|---|---|---|---|---|---|
| Stewart McDonald#25 | 1 | 41 | 41.0 | 0 | 1 | 41 |
Lindenwood| Player | NO | YDS | AVG | LONG | TD |
|---|---|---|---|---|---|
| Jalen Smith#4 | 1 | 12 | 12.0 | 12 | 0 |
Missouri State| Player | NO | YDS | AVG | LONG | TD |
|---|---|---|---|---|---|
| Isaiah McMorris#8 | 1 | 16 | 16.0 | 16 | 0 |
| Mekhi Miller#6 | 1 | 1 | 1.0 | 1 | 0 |
Missouri State| Player | NO | YDS | AVG | LONG | TD |
|---|---|---|---|---|---|
 Devin Staley#42 | 1 | 26 | 26.0 | 26 | 0 |
| Jmariyae Robinson | 4 | 22 | 5.5 | 15 | 0 |
Missouri State| Player | INT | YDS | TD |
|---|---|---|---|
| Jashawn Cooper#21 | 1 | 0 | 0 |
Drive Summary
MOST
Touchdown
75
LIN
Missed FG
61
MOST
Punt
19
LIN
Punt
-2
MOST
Touchdown
48
LIN
Punt
-7
MOST
Touchdown
62
LIN
Punt
-3
MOST
Touchdown
72
LIN
Punt
9
MOST
Touchdown
72
LIN
Interception
2
MOST
Missed FG
10
LIN
Punt
17
MOST
Touchdown
69
LIN
Touchdown
65
MOST
Downs
29
LIN
Fumble
11
MOST
Touchdown
68
LIN
Touchdown
75
MOST
Downs
53
LIN
Punt
5
MOST
End Of Quarter
-3
Injury Report
No current injury report is available for this matchup.
Head-to-Head
Historical meetings are not available for this matchup.
Game Information
StageWeek 2
Season2026
KickoffSat, Sep 12, 7:00 pm
VenueRobert W. Plaster Stadium
LocationSpringfield, MO
SurfaceArtificial Turf
BroadcastESPN+
Division Standings
FCS — Ohio Valley Conference
| Team | W | L | T | Pct | PF | PA | Home | Away | Strk |
|---|---|---|---|---|---|---|---|---|---|
| Lindenwood | 0 | 2 | 0 | 0.000 | 17 | 77 | 0-0 | 0-2 | L2 |
 Eastern Illinois | 0 | 1 | 0 | 0.000 | 7 | 59 | 0-0 | 0-1 | L1 |
 Southeast Missouri State | 0 | 1 | 0 | 0.000 | 10 | 38 | 0-0 | 0-1 | L1 |
 Western Illinois | 0 | 1 | 0 | 0.000 | 9 | 36 | 0-0 | 0-1 | L1 |
 UT Martin | 0 | 2 | 0 | 0.000 | 28 | 97 | 0-0 | 0-2 | L2 |
 Tennessee State | 0 | 1 | 0 | 0.000 | 3 | 63 | 0-0 | 0-1 | L1 |
 Gardner-Webb | 0 | 2 | 0 | 0.000 | 58 | 60 | 0-0 | 0-2 | L2 |
 Charleston Southern | 0 | 2 | 0 | 0.000 | 0 | 68 | 0-0 | 0-2 | L2 |
FBS — Conference USA
| Team | W | L | T | Pct | PF | PA | Home | Away | Strk |
|---|---|---|---|---|---|---|---|---|---|
 Middle Tennessee | 5 | 4 | 0 | 0.556 | 242 | 279 | 4-1 | 1-3 | W1 |
 Delaware | 4 | 5 | 0 | 0.444 | 273 | 262 | 3-1 | 1-4 | L1 |
 Florida International | 4 | 5 | 0 | 0.444 | 174 | 183 | 4-1 | 0-4 | W1 |
 Kennesaw State | 3 | 6 | 0 | 0.333 | 226 | 243 | 2-3 | 1-3 | W2 |
 Liberty | 8 | 1 | 0 | 0.889 | 300 | 122 | 4-0 | 4-1 | W8 |
| Missouri State | 3 | 6 | 0 | 0.333 | 215 | 270 | 3-1 | 0-5 | L1 |
 New Mexico State | 3 | 6 | 0 | 0.333 | 186 | 232 | 2-3 | 1-3 | L2 |
 Jacksonville State | 7 | 2 | 0 | 0.778 | 262 | 173 | 5-0 | 2-2 | W6 |
 Sam Houston | 1 | 8 | 0 | 0.111 | 158 | 248 | 1-3 | 0-5 | L6 |
 Western Kentucky | 3 | 6 | 0 | 0.333 | 212 | 300 | 2-1 | 1-5 | L2 |
Lindenwood
VS
Missouri State
6th in CUSA
Quarterbacks & Specialists
#9
Pops Battle
#43
Connor Lander
Offensive Line
#67
Connor Cook
Receivers & Backs
#32
Carter Dowell
#21
Robert Giaimo
#8
Drew Krobath
#7
Jared Rhodes
#18
Elijah Roy
#4
Jalen Smith
#28
Noah Triplett
Defensive Line & Linebackers
#40
David Amaliri
#23
Andrew Baumgart
#17
Ethan Beard
#99
Eddie Becu
#4
Mason Burke
#49
Tristan Ginn
#30
Caleb Jacobmeier
#11
Caelum Jones
#15
Zach Lewis
#9
Ke'Andre McClendon
#96
Cornell Mcintosh
#24
Nolan O'Hara
#95
Keenan Paschall
#92
Reece Satterwhite
#6
Jesse Smith
#53
King Smith
#7
Elijah Thomas
#34
Owen Thomas
#31
Mason Van Der Brink
#5
Jacob Waller
#98
Andrew Zook
Defensive Backs
#16
Brayon Crawford
#10
Isaac Edwards
#14
Carter Johnson
#22
Aiden Knapke
#3
Keshawn Lyons
#2
DeVonta Owens
#1
Sam Owens
Zech Pratt
#25
Luke Zook
Other
#37
Will Graham
Quarterbacks & Specialists
#2
Henry Belin IV
#7
Elijah Leonard
#9
Skyler Locklear
#25
Stewart McDonald
Offensive Line
#54
Matthew Greene
Receivers & Backs
#10
King Davis
#1
Breezy Dubar
#22
Ramone Green Jr.
#85
Dillon Hipp
#43
Amar'e Johnson
#40
Connor Lair
#8
Isaiah McMorris
#6
Mekhi Miller
#3
Isaiah Myers
#80
Michael Osei-Bonsu
#86
James Rexroat
Jmariyae Robinson
#42
Devin Staley
Defensive Line & Linebackers
#15
Martavis Blackmon
#11
Tim Brantley Jr.
#49
Dylan Brooks
#21
Jashawn Cooper
#90
Brandon Hightower
#5
Kellen Lindstrom
Jared Lloyd
#92
Josh Lukusa
#24
Caleb Olabode
#38
Stratton Shufelt
#57
Gilles Tchio
#30
Caden Wiest
Defensive Backs
#3
Khalil Anderson
#12
Joel Boamah
#29
Christian Ford
#7
Malik Ganaway
#8
Joel Kpassou
#33
Anthony Mattison
#23
Gionni McBride
#16
J.J. O'Neal
#2
Antonio Smith
Lindenwood
1st in OVC
VS
Missouri State
4th in CUSA
Passing
62.2
Completion Percentage
65.1
138
Completions
177
1.40
Interception Percentage
2.60
3
Interceptions
7
46
Longest Pass
72
1,612
Net Passing Yards
2,100
179.1
Net Passing Yards Per Game
233.3
222
Passing Attempts
272
4.10
Passing Touchdown %
4.40
9
Passing Touchdowns
12
134.1
Passer Rating
139.1
22
Total Sacks
22
116
Sack Yards Lost
142
7.3
Yards Per Pass Attempt
7.7
1,612
Passing Yards
2,100
0
Passing Fumbles Lost
0
9
Team Games Played
9
340.9
Yards Per Game
354.9
24.6
Total Points Per Game
23.9
221
Total Points
215
25
Total Touchdowns
25
179.1
Passing Yards Per Game
233.3
138-222
Comp-Att
177-272
22-116
Sacks-Yards Lost
22-142
Rushing
359
Rushing Attempts
297
1,456
Rushing Yards
1,094
4.1
Yards Per Rush Attempt
3.7
81
Long Rushing
49
0
20+ Yard Rushing Plays
0
14
Rushing Touchdowns
10
161.8
Rushing Yards Per Game
121.6
0
Rushing Fumbles
0
0
Rushing Fumbles Lost
0
70
Rushing 1st downs
58
9
Team Games Played
9
3,068
Total Yards
3,194
603
Total Offensive Plays
591
24.6
Total Points Per Game
23.9
221
Total Points
215
25
Total Touchdowns
25
Receiving
138
Receptions
177
0
Receiving Targets
0
1,612
Receiving Yards
2,100
1,612
Receiving Yards
2,100
9
Receiving Touchdowns
12
46
Long Reception
72
0
20+ Yard Receiving Plays
0
179.1
Receiving Yards Per Game
233.3
0
Receiving Fumbles
0
0
Receiving Fumbles Lost
0
95
Receiving Yards After Catch
932
70
Receiving First Downs
81
9
Team Games Played
9
11.7
Yards Per Reception
11.9
24.6
Total Points Per Game
23.9
221
Total Points
215
25
Total Touchdowns
25
Miscellaneous
164
Total 1st downs
168
70
Rushing 1st downs
58
70
Passing 1st downs
81
24
1st downs by penalty
29
44
Third Down Conversions
41
129
Third Down Attempts
115
34.11
3rd down %
35.65
8
Fourth Down Conversions
7
13
First Downs Attempts
19
61.54
4th down %
36.84
57
Total Penalties
75
562
Total Penalty Yards
599
16809
Possession Time Seconds
14830
0.00
Red Zone Field Goal Percentage
0.00
0.00
Red Zone Scoring Percentage
0.00
0.00
Red Zone Efficiency Percentage
0.00
0.00
Red Zone Touchdown Percentage
0.00
10
Total Takeaways
15
8
Total Giveaways
10
2
Turnover Ratio
5
0
Fumbles Lost
0
44-129
3rd down efficiency
41-115
8-13
4th down efficiency
7-19
57-562
Total-Yards
75-599
Defense
324
Solo Tackles
343
242
Assist Tackles
294
566
Total Tackles
637
17
Sacks
17
138
Sack Yards
127
57
Stuffs
59
27
Passes Defended
34
25.0
Average Interception Yards
26.8
85
Long Interception
60
0
Miscellaneous Touchdowns
0
3
Kicks Blocked
2
36
Tackles For Loss
32
9
Team Games Played
9
Defensive Interceptions
8
Interceptions
4
200
Interception Yards
107
1
Interception Touchdowns
2
8-200
INT: Total
4-107
General
6
Fumbles
8
4
Forced Fumbles
10
7
Fumbles Recovered
8
1
Fumbles Touchdowns
1
9
Games Played
9
6-0
Fumbles-Lost
8-0
Returning
15
Kick Returns
15
248
Kick Return Yards
263
16.5
Yards Per Kick Return
17.5
46
Long Kick Return
35
0
Kick Return Touchdowns
0
8
Punt Returns
8
150
Punt Return Yards
76
18.8
Yards Per Punt Return
9.5
56
Long Punt Return
26
0
Punt Return Touchdowns
0
0
Punt Return Fair Catches
0
0
Kick Return Fumbles Lost
0
0
Punt Return Fumbles Lost
0
9
Team Games Played
9
8-150
Punt: Total
8-76
Kicking
15
Field Goal Made
13
21
Field Goal Attempts
17
71.4
Field Goal Percentage
76.5
50
Long Field Goal Made
42
0
Field Goal Attempts 1-19
0
6
Field Goal Attempts 20-29
8
10
Field Goal Attempts 30-39
5
3
Field Goal Attempts 40-49
3
2
Field Goal Attempts 50+
1
24
Extra Points Made
20
24
Extra Point Attempts
21
100.0
Extra Point Percentage
95.2
0
Field Goals Made 1-19
0
6
Field Goals Made 20-29
7
6
Field Goals Made 30-39
5
2
Field Goals Made 40-49
1
1
Field Goals Made 50+
0
69
Total Kicking Points
59
9
Team Games Played
9
33
Touchback Percentage
22
0.0
Average Kickoff Return Yards
0.0
0
Kickoff Return Yards
0
0
Kickoff Returns
0
0-0
Kickoffs: Total
0-0
15-21
FG: Good-Attempts
13-17
Punting
40
Punts
31
1,518
Punt Yards
1,301
59
Long Punt
57
38.0
Gross Average Punt Yards
42.0
38.0
Net Average Punt Yards
42.0
0
Punts Blocked
0
10
Punts Inside 20
10
1
Touchbacks
1
9
Fair Catches
10
20
Punt Returns
16
0
Punt Return Yards
0
0.0
Average Punt Return Yards
0.0
9
Team Games Played
9
40-1,518
Punt: Total Yards
31-1,301
Scoring
14
Rushing Touchdowns
10
9
Receiving Touchdowns
12
0
Return Touchdowns
0
24
Total Touchdowns
23
15
Field Goals
13
24
Kick Extra Points
20
0
Total Two Point Conversions
3
221
Total Points
215
24.6
Total Points Per Game
23.9