

Louisville vs NC State Live Score (3 Oct, 2026)
Score by Quarter
| Team | Q1 | Q2 | Q3 | Q4 | Final |
|---|---|---|---|---|---|
 Louisville |
0 | 7 | 14 | 7 | 28 |
 NC State |
3 | 10 | 15 | 3 | 31 |
Scoring Plays
Q1
7:34
7:34
K. Vinesett 46 yd FG GOOD
Field Goal Good
0 – 3
Q2
14:20
14:20
CJ Bailey pass to K. Jackson for 19 yds, for a TD (K. Vinesett KICK)
Pass Reception
0 – 10
Q2
5:51
5:51
L. Kienholz pass to L. McCoy for 33 yds, for a TD (C. Hilbert KICK)
Passing Touchdown
7 – 10
Q2
1:42
1:42
K. Vinesett 29 yd FG GOOD
Field Goal Good
7 – 13
Q3
11:03
11:03
CJ Bailey pass to T. Warren for 34 yds, for a TD (K. Vinesett KICK)
Passing Touchdown
7 – 20
Q3
8:05
8:05
L. Kienholz pass to T. Richardson for 38 yds, for a TD (C. Hilbert KICK)
Passing Touchdown
14 – 20
Q3
3:50
3:50
W. Wilson run for 1 yd, for a TD (CJ Bailey pass to D. Gause GOOD for Two-Point Conversion)
Rushing Touchdown
14 – 28
Q3
0:20
0:20
K. Brown run for 1 yd, for a TD (C. Hilbert KICK)
Rushing Touchdown
21 – 28
Q4
12:27
12:27
I. Brown run for 70 yds, for a TD (C. Hilbert KICK)
Rushing Touchdown
28 – 28
Q4
5:30
5:30
K. Vinesett 28 yd FG GOOD
Field Goal Good
28 – 31
Game Leaders
LouisvilleNC State
 L. Kienholz QB
Passing Yards
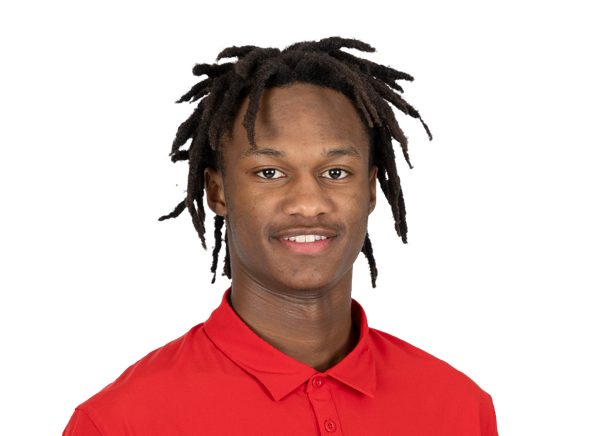 C. Bailey QB
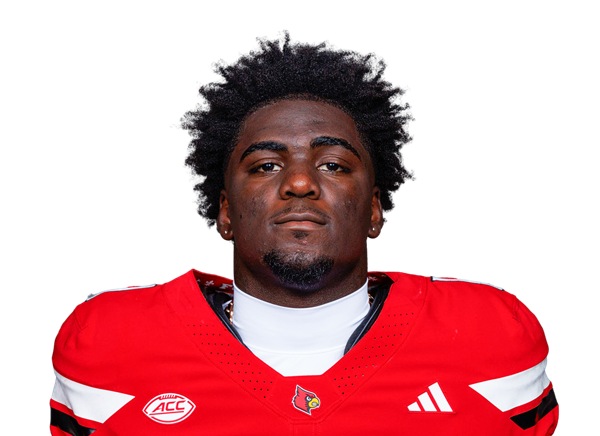 I. Brown RB
Rushing Yards
 D. Gause RB
 T. Richardson WR
Receiving Yards
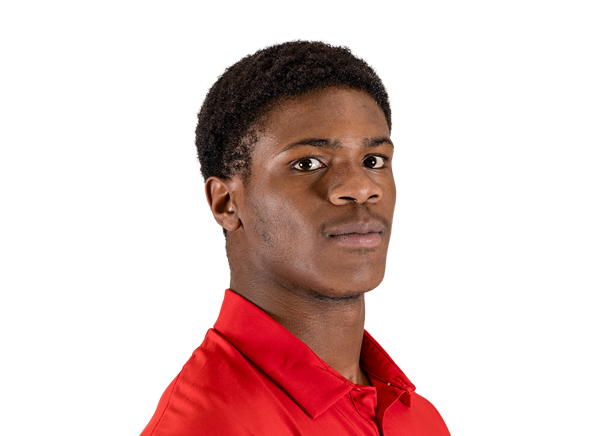 J. Trader WR
 B. Perry LB
Sacks
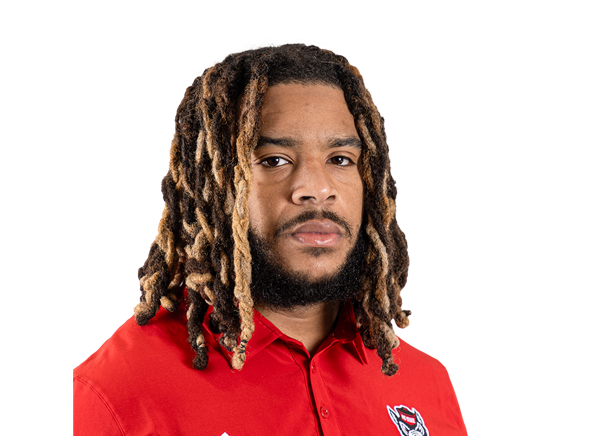 H. Dyson III LB
 T.J. Capers LB
Tackles
 B. Nelson II CB
Player Box Score
Louisville| Player | C/ATT | YDS | AVG | TD | INT |
|---|---|---|---|---|---|
| Lincoln Kienholz#3 | 21/30 | 254 | 8.5 | 2 | 0 |
NC State| Player | C/ATT | YDS | AVG | TD | INT |
|---|---|---|---|---|---|
| CJ Bailey#11 | 24/40 | 373 | 9.3 | 2 | 1 |
| Joshisa Trader#2 | 1/1 | 0 | 0.0 | 0 | 0 |
Louisville| Player | CAR | YDS | AVG | TD | LONG |
|---|---|---|---|---|---|
| Isaac Brown#1 | 9 | 125 | 13.9 | 1 | 70 |
 Keyjuan Brown#5 | 8 | 88 | 11.0 | 1 | 49 |
| Lincoln Kienholz#3 | 7 | 24 | 3.4 | 0 | 23 |
 Team | 1 | -6 | -6.0 | 0 | 0 |
NC State| Player | CAR | YDS | AVG | TD | LONG |
|---|---|---|---|---|---|
| Davion Gause#7 | 21 | 69 | 3.3 | 0 | 12 |
 Will Wilson#10 | 7 | 27 | 3.9 | 1 | 9 |
| CJ Bailey#11 | 7 | 19 | 2.7 | 0 | 9 |
 Jayden Scott#1 | 5 | 12 | 2.4 | 0 | 9 |
 Darius Johnson#25 | 1 | 3 | 3.0 | 0 | 3 |
| Team | 2 | -10 | -5.0 | 0 | 0 |
Louisville| Player | REC | YDS | AVG | TD | LONG |
|---|---|---|---|---|---|
| Tre Richardson | 8 | 117 | 14.6 | 1 | 38 |
 Lawayne McCoy#7 | 2 | 41 | 20.5 | 1 | 33 |
 TreyShun Hurry#2 | 4 | 37 | 9.3 | 0 | 13 |
 Justyn Reid#85 | 1 | 20 | 20.0 | 0 | 20 |
 Jackson Voth#14 | 2 | 14 | 7.0 | 0 | 9 |
| Keyjuan Brown#5 | 1 | 13 | 13.0 | 0 | 13 |
 Jaleel Skinner#88 | 2 | 12 | 6.0 | 0 | 10 |
| Isaac Brown#1 | 1 | 0 | 0.0 | 0 | 0 |
NC State| Player | REC | YDS | AVG | TD | LONG |
|---|---|---|---|---|---|
| Joshisa Trader#2 | 5 | 92 | 18.4 | 0 | 46 |
 Preston Douglas#19 | 5 | 74 | 14.8 | 0 | 35 |
| Davion Gause#7 | 3 | 45 | 15.0 | 0 | 36 |
 Keenan Jackson#8 | 3 | 44 | 14.7 | 1 | 19 |
 Tyran Warren#13 | 2 | 43 | 21.5 | 1 | 34 |
 Victor Snow | 3 | 39 | 13.0 | 0 | 24 |
 Hunter Provience#86 | 1 | 24 | 24.0 | 0 | 24 |
| Darius Johnson#25 | 1 | 8 | 8.0 | 0 | 8 |
 Chance Robinson#82 | 1 | 4 | 4.0 | 0 | 4 |
| CJ Bailey#11 | 1 | 0 | 0.0 | 0 | 0 |
Louisville| Player | TOT | SOLO | SACKS | TFL | PD | QB HUR | TD |
|---|---|---|---|---|---|---|---|
| T.J. Capers#11 | 12 | 6 | 0 | 0 | 0 | 1 | 0 |
 Kaleb Beasley#10 | 9 | 7 | 0 | 0 | 1 | 0 | 0 |
 Clev Lubin#50 | 8 | 3 | 1 | 1 | 0 | 0 | 0 |
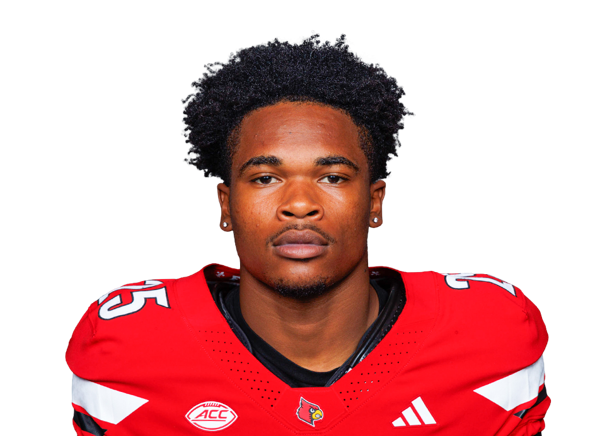 Brycen Scott#25 | 7 | 6 | 0 | 0 | 2 | 0 | 0 |
| Benjamin Perry#23 | 6 | 1 | 1 | 1 | 1 | 1 | 0 |
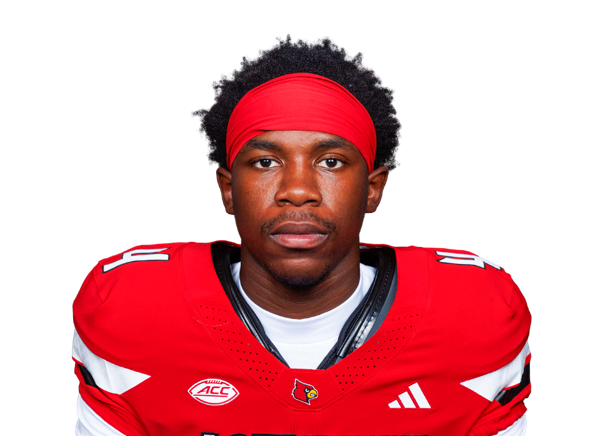 TJ Banks#4 | 5 | 3 | 0 | 0 | 0 | 0 | 0 |
 Tayon Holloway#13 | 5 | 2 | 0 | 0 | 1 | 0 | 0 |
 Stanquan Clark#6 | 5 | 1 | 0 | 0 | 1 | 0 | 0 |
 Jerod Smith II#99 | 4 | 3 | 0 | 1 | 0 | 1 | 0 |
 Daylen Russell#90 | 3 | 3 | 0 | 0 | 0 | 0 | 0 |
 Tyler Thompson#3 | 3 | 2 | 0 | 0 | 0 | 0 | 0 |
 Micah Carter#19 | 3 | 1 | 0 | 0 | 0 | 0 | 0 |
 DJ Waller Jr.#12 | 2 | 2 | 0 | 0 | 0 | 0 | 0 |
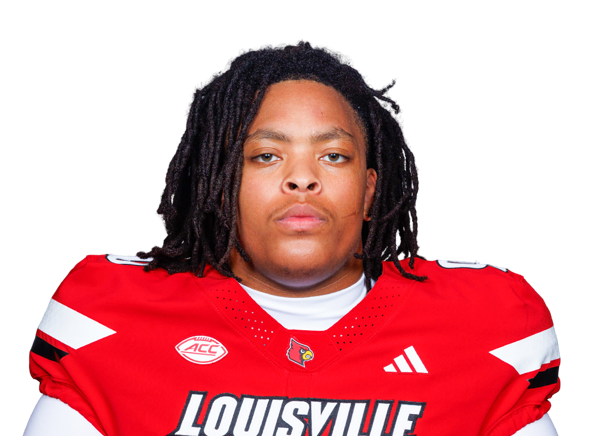 Bailey Abercrombie#93 | 2 | 0 | 0 | 0 | 0 | 0 | 0 |
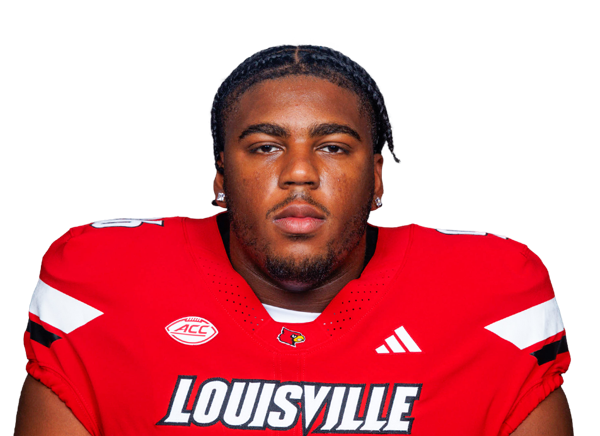 Tommy Ziesmer#96 | 1 | 1 | 0 | 0 | 0 | 0 | 0 |
 Demeco Kennedy#2 | 1 | 1 | 0 | 0 | 0 | 0 | 0 |
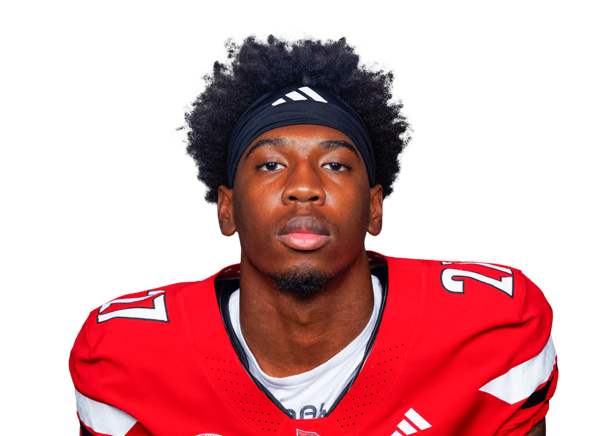 Myles Norwood#27 | 1 | 0 | 0 | 0 | 0 | 0 | 0 |
 Drew Kegebein#54 | 1 | 0 | 0 | 0 | 0 | 0 | 0 |
NC State| Player | TOT | SOLO | SACKS | TFL | PD | QB HUR | TD |
|---|---|---|---|---|---|---|---|
| Brian Nelson II#7 | 9 | 7 | 0 | 0 | 1 | 0 | 0 |
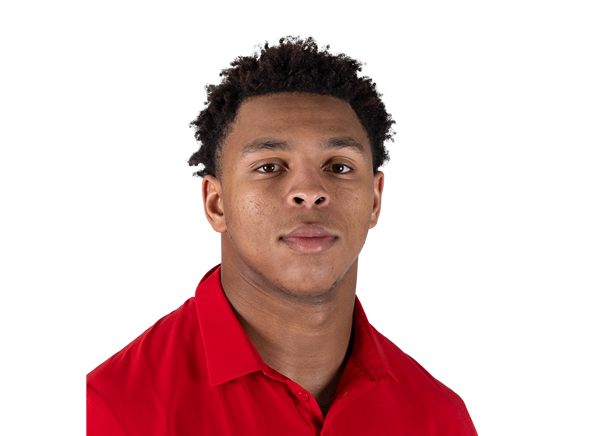 Popo Aguirre | 6 | 3 | 0 | 0 | 0 | 0 | 0 |
 Jaren Sensabaugh#14 | 5 | 3 | 0 | 0 | 1 | 0 | 0 |
 Tristan Teasdell#3 | 4 | 0 | 0 | 0 | 0 | 0 | 0 |
| Harvey Dyson III#5 | 3 | 2 | 1 | 1.5 | 0 | 0 | 0 |
 Brody Barnhardt#29 | 3 | 2 | 0 | 0 | 0 | 0 | 0 |
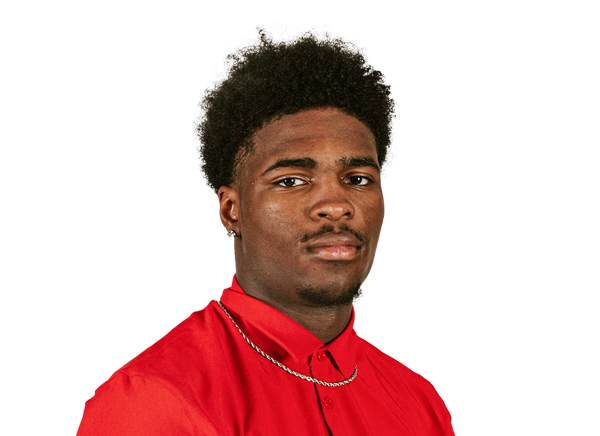 LaCorian Hodge#35 | 3 | 2 | 0 | 0 | 0 | 0 | 0 |
 Da'Kaari Nelson#8 | 3 | 1 | 0 | 0 | 1 | 0 | 0 |
 Jamel Johnson | 3 | 1 | 0 | 0 | 0 | 0 | 0 |
 Jackson Vick#22 | 3 | 0 | 0 | 0 | 0 | 1 | 0 |
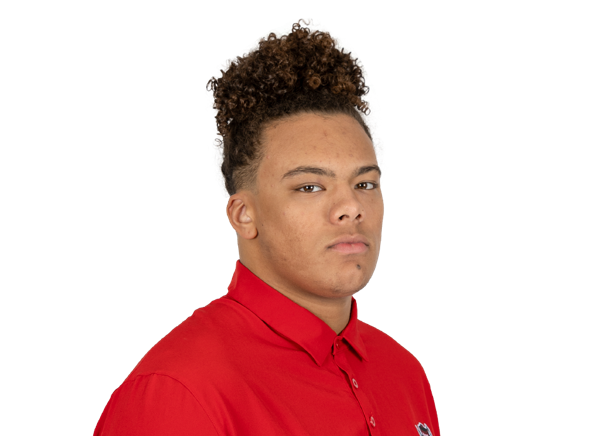 Chase Bond#92 | 2 | 2 | 1 | 1 | 0 | 1 | 0 |
 King Mack#4 | 2 | 1 | 0 | 0 | 0 | 0 | 0 |
 Isaiah Shirley#88 | 2 | 1 | 0 | 1 | 1 | 0 | 0 |
 Zane Williams#30 | 2 | 0 | 0 | 0 | 0 | 0 | 0 |
| Darius Johnson#25 | 2 | 0 | 0 | 0 | 0 | 0 | 0 |
 Ke'Von Carter#42 | 1 | 1 | 1 | 1 | 0 | 0 | 0 |
 Katron Evans#55 | 1 | 1 | 0 | 0 | 0 | 0 | 0 |
 Ronnie Royal III#2 | 1 | 1 | 0 | 0 | 1 | 0 | 0 |
 Ziggy Moore#33 | 1 | 1 | 0 | 0 | 0 | 0 | 0 |
 AJ Prim#99 | 1 | 1 | 0 | 0 | 0 | 0 | 0 |
 Joseph Adedire#13 | 1 | 0 | 0 | 0.5 | 0 | 0 | 0 |
 Adrian Farrow#47 | 1 | 0 | 0 | 0 | 0 | 0 | 0 |
 Caden Gordon#12 | 1 | 0 | 0 | 0 | 0 | 0 | 0 |
 Logan Foust#38 | 1 | 0 | 0 | 0 | 0 | 0 | 0 |
 Jordan Moreta#44 | 1 | 0 | 0 | 0 | 0 | 0 | 0 |
 Elijah Satchell#58 | 0 | 0 | 0 | 0 | 1 | 0 | 0 |
Louisville| Player | FUM | LOST | REC |
|---|---|---|---|
| Keyjuan Brown#5 | 2 | 2 | 0 |
| Lincoln Kienholz#3 | 1 | 1 | 0 |
| Team | 1 | 0 | 0 |
| Isaac Brown#1 | 1 | 0 | 0 |
NC State| Player | FUM | LOST | REC |
|---|---|---|---|
| Popo Aguirre | 0 | 0 | 3 |
Louisville| Player | FG | PCT | LONG | XP | PTS |
|---|---|---|---|---|---|
 Carson Hilbert#35 | 0/0 | 0.0 | 0 | 4/4 | 4 |
NC State| Player | FG | PCT | LONG | XP | PTS |
|---|---|---|---|---|---|
 Kanoah Vinesett#94 | 3/3 | 100.0 | 46 | 2/2 | 11 |
Louisville| Player | NO | YDS | AVG | TB | In 20 | LONG |
|---|---|---|---|---|---|---|
| Niall Hayes#91 | 3 | 120 | 40.0 | 0 | 1 | 43 |
NC State| Player | NO | YDS | AVG | TB | In 20 | LONG |
|---|---|---|---|---|---|---|
 Jackson Waller#96 | 3 | 109 | 36.3 | 0 | 0 | 43 |
Louisville| Player | NO | YDS | AVG | LONG | TD |
|---|---|---|---|---|---|
| Isaac Brown#1 | 4 | 82 | 20.5 | 21 | 0 |
 Braxton Jennings#32 | 2 | 38 | 19.0 | 21 | 0 |
NC State| Player | NO | YDS | AVG | LONG | TD |
|---|---|---|---|---|---|
| Victor Snow | 1 | 7 | 7.0 | 7 | 0 |
Louisville| Player | INT | YDS | TD |
|---|---|---|---|
| Kaleb Beasley#10 | 1 | 0 | 0 |
Drive Summary
LOU
Punt
26
NCSU
Field Goal
52
LOU
Fumble
59
NCSU
Touchdown
79
LOU
Downs
60
NCSU
Punt
-1
LOU
Touchdown
49
NCSU
Field Goal
66
LOU
Punt
33
NCSU
End Of Half
-3
NCSU
Touchdown
75
LOU
Touchdown
80
NCSU
Punt
14
LOU
Fumble
6
NCSU
Touchdown
41
LOU
Touchdown
77
NCSU
Interception
67
LOU
Touchdown
80
NCSU
Punt
0
LOU
Fumble
63
NCSU
Field Goal
76
LOU
Punt
-10
NCSU
End Of Quarter
25
Injury Report
No current injury report is available for this matchup.
Head-to-Head
Historical meetings are not available for this matchup.
Game Information
StageWeek 5
Season2026
KickoffSat, Oct 3, 3:30 pm
VenueCarter-Finley Stadium
LocationRaleigh, NC
SurfaceGrass
BroadcastACC Network
Division Standings
FBS — Atlantic Coast Conference
| Team | W | L | T | Pct | PF | PA | Home | Away | Strk |
|---|---|---|---|---|---|---|---|---|---|
 Pittsburgh | 6 | 4 | 0 | 0.600 | 297 | 194 | 5-2 | 1-2 | L1 |
 Miami | 9 | 1 | 0 | 0.900 | 441 | 198 | 5-0 | 4-1 | W1 |
 Clemson | 6 | 4 | 0 | 0.600 | 210 | 206 | 3-3 | 3-1 | L1 |
 Duke | 7 | 3 | 0 | 0.700 | 322 | 153 | 4-1 | 3-2 | L1 |
 SMU | 7 | 3 | 0 | 0.700 | 340 | 255 | 6-1 | 1-2 | L1 |
 Wake Forest | 9 | 1 | 0 | 0.900 | 439 | 150 | 4-1 | 5-0 | W7 |
 Florida State | 5 | 5 | 0 | 0.500 | 292 | 265 | 3-2 | 2-3 | W2 |
 Virginia | 5 | 5 | 0 | 0.500 | 269 | 215 | 5-2 | 0-3 | W1 |
 Virginia Tech | 6 | 4 | 0 | 0.600 | 330 | 255 | 3-2 | 3-2 | L2 |
| NC State | 4 | 6 | 0 | 0.400 | 291 | 282 | 4-3 | 0-3 | L2 |
 California | 3 | 7 | 0 | 0.300 | 204 | 320 | 2-3 | 1-4 | L4 |
| Louisville | 7 | 3 | 0 | 0.700 | 383 | 247 | 4-1 | 3-2 | W5 |
 Stanford | 5 | 5 | 0 | 0.500 | 223 | 358 | 4-1 | 1-4 | W1 |
 North Carolina | 5 | 5 | 0 | 0.500 | 258 | 221 | 1-4 | 4-1 | L1 |
 Georgia Tech | 3 | 7 | 0 | 0.300 | 235 | 296 | 2-4 | 1-3 | W1 |
 Syracuse | 5 | 5 | 0 | 0.500 | 298 | 260 | 2-3 | 3-2 | W1 |
 Boston College | 4 | 6 | 0 | 0.400 | 204 | 284 | 3-2 | 1-4 | L3 |
Louisville
3rd in ACC
VS
NC State
14th in ACC
Quarterbacks & Specialists
#91
Niall Hayes
#54
Drew Kegebein
#3
Lincoln Kienholz
Receivers & Backs
#1
Isaac Brown
#5
Keyjuan Brown
#2
TreyShun Hurry
#32
Braxton Jennings
#7
Lawayne McCoy
#85
Justyn Reid
Tre Richardson
#88
Jaleel Skinner
#14
Jackson Voth
Defensive Line & Linebackers
#93
Bailey Abercrombie
#11
T.J. Capers
#19
Micah Carter
#6
Stanquan Clark
#2
Demeco Kennedy
#50
Clev Lubin
#23
Benjamin Perry
#90
Daylen Russell
#99
Jerod Smith II
#3
Tyler Thompson
#96
Tommy Ziesmer
Defensive Backs
#4
TJ Banks
#10
Kaleb Beasley
#13
Tayon Holloway
#27
Myles Norwood
#25
Brycen Scott
#12
DJ Waller Jr.
Other
#35
Carson Hilbert
Quarterbacks & Specialists
#11
CJ Bailey
#96
Jackson Waller
#10
Will Wilson
Receivers & Backs
#19
Preston Douglas
#7
Davion Gause
#8
Keenan Jackson
#25
Darius Johnson
#86
Hunter Provience
#82
Chance Robinson
#1
Jayden Scott
Victor Snow
#2
Joshisa Trader
#13
Tyran Warren
Defensive Line & Linebackers
#13
Joseph Adedire
Popo Aguirre
#92
Chase Bond
#42
Ke'Von Carter
#5
Harvey Dyson III
#55
Katron Evans
#47
Adrian Farrow
#38
Logan Foust
#35
LaCorian Hodge
#33
Ziggy Moore
#44
Jordan Moreta
#8
Da'Kaari Nelson
#99
AJ Prim
#58
Elijah Satchell
#88
Isaiah Shirley
#30
Zane Williams
Defensive Backs
#29
Brody Barnhardt
#12
Caden Gordon
Jamel Johnson
#4
King Mack
#7
Brian Nelson II
#2
Ronnie Royal III
#14
Jaren Sensabaugh
#3
Tristan Teasdell
#22
Jackson Vick
Other
#94
Kanoah Vinesett
Louisville
3rd in ACC
VS
NC State
15th in ACC
Passing
68.9
Completion Percentage
63.1
188
Completions
200
1.10
Interception Percentage
1.60
3
Interceptions
5
69
Longest Pass
69
2,495
Net Passing Yards
2,391
249.5
Net Passing Yards Per Game
239.1
273
Passing Attempts
317
5.90
Passing Touchdown %
5.00
16
Passing Touchdowns
16
162.5
Passer Rating
139.6
15
Total Sacks
19
110
Sack Yards Lost
127
9.1
Yards Per Pass Attempt
7.5
2,495
Passing Yards
2,391
0
Passing Fumbles Lost
0
10
Team Games Played
10
469.5
Yards Per Game
389.6
38.3
Total Points Per Game
29.1
383
Total Points
291
49
Total Touchdowns
37
249.5
Passing Yards Per Game
239.1
188-273
Comp-Att
200-317
15-110
Sacks-Yards Lost
19-127
Rushing
357
Rushing Attempts
357
2,200
Rushing Yards
1,505
6.2
Yards Per Rush Attempt
4.2
97
Long Rushing
65
0
20+ Yard Rushing Plays
0
32
Rushing Touchdowns
21
220.0
Rushing Yards Per Game
150.5
0
Rushing Fumbles
0
0
Rushing Fumbles Lost
0
102
Rushing 1st downs
77
10
Team Games Played
10
4,695
Total Yards
3,896
645
Total Offensive Plays
693
38.3
Total Points Per Game
29.1
383
Total Points
291
49
Total Touchdowns
37
Receiving
188
Receptions
200
0
Receiving Targets
0
2,495
Receiving Yards
2,391
2,495
Receiving Yards
2,391
16
Receiving Touchdowns
16
69
Long Reception
69
0
20+ Yard Receiving Plays
0
249.5
Receiving Yards Per Game
239.1
0
Receiving Fumbles
0
0
Receiving Fumbles Lost
0
1299
Receiving Yards After Catch
1088
100
Receiving First Downs
106
10
Team Games Played
10
13.3
Yards Per Reception
12.0
38.3
Total Points Per Game
29.1
383
Total Points
291
49
Total Touchdowns
37
Miscellaneous
216
Total 1st downs
207
102
Rushing 1st downs
77
100
Passing 1st downs
106
14
1st downs by penalty
24
49
Third Down Conversions
67
113
Third Down Attempts
142
43.36
3rd down %
47.18
0
Fourth Down Conversions
9
5
First Downs Attempts
16
0.00
4th down %
56.25
71
Total Penalties
52
724
Total Penalty Yards
482
17323
Possession Time Seconds
18509
0.00
Red Zone Field Goal Percentage
0.00
0.00
Red Zone Scoring Percentage
0.00
0.00
Red Zone Efficiency Percentage
0.00
0.00
Red Zone Touchdown Percentage
0.00
9
Total Takeaways
11
8
Total Giveaways
12
1
Turnover Ratio
-1
0
Fumbles Lost
0
49-113
3rd down efficiency
67-142
0-5
4th down efficiency
9-16
71-724
Total-Yards
52-482
Defense
341
Solo Tackles
310
390
Assist Tackles
336
731
Total Tackles
646
29
Sacks
14
176
Sack Yards
98
65
Stuffs
72
46
Passes Defended
43
4.0
Average Interception Yards
-0.3
32
Long Interception
-1
0
Miscellaneous Touchdowns
0
1
Kicks Blocked
0
44
Tackles For Loss
31
10
Team Games Played
10
Defensive Interceptions
10
Interceptions
4
40
Interception Yards
-1
0
Interception Touchdowns
0
10-40
INT: Total
4--1
General
13
Fumbles
9
7
Forced Fumbles
6
6
Fumbles Recovered
6
1
Fumbles Touchdowns
0
10
Games Played
10
13-0
Fumbles-Lost
9-0
Returning
20
Kick Returns
14
399
Kick Return Yards
286
20.0
Yards Per Kick Return
20.4
71
Long Kick Return
32
0
Kick Return Touchdowns
0
12
Punt Returns
15
183
Punt Return Yards
134
15.3
Yards Per Punt Return
8.9
68
Long Punt Return
33
0
Punt Return Touchdowns
0
0
Punt Return Fair Catches
0
0
Kick Return Fumbles Lost
0
0
Punt Return Fumbles Lost
0
10
Team Games Played
10
12-183
Punt: Total
15-134
Kicking
14
Field Goal Made
10
19
Field Goal Attempts
12
73.7
Field Goal Percentage
83.3
54
Long Field Goal Made
46
0
Field Goal Attempts 1-19
0
3
Field Goal Attempts 20-29
5
5
Field Goal Attempts 30-39
2
8
Field Goal Attempts 40-49
4
3
Field Goal Attempts 50+
1
45
Extra Points Made
35
48
Extra Point Attempts
35
93.8
Extra Point Percentage
100.0
0
Field Goals Made 1-19
0
3
Field Goals Made 20-29
5
5
Field Goals Made 30-39
2
5
Field Goals Made 40-49
3
1
Field Goals Made 50+
0
87
Total Kicking Points
65
10
Team Games Played
10
86
Touchback Percentage
36
0.0
Average Kickoff Return Yards
0.0
0
Kickoff Return Yards
0
0
Kickoff Returns
0
0-0
Kickoffs: Total
0-0
14-19
FG: Good-Attempts
10-12
Punting
34
Punts
44
1,345
Punt Yards
1,908
59
Long Punt
62
39.6
Gross Average Punt Yards
43.4
39.6
Net Average Punt Yards
43.4
0
Punts Blocked
0
8
Punts Inside 20
16
1
Touchbacks
1
10
Fair Catches
24
9
Punt Returns
9
0
Punt Return Yards
0
0.0
Average Punt Return Yards
0.0
10
Team Games Played
10
34-1,345
Punt: Total Yards
44-1,908
Scoring
32
Rushing Touchdowns
21
16
Receiving Touchdowns
16
0
Return Touchdowns
0
49
Total Touchdowns
37
14
Field Goals
10
45
Kick Extra Points
35
1
Total Two Point Conversions
2
383
Total Points
291
38.3
Total Points Per Game
29.1