

LSU vs Ole Miss Live Score (19 Sep, 2026)
Score by Quarter
| Team | Q1 | Q2 | Q3 | Q4 | Final |
|---|---|---|---|---|---|
 LSU | 0 | 7 | 14 | 3 | 24 |
 Ole Miss | 10 | 14 | 0 | 8 | 32 |
Scoring Plays
Q1
6:38
6:38
Lucas Carneiro 37 Yd Field Goal
Field Goal Good
0 – 3
Q1
2:00
2:00
Kewan Lacy 5 Yd Run (Lucas Carneiro Kick)
Rushing Touchdown
0 – 10
Q2
9:49
9:49
Traylon Ray 21 Yd pass from Trinidad Chambliss (Lucas Carneiro Kick)
Passing Touchdown
0 – 17
Q2
1:57
1:57
Dilin Jones 2 Yd Run (Scott Starzyk Kick)
Rushing Touchdown
7 – 17
Q2
0:05
0:05
Deuce Alexander 20 Yd pass from Trinidad Chambliss (Lucas Carneiro Kick)
Passing Touchdown
7 – 24
Q3
9:18
9:18
Sam Leavitt 4 Yd Run (Scott Starzyk Kick)
Rushing Touchdown
14 – 24
Q3
3:05
3:05
Winston Watkins Jr. 26 Yd pass from Sam Leavitt (Scott Starzyk Kick)
Passing Touchdown
21 – 24
Q4
11:21
11:21
Scott Starzyk 23 Yd Field Goal
Field Goal Good
24 – 24
Q4
6:14
6:14
Trinidad Chambliss 14 Yd Run (JT Lindsey Run for Two-Point Conversion)
Rushing Touchdown
24 – 32
Game Leaders
LSUOle Miss
 S. Leavitt QB
Passing Yards
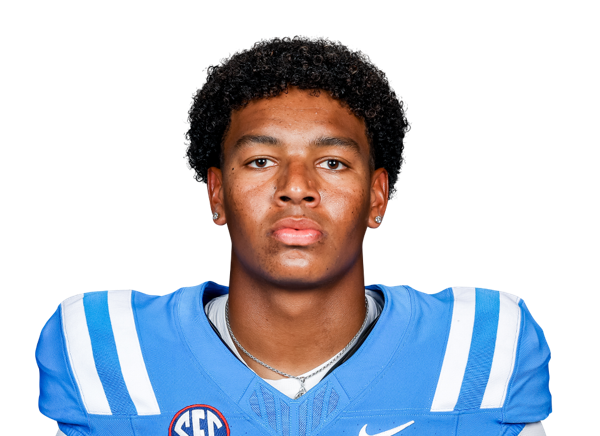 T. Chambliss QB
 D. Jones RB
Rushing Yards
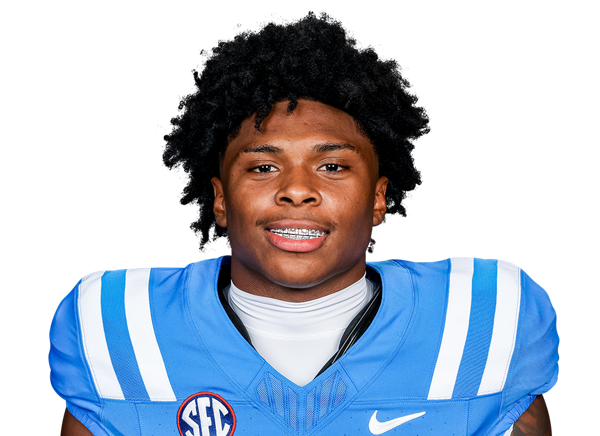 K. Lacy RB
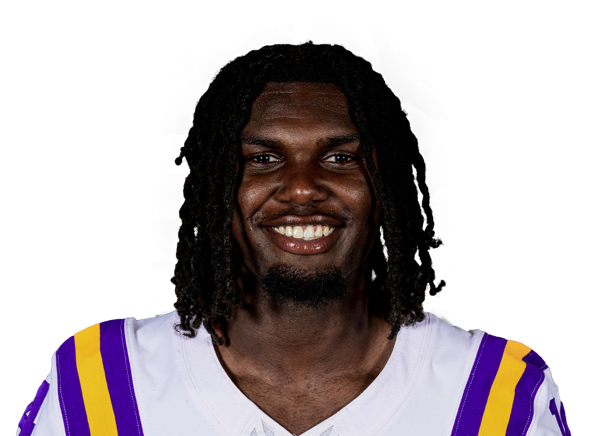 T. Green TE
Receiving Yards
 T. Ray WR
 P. Umanmielen DE
Sacks
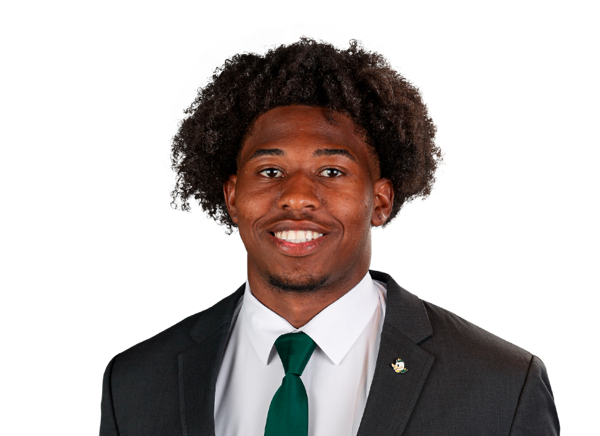 B. Purchase DE
 W. Weeks LB
Tackles
 S. Denson S
Player Box Score
LSU| Player | C/ATT | YDS | AVG | TD | INT | QBR |
|---|---|---|---|---|---|---|
| Sam Leavitt#10 | 16/27 | 158 | 5.9 | 1 | 1 | 86.5 |
Ole Miss| Player | C/ATT | YDS | AVG | TD | INT | QBR |
|---|---|---|---|---|---|---|
| Trinidad Chambliss#6 | 33/48 | 363 | 7.6 | 2 | 1 | 89.8 |
LSU| Player | CAR | YDS | AVG | TD | LONG |
|---|---|---|---|---|---|
| Dilin Jones#13 | 23 | 106 | 4.6 | 1 | 20 |
| Sam Leavitt#10 | 17 | 63 | 3.7 | 1 | 13 |
 Stacy Gage#23 | 3 | 3 | 1.0 | 0 | 2 |
Ole Miss| Player | CAR | YDS | AVG | TD | LONG |
|---|---|---|---|---|---|
| Kewan Lacy#5 | 9 | 43 | 4.8 | 1 | 22 |
 JT Lindsey#26 | 4 | 20 | 5.0 | 0 | 11 |
 Deuce Alexander#1 | 1 | 4 | 4.0 | 0 | 4 |
| Trinidad Chambliss#6 | 9 | 2 | 0.2 | 1 | 15 |
 Team | 2 | -6 | -3.0 | 0 | 0 |
LSU| Player | REC | YDS | AVG | TD | LONG |
|---|---|---|---|---|---|
| Trey'Dez Green#7 | 4 | 60 | 15.0 | 0 | 23 |
 Winston Watkins Jr.#6 | 3 | 54 | 18.0 | 1 | 26 |
 Jayce Brown#1 | 3 | 23 | 7.7 | 0 | 9 |
 Malik Elzy#88 | 1 | 6 | 6.0 | 0 | 6 |
| Dilin Jones#13 | 2 | 6 | 3.0 | 0 | 5 |
 Jackson Harris#4 | 1 | 5 | 5.0 | 0 | 5 |
 Eugene Wilson III#3 | 2 | 4 | 2.0 | 0 | 5 |
Ole Miss| Player | REC | YDS | AVG | TD | LONG |
|---|---|---|---|---|---|
| Traylon Ray#7 | 7 | 115 | 16.4 | 1 | 36 |
 Caleb Odom#4 | 5 | 88 | 17.6 | 0 | 30 |
| Deuce Alexander#1 | 7 | 60 | 8.6 | 1 | 20 |
 Horatio Fields#11 | 5 | 52 | 10.4 | 0 | 22 |
 Luke Hasz#9 | 3 | 15 | 5.0 | 0 | 6 |
 Johntay Cook II | 1 | 14 | 14.0 | 0 | 14 |
 Michael Smith#82 | 2 | 13 | 6.5 | 0 | 7 |
| JT Lindsey#26 | 1 | 8 | 8.0 | 0 | 8 |
| Kewan Lacy#5 | 2 | -2 | -1.0 | 0 | 2 |
LSU| Player | TOT | SOLO | SACKS | TFL | PD | QB HUR | TD |
|---|---|---|---|---|---|---|---|
| Whit Weeks#7 | 8 | 5 | 0 | 1 | 1 | 1 | 0 |
 PJ Woodland#11 | 8 | 4 | 0 | 0 | 1 | 0 | 0 |
 DJ Pickett#5 | 7 | 7 | 0 | 0 | 0 | 0 | 0 |
 Ty Benefield#2 | 5 | 4 | 1 | 1 | 0 | 1 | 0 |
 Jhase Thomas#28 | 5 | 4 | 0 | 0 | 0 | 0 | 0 |
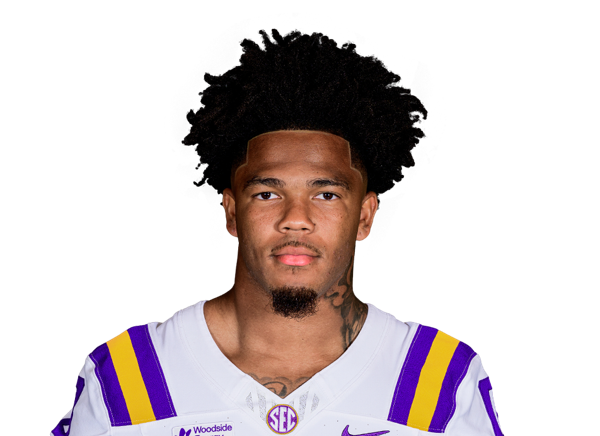 Tamarcus Cooley | 5 | 3 | 0 | 0 | 1 | 0 | 0 |
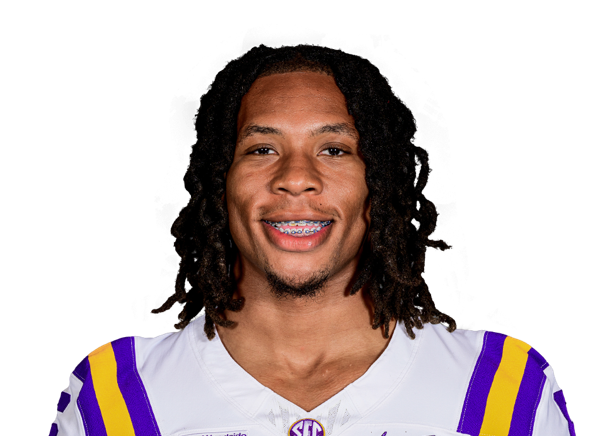 TJ Dottery#6 | 5 | 2 | 0 | 0 | 0 | 2 | 0 |
| Princewill Umanmielen#1 | 4 | 1 | 1 | 1 | 0 | 0 | 0 |
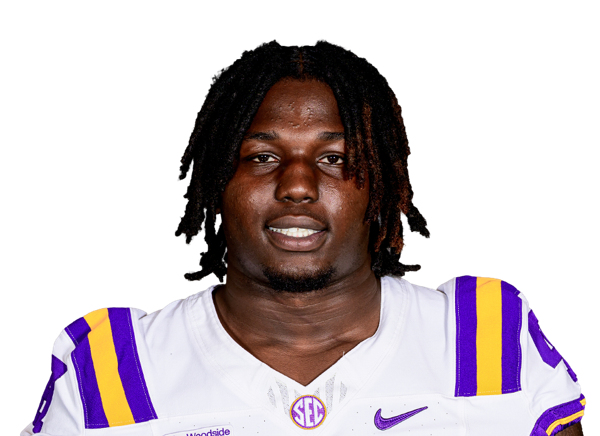 Malik Blocton#47 | 2 | 2 | 0 | 0 | 0 | 0 | 0 |
 Stephiylan Green#90 | 2 | 1 | 0 | 0 | 0 | 1 | 0 |
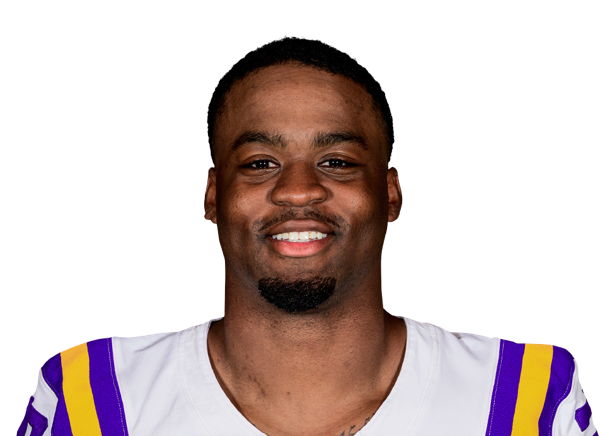 Jordan Ross#29 | 2 | 1 | 0 | 0 | 0 | 1 | 0 |
 CJ Jimcoily#31 | 2 | 0 | 0 | 0 | 0 | 1 | 0 |
 Shone Washington#95 | 1 | 1 | 0 | 0 | 0 | 0 | 0 |
 Ja'Keem Jackson#8 | 1 | 1 | 0 | 0 | 0 | 0 | 0 |
 Deuce Geralds#99 | 1 | 1 | 0 | 0 | 0 | 1 | 0 |
 Davhon Keys#42 | 1 | 0 | 0 | 0 | 0 | 0 | 0 |
Ole Miss| Player | TOT | SOLO | SACKS | TFL | PD | QB HUR | TD |
|---|---|---|---|---|---|---|---|
| Sharif Denson#7 | 8 | 7 | 0 | 1 | 0 | 1 | 0 |
 Tah'j Butler#49 | 8 | 7 | 0 | 0 | 0 | 1 | 0 |
 Luke Ferrelli#12 | 6 | 5 | 0 | 0 | 1 | 0 | 0 |
 Will Echoles#52 | 5 | 4 | 1 | 3 | 0 | 1 | 0 |
| Blake Purchase#3 | 5 | 2 | 1 | 1 | 0 | 1 | 0 |
 Joenel Aguero#6 | 4 | 3 | 0 | 0 | 0 | 0 | 0 |
 Edwin Joseph#14 | 4 | 3 | 0 | 0 | 1 | 0 | 0 |
 Keaton Thomas#11 | 4 | 3 | 0 | 1 | 0 | 2 | 0 |
 Suntarine Perkins#4 | 4 | 2 | 0 | 0 | 1 | 0 | 0 |
 Antonio Kite#8 | 3 | 2 | 0 | 0 | 0 | 0 | 0 |
 Kam Franklin#5 | 3 | 2 | 0 | 1 | 1 | 0 | 0 |
 Jaylon Braxton#2 | 2 | 2 | 0 | 0 | 0 | 1 | 0 |
 Andy Jaffe#24 | 2 | 1 | 0 | 0 | 0 | 0 | 0 |
 Michai Boireau#88 | 2 | 1 | 0 | 0 | 0 | 0 | 0 |
 Jordan Renaud#1 | 1 | 1 | 0 | 1 | 0 | 0 | 0 |
 Nick Cull#29 | 1 | 1 | 0 | 0 | 0 | 0 | 0 |
 Jonathan Maldonado#17 | 1 | 1 | 0 | 0 | 0 | 0 | 0 |
| Kewan Lacy#5 | 1 | 1 | 0 | 0 | 0 | 0 | 0 |
 Craig Tutt#35 | 1 | 1 | 0 | 0 | 0 | 0 | 0 |
Ole Miss| Player | FUM | LOST | REC |
|---|---|---|---|
| Trinidad Chambliss#6 | 1 | 0 | 0 |
LSU| Player | FG | PCT | LONG | XP | PTS |
|---|---|---|---|---|---|
 Scott Starzyk#80 | 1/1 | 100.0 | 23 | 3/3 | 6 |
Ole Miss| Player | FG | PCT | LONG | XP | PTS |
|---|---|---|---|---|---|
 Lucas Carneiro#17 | 1/2 | 50.0 | 37 | 3/3 | 6 |
LSU| Player | NO | YDS | AVG | TB | In 20 | LONG |
|---|---|---|---|---|---|---|
 Grant Chadwick#90 | 4 | 139 | 34.8 | 0 | 1 | 49 |
Ole Miss| Player | NO | YDS | AVG | TB | In 20 | LONG |
|---|---|---|---|---|---|---|
 Oscar Bird#33 | 2 | 84 | 42.0 | 0 | 0 | 49 |
LSU| Player | NO | YDS | AVG | LONG | TD |
|---|---|---|---|---|---|
 Harlem Berry#22 | 1 | 20 | 20.0 | 20 | 0 |
Ole Miss| Player | NO | YDS | AVG | LONG | TD |
|---|---|---|---|---|---|
| Deuce Alexander#1 | 1 | 0 | 0.0 | 0 | 0 |
LSU| Player | INT | YDS | TD |
|---|---|---|---|
| Ja'Keem Jackson#8 | 1 | 10 | 0 |
Ole Miss| Player | INT | YDS | TD |
|---|---|---|---|
| Jaylon Braxton#2 | 1 | 0 | 0 |
Drive Summary
MISS
Punt
-13
LSU
Punt
-5
MISS
Field Goal
59
LSU
Punt
8
MISS
Touchdown
78
LSU
Punt
28
MISS
Touchdown
92
LSU
Touchdown
75
MISS
Touchdown
75
LSU
End of Half
8
LSU
Punt
-3
MISS
Interception
4
LSU
Touchdown
33
MISS
Missed FG
39
LSU
Touchdown
64
MISS
Punt
5
LSU
Field Goal
55
MISS
Touchdown
75
LSU
Interception
69
MISS
End of Game
-16
Injury Report
No current injury report is available for this matchup.
Head-to-Head
Historical meetings are not available for this matchup.
Game Information
StageWeek 3
Season2026
KickoffSat, Sep 19, 7:30 pm
VenueVaught-Hemingway Stadium
LocationOxford, MS
SurfaceGrass
BroadcastABC
Attendance70,033
Division Standings
FBS — Southeastern Conference
| Team | W | L | T | Pct | PF | PA | Home | Away | Strk |
|---|---|---|---|---|---|---|---|---|---|
 Alabama | 6 | 2 | 0 | 0.750 | 306 | 170 | 4-1 | 2-1 | W1 |
 Florida | 5 | 3 | 0 | 0.625 | 285 | 225 | 3-1 | 2-2 | L1 |
 Georgia | 7 | 1 | 0 | 0.875 | 328 | 119 | 5-1 | 2-0 | W1 |
 Mississippi State | 4 | 4 | 0 | 0.500 | 213 | 225 | 2-2 | 2-2 | L4 |
| Ole Miss | 6 | 2 | 0 | 0.750 | 297 | 192 | 5-0 | 1-2 | W1 |
 Kentucky | 7 | 1 | 0 | 0.875 | 263 | 198 | 4-1 | 3-0 | W6 |
 Missouri | 6 | 2 | 0 | 0.750 | 252 | 147 | 4-0 | 2-2 | W1 |
 Tennessee | 6 | 2 | 0 | 0.750 | 258 | 130 | 4-1 | 2-1 | L1 |
 Texas | 6 | 2 | 0 | 0.750 | 246 | 137 | 5-1 | 1-1 | W2 |
 Vanderbilt | 3 | 5 | 0 | 0.375 | 182 | 242 | 3-2 | 0-3 | L5 |
 Oklahoma | 4 | 4 | 0 | 0.500 | 176 | 166 | 3-2 | 1-2 | L1 |
 Auburn | 4 | 4 | 0 | 0.500 | 193 | 214 | 3-2 | 1-2 | L2 |
| LSU | 6 | 2 | 0 | 0.750 | 321 | 128 | 5-0 | 1-2 | W2 |
 South Carolina | 5 | 3 | 0 | 0.625 | 295 | 202 | 3-2 | 2-1 | W3 |
 Texas A&M | 4 | 4 | 0 | 0.500 | 226 | 151 | 4-1 | 0-3 | L1 |
 Arkansas | 3 | 5 | 0 | 0.375 | 157 | 221 | 2-3 | 1-2 | L1 |
LSU
6th in SEC
VS
Ole Miss
4th in SEC
Quarterbacks & Specialists
#90
Grant Chadwick
#10
Sam Leavitt
Receivers & Backs
#22
Harlem Berry
#1
Jayce Brown
#88
Malik Elzy
#23
Stacy Gage
#7
Trey'Dez Green
#4
Jackson Harris
#13
Dilin Jones
#6
Winston Watkins Jr.
#3
Eugene Wilson III
Defensive Line & Linebackers
#47
Malik Blocton
#6
TJ Dottery
#99
Deuce Geralds
#90
Stephiylan Green
#31
CJ Jimcoily
#42
Davhon Keys
#29
Jordan Ross
#1
Princewill Umanmielen
#95
Shone Washington
#7
Whit Weeks
Defensive Backs
#2
Ty Benefield
Tamarcus Cooley
#8
Ja'Keem Jackson
#5
DJ Pickett
#28
Jhase Thomas
#11
PJ Woodland
Other
#80
Scott Starzyk
Quarterbacks & Specialists
#33
Oscar Bird
#6
Trinidad Chambliss
Receivers & Backs
#1
Deuce Alexander
Johntay Cook II
#11
Horatio Fields
#9
Luke Hasz
#5
Kewan Lacy
#26
JT Lindsey
#4
Caleb Odom
#7
Traylon Ray
#82
Michael Smith
Defensive Line & Linebackers
#88
Michai Boireau
#49
Tah'j Butler
#52
Will Echoles
#12
Luke Ferrelli
#5
Kam Franklin
#17
Jonathan Maldonado
#4
Suntarine Perkins
#3
Blake Purchase
#1
Jordan Renaud
#11
Keaton Thomas
Defensive Backs
#6
Joenel Aguero
#2
Jaylon Braxton
#29
Nick Cull
#7
Sharif Denson
#24
Andy Jaffe
#14
Edwin Joseph
#8
Antonio Kite
#35
Craig Tutt
Other
#17
Lucas Carneiro
LSU
4th in SEC
VS
Ole Miss
4th in SEC
Passing
67.6
Completion Percentage
63.1
202
Completions
171
2.70
Interception Percentage
3.00
8
Interceptions
8
70
Longest Pass
62
2,544
Net Passing Yards
1,994
318.0
Net Passing Yards Per Game
284.9
299
Passing Attempts
271
6.40
Passing Touchdown %
5.90
19
Passing Touchdowns
16
154.6
Passer Rating
138.7
13
Total Sacks
5
76
Sack Yards Lost
34
8.5
Yards Per Pass Attempt
7.4
2,544
Passing Yards
1,994
0
Passing Fumbles Lost
0
8
Team Games Played
7
510.0
Yards Per Game
432.9
40.1
Total Points Per Game
36.0
321
Total Points
252
42
Total Touchdowns
31
318.0
Passing Yards Per Game
284.9
202-299
Comp-Att
171-271
13-76
Sacks-Yards Lost
5-34
Rushing
336
Rushing Attempts
220
1,536
Rushing Yards
1,036
4.6
Yards Per Rush Attempt
4.7
46
Long Rushing
35
0
20+ Yard Rushing Plays
0
22
Rushing Touchdowns
13
192.0
Rushing Yards Per Game
148.0
0
Rushing Fumbles
0
0
Rushing Fumbles Lost
0
93
Rushing 1st downs
64
8
Team Games Played
7
4,080
Total Yards
3,030
648
Total Offensive Plays
496
40.1
Total Points Per Game
36.0
321
Total Points
252
42
Total Touchdowns
31
Receiving
202
Receptions
171
0
Receiving Targets
0
2,544
Receiving Yards
1,994
2,544
Receiving Yards
1,994
19
Receiving Touchdowns
16
70
Long Reception
62
0
20+ Yard Receiving Plays
0
318.0
Receiving Yards Per Game
284.9
0
Receiving Fumbles
0
0
Receiving Fumbles Lost
0
1320
Receiving Yards After Catch
828
120
Receiving First Downs
90
8
Team Games Played
7
12.6
Yards Per Reception
11.7
40.1
Total Points Per Game
36.0
321
Total Points
252
42
Total Touchdowns
31
Miscellaneous
224
Total 1st downs
171
93
Rushing 1st downs
64
120
Passing 1st downs
90
11
1st downs by penalty
17
61
Third Down Conversions
40
118
Third Down Attempts
90
51.69
3rd down %
44.44
13
Fourth Down Conversions
5
16
First Downs Attempts
8
81.25
4th down %
62.50
48
Total Penalties
55
386
Total Penalty Yards
441
15759
Possession Time Seconds
11100
0.00
Red Zone Field Goal Percentage
0.00
0.00
Red Zone Scoring Percentage
0.00
0.00
Red Zone Efficiency Percentage
0.00
0.00
Red Zone Touchdown Percentage
0.00
10
Total Takeaways
11
11
Total Giveaways
11
-1
Turnover Ratio
0
0
Fumbles Lost
0
61-118
3rd down efficiency
40-90
13-16
4th down efficiency
5-8
48-386
Total-Yards
55-441
Defense
248
Solo Tackles
268
250
Assist Tackles
224
498
Total Tackles
492
34
Sacks
13
209
Sack Yards
99
83
Stuffs
70
33
Passes Defended
23
14.7
Average Interception Yards
6.1
32
Long Interception
38
0
Miscellaneous Touchdowns
0
0
Kicks Blocked
1
51
Tackles For Loss
33
8
Team Games Played
7
Defensive Interceptions
7
Interceptions
7
103
Interception Yards
43
1
Interception Touchdowns
0
7-103
INT: Total
7-43
General
9
Fumbles
8
5
Forced Fumbles
3
2
Fumbles Recovered
3
0
Fumbles Touchdowns
2
8
Games Played
7
9-0
Fumbles-Lost
8-0
Returning
4
Kick Returns
8
75
Kick Return Yards
143
18.8
Yards Per Kick Return
17.9
20
Long Kick Return
26
0
Kick Return Touchdowns
0
6
Punt Returns
7
59
Punt Return Yards
65
9.8
Yards Per Punt Return
9.3
27
Long Punt Return
20
0
Punt Return Touchdowns
0
0
Punt Return Fair Catches
0
0
Kick Return Fumbles Lost
0
0
Punt Return Fumbles Lost
0
8
Team Games Played
7
6-59
Punt: Total
7-65
Kicking
9
Field Goal Made
11
11
Field Goal Attempts
14
81.8
Field Goal Percentage
78.6
49
Long Field Goal Made
57
0
Field Goal Attempts 1-19
0
8
Field Goal Attempts 20-29
0
1
Field Goal Attempts 30-39
4
2
Field Goal Attempts 40-49
7
0
Field Goal Attempts 50+
3
40
Extra Points Made
29
40
Extra Point Attempts
29
100.0
Extra Point Percentage
100.0
0
Field Goals Made 1-19
0
7
Field Goals Made 20-29
0
1
Field Goals Made 30-39
4
1
Field Goals Made 40-49
6
0
Field Goals Made 50+
1
67
Total Kicking Points
62
8
Team Games Played
7
82
Touchback Percentage
65
0.0
Average Kickoff Return Yards
0.0
0
Kickoff Return Yards
0
0
Kickoff Returns
0
0-0
Kickoffs: Total
0-0
9-11
FG: Good-Attempts
11-14
Punting
25
Punts
25
992
Punt Yards
1,146
52
Long Punt
60
39.7
Gross Average Punt Yards
45.8
39.7
Net Average Punt Yards
45.8
0
Punts Blocked
0
8
Punts Inside 20
7
0
Touchbacks
1
8
Fair Catches
9
10
Punt Returns
7
0
Punt Return Yards
0
0.0
Average Punt Return Yards
0.0
8
Team Games Played
7
25-992
Punt: Total Yards
25-1,146
Scoring
22
Rushing Touchdowns
13
19
Receiving Touchdowns
16
0
Return Touchdowns
0
41
Total Touchdowns
31
9
Field Goals
11
40
Kick Extra Points
29
1
Total Two Point Conversions
2
321
Total Points
252
40.1
Total Points Per Game
36.0