

Massachusetts vs Buffalo Live Score (17 Oct, 2026)
Score by Quarter
| Team | Q1 | Q2 | Q3 | Q4 | OT | Final |
|---|---|---|---|---|---|---|
 Massachusetts |
7 | 8 | 0 | 3 | 0 | 18 |
 Buffalo |
3 | 5 | 7 | 3 | 7 | 25 |
Scoring Plays
Q1
10:08
10:08
L. Inagawa run for 20 yds, for a TD (D. Morris KICK)
Rushing Touchdown
7 – 0
Q1
7:26
7:26
O. Hautanen 26 yd FG GOOD
Field Goal Good
7 – 3
Q2
9:06
9:06
L. Inagawa sacked by S. Vessah for 0 yds for a SAFETY
Safety
7 – 5
Q2
4:40
4:40
O. Hautanen 33 yd FG GOOD
Field Goal Good
7 – 8
Q2
1:32
1:32
E. Faulkner run for 2 yds, for a TD (L. Inagawa pass to Ja. Lewis GOOD for Two-Point Conversion)
Rushing Touchdown
15 – 8
Q3
10:47
10:47
J. Wright pass to C. Walker for 2 yds, for a TD (O. Hautanen KICK)
Passing Touchdown
15 – 15
Q4
1:57
1:57
D. Morris 53 yd FG GOOD
Field Goal Good
18 – 15
Q4
0:02
0:02
O. Hautanen 29 yd FG GOOD
Field Goal Good
18 – 18
OT
0:00
0:00
J. Wright pass to C. Walker for 15 yds, for a TD (O. Hautanen PAT MISSED) (O. Hautanen PAT MISSED), Massachusetts Penalty, offside (JC Clark) (O. Haut
Passing Touchdown
18 – 25
Game Leaders
MassachusettsBuffalo
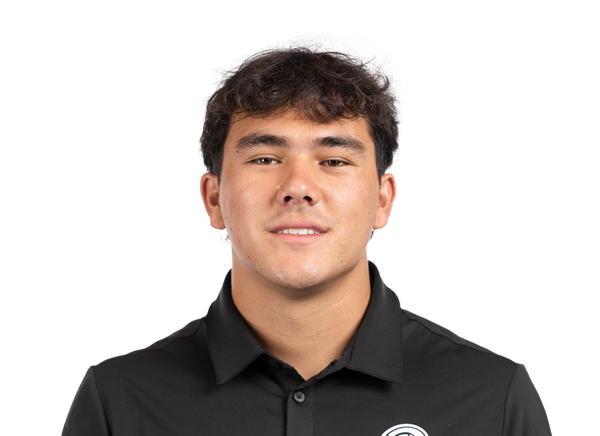 L. Inagawa QB
Passing Yards
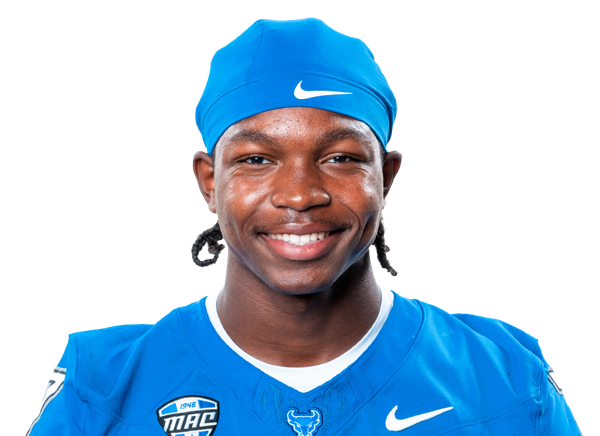 J. Wright QB
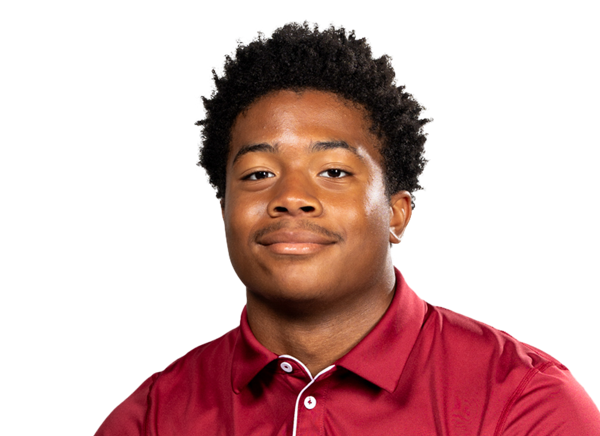 E. Faulkner RB
Rushing Yards
 M. Burch RB
 K. Dia-Johnson WR
Receiving Yards
 C. Walker TE
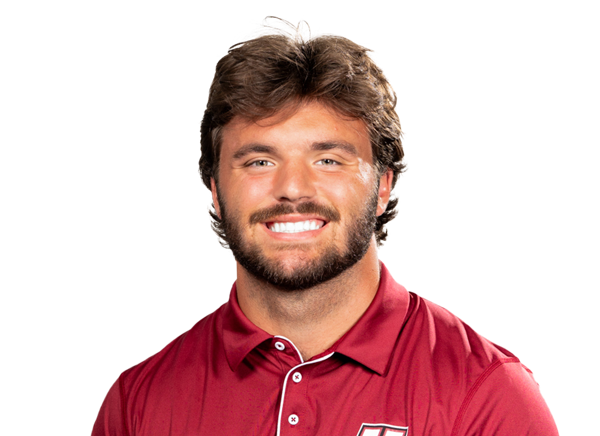 T. Hinspeter LB
Sacks
 R. Stinchcomb DLT. Hinspeter LB
Tackles
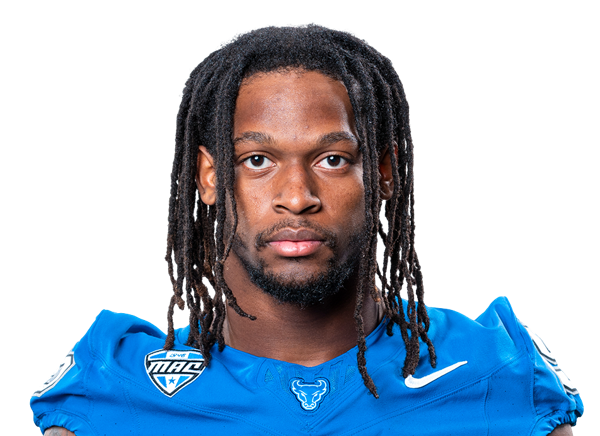 S. Brown LB
Player Box Score
Massachusetts| Player | C/ATT | YDS | AVG | TD | INT |
|---|---|---|---|---|---|
| Logan Inagawa#16 | 14/25 | 168 | 6.7 | 0 | 1 |
Buffalo| Player | C/ATT | YDS | AVG | TD | INT |
|---|---|---|---|---|---|
| Jason Wright#7 | 16/35 | 134 | 3.8 | 2 | 1 |
Massachusetts| Player | CAR | YDS | AVG | TD | LONG |
|---|---|---|---|---|---|
| Elijah Faulkner#23 | 23 | 84 | 3.7 | 1 | 26 |
| Logan Inagawa#16 | 19 | 66 | 3.5 | 1 | 20 |
| Kezion Dia-Johnson#8 | 2 | 10 | 5.0 | 0 | 8 |
| Tavian Dashiell#15 | 1 | 4 | 4.0 | 0 | 4 |
| Curtis Kimmons IV#14 | 1 | 4 | 4.0 | 0 | 4 |
 Justin Williams-Thomas#6 | 1 | 3 | 3.0 | 0 | 3 |
Buffalo| Player | CAR | YDS | AVG | TD | LONG |
|---|---|---|---|---|---|
| Messiah Burch#4 | 28 | 172 | 6.1 | 0 | 46 |
 Nino Hill | 6 | 22 | 3.7 | 0 | 8 |
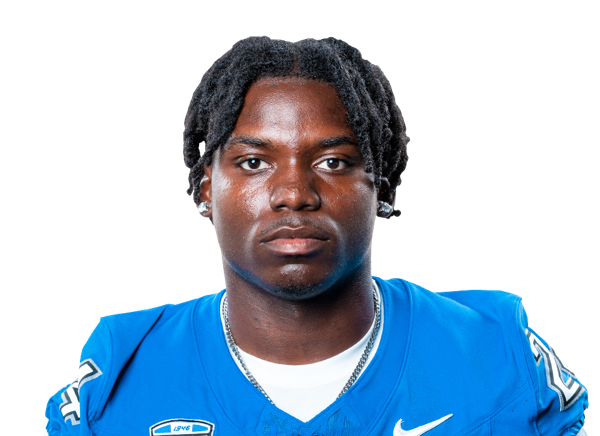 James McNeil Jr.#24 | 4 | 15 | 3.8 | 0 | 8 |
| Jason Wright#7 | 5 | 13 | 2.6 | 0 | 13 |
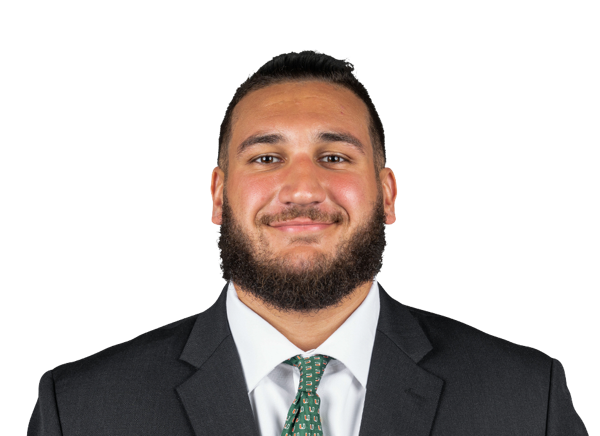 Nino Francavilla#74 | 1 | -5 | -5.0 | 0 | 0 |
Massachusetts| Player | REC | YDS | AVG | TD | LONG |
|---|---|---|---|---|---|
| Kezion Dia-Johnson#8 | 5 | 79 | 15.8 | 0 | 37 |
| Jabari Lewis#19 | 3 | 33 | 11.0 | 0 | 21 |
 Reece Adkins#83 | 2 | 31 | 15.5 | 0 | 17 |
| Elijah Faulkner#23 | 2 | 15 | 7.5 | 0 | 11 |
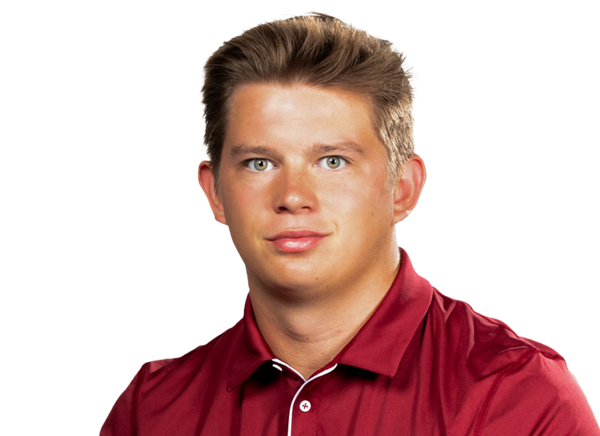 Max Dowling#11 | 2 | 10 | 5.0 | 0 | 5 |
Buffalo| Player | REC | YDS | AVG | TD | LONG |
|---|---|---|---|---|---|
| Clint Walker#5 | 7 | 45 | 6.4 | 2 | 15 |
| Dwayne Early Jr.#11 | 3 | 33 | 11.0 | 0 | 16 |
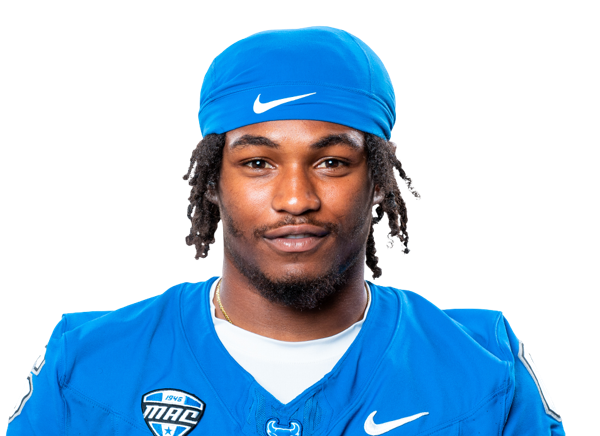 Chance Morrow#6 | 3 | 27 | 9.0 | 0 | 19 |
| Jaylen Andrews#2 | 2 | 24 | 12.0 | 0 | 17 |
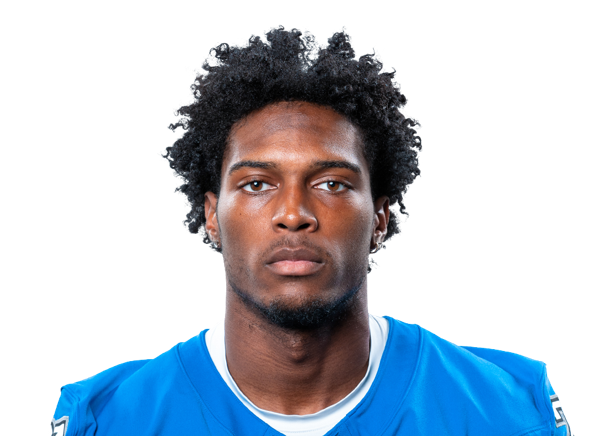 Patrick Clacks III#3 | 1 | 5 | 5.0 | 0 | 5 |
Massachusetts| Player | TOT | SOLO | SACKS | TFL | PD | QB HUR | TD |
|---|---|---|---|---|---|---|---|
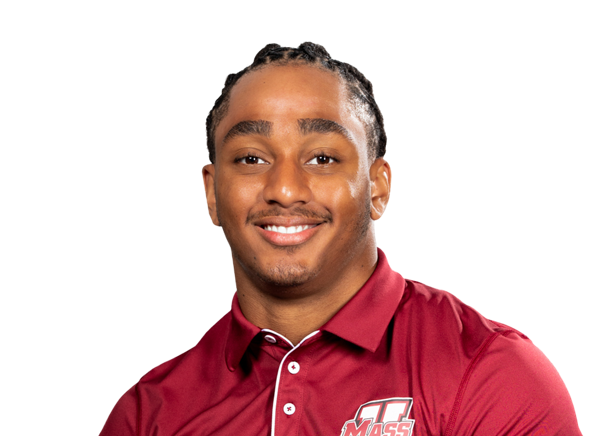 Kendall Bournes#3 | 8 | 5 | 0 | 0 | 0 | 0 | 0 |
| Timmy Hinspeter#44 | 8 | 1 | 0.5 | 0.5 | 0 | 0 | 0 |
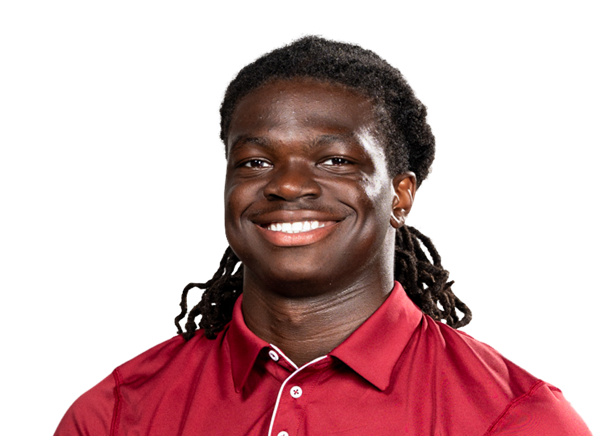 Zeraun Daniel#38 | 7 | 6 | 0 | 0 | 1 | 0 | 0 |
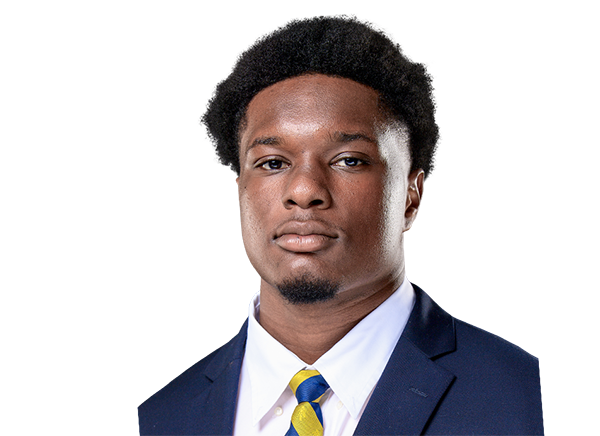 Joshua Iseah#6 | 7 | 4 | 0.5 | 0.5 | 0 | 0 | 0 |
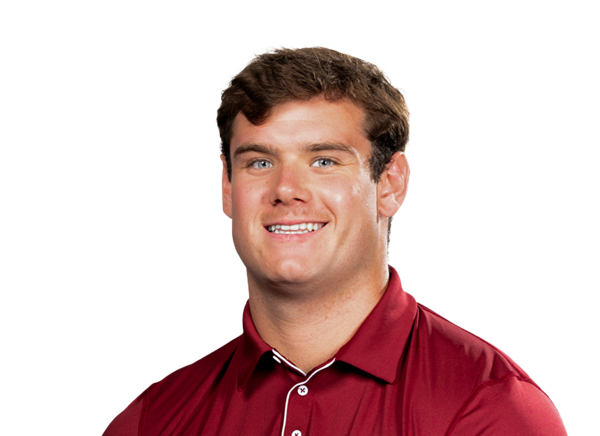 Tyler Martin#5 | 6 | 3 | 0 | 0 | 0 | 0 | 0 |
 TJ Magee#7 | 5 | 4 | 0 | 0 | 3 | 0 | 0 |
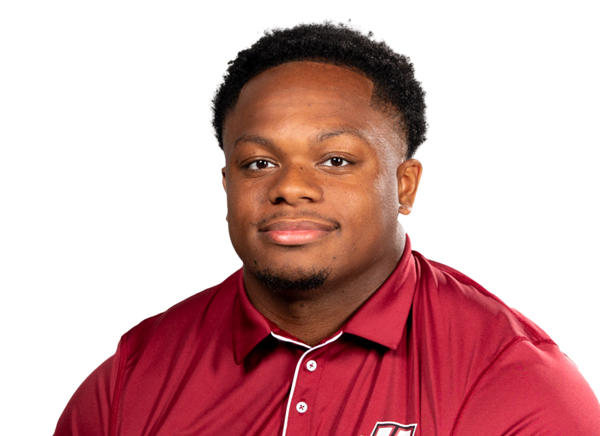 Tim Passmore Jr.#90 | 5 | 2 | 0 | 0 | 0 | 0 | 0 |
 Aubrey Melvin#10 | 4 | 3 | 0 | 0 | 0 | 0 | 0 |
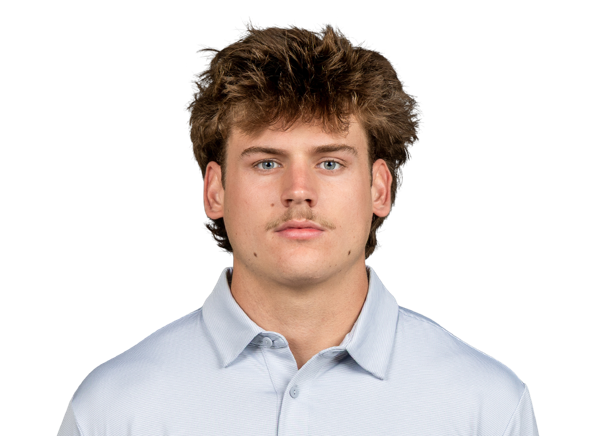 Justin Krueger#9 | 3 | 3 | 0 | 0 | 0 | 0 | 0 |
 Khari Bendolph#15 | 3 | 3 | 0 | 0 | 0 | 0 | 0 |
 Joshua Nobles#2 | 3 | 2 | 0 | 0 | 0 | 0 | 0 |
| Romando Johnson#92 | 3 | 1 | 0.5 | 0.5 | 0 | 0 | 0 |
| Zakar Morris#55 | 3 | 0 | 0.5 | 0.5 | 0 | 0 | 0 |
 DD Snyder#1 | 2 | 2 | 0 | 0 | 0 | 0 | 0 |
 Isaiah Reed | 2 | 2 | 0 | 0 | 2 | 0 | 0 |
 Jahmad Harmon#22 | 2 | 2 | 0 | 0 | 2 | 0 | 0 |
 David Timson#36 | 1 | 1 | 0 | 0 | 0 | 0 | 0 |
Buffalo| Player | TOT | SOLO | SACKS | TFL | PD | QB HUR | TD |
|---|---|---|---|---|---|---|---|
| SaVeon Brown#1 | 10 | 6 | 0 | 0.5 | 0 | 0 | 0 |
 Miles Greer#6 | 7 | 5 | 1 | 1 | 0 | 0 | 0 |
 Jordan Owens#33 | 7 | 5 | 0 | 0 | 0 | 1 | 0 |
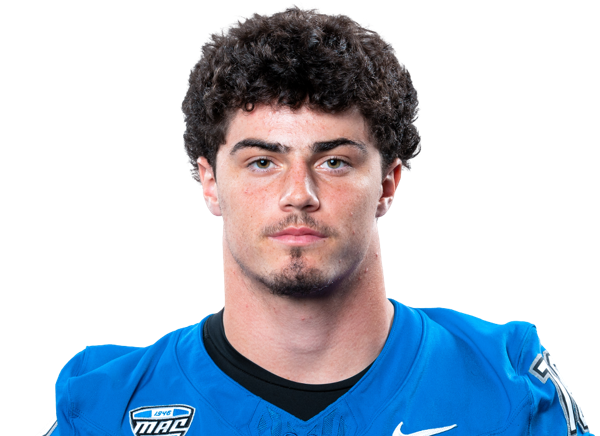 John Keough#7 | 7 | 5 | 0 | 0 | 0 | 0 | 0 |
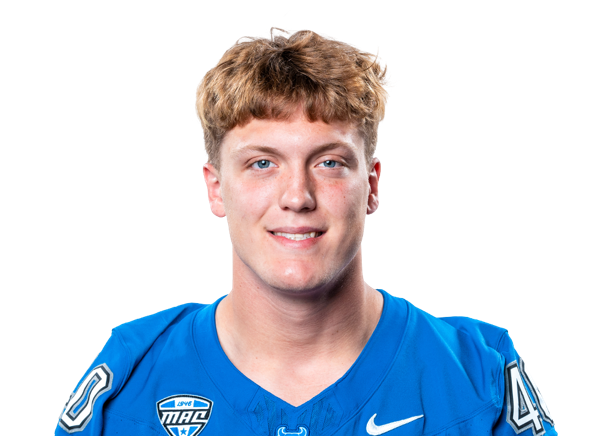 Will Clark#11 | 6 | 5 | 0 | 0 | 1 | 0 | 0 |
 Christopher Climes#97 | 6 | 4 | 0 | 1 | 1 | 0 | 0 |
| Rex Stinchcomb#88 | 5 | 3 | 1 | 1 | 0 | 0 | 0 |
 Stevie Bracey#2 | 5 | 3 | 0 | 0 | 0 | 0 | 0 |
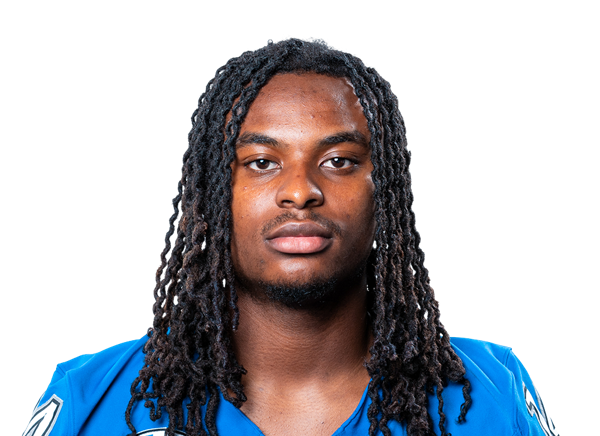 Mikey Crawford#5 | 5 | 3 | 0 | 0 | 1 | 0 | 0 |
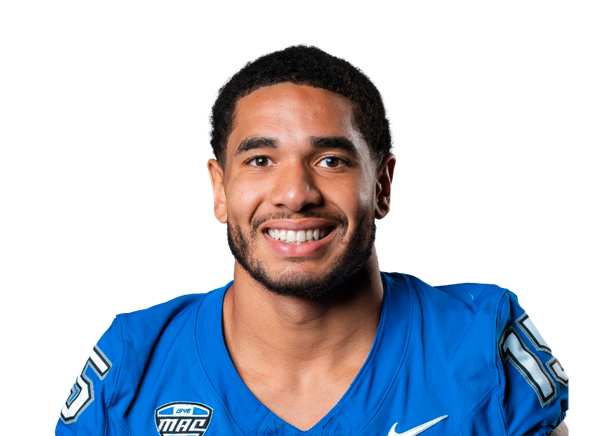 Sedrick Vessah#15 | 4 | 2 | 1 | 1 | 1 | 1 | 0 |
| Logan Goodwin#17 | 3 | 2 | 0 | 0 | 0 | 0 | 0 |
 Caleb Oliver#16 | 2 | 2 | 0 | 1 | 0 | 0 | 0 |
| Clint Walker#5 | 1 | 1 | 0 | 0 | 0 | 0 | 0 |
 Cornell Evans#99 | 1 | 0 | 0 | 0.5 | 0 | 0 | 0 |
 Kobi Blackwell | 1 | 0 | 0 | 0 | 0 | 0 | 0 |
| Dylan Cleary#38 | 0 | 0 | 0 | 0 | 1 | 0 | 0 |
Massachusetts| Player | FUM | LOST | REC |
|---|---|---|---|
| Logan Inagawa#16 | 2 | 0 | 0 |
| Drew Alsup#85 | 1 | 1 | 0 |
| TJ Magee#7 | 0 | 0 | 1 |
Buffalo| Player | FUM | LOST | REC |
|---|---|---|---|
| Miles Greer#6 | 1 | 1 | 0 |
| Nino Francavilla#74 | 1 | 0 | 0 |
 Joseph Stoever#48 | 0 | 0 | 1 |
Massachusetts| Player | FG | PCT | LONG | XP | PTS |
|---|---|---|---|---|---|
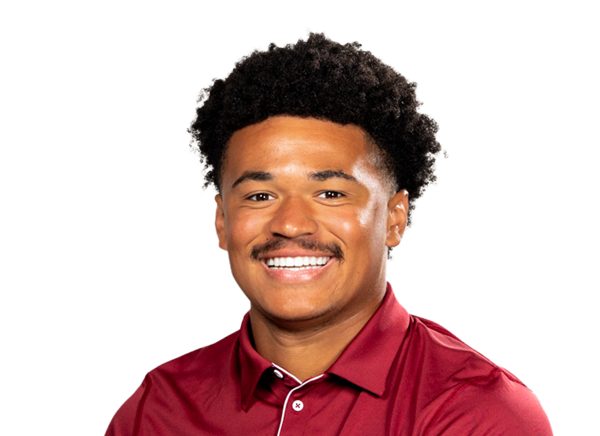 Derek Morris#99 | 1/3 | 33.3 | 53 | 1/1 | 4 |
Buffalo| Player | FG | PCT | LONG | XP | PTS |
|---|---|---|---|---|---|
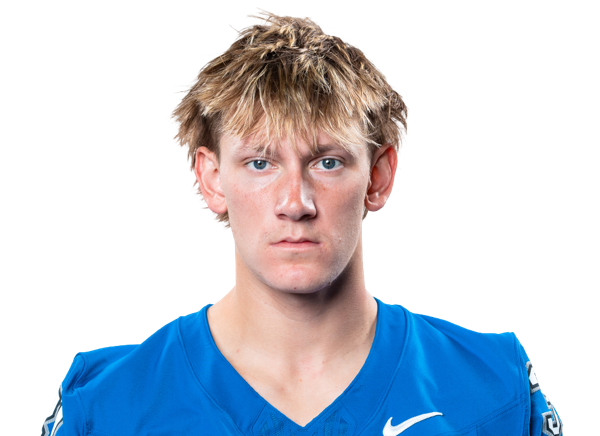 Oliver Hautanen#31 | 3/3 | 100.0 | 33 | 2/2 | 11 |
Massachusetts| Player | NO | YDS | AVG | TB | In 20 | LONG |
|---|---|---|---|---|---|---|
 Edward Phillipson#43 | 5 | 167 | 33.4 | 0 | 3 | 44 |
Buffalo| Player | NO | YDS | AVG | TB | In 20 | LONG |
|---|---|---|---|---|---|---|
 Ethan Stumpf#90 | 7 | 271 | 38.7 | 1 | 5 | 49 |
Buffalo| Player | NO | YDS | AVG | LONG | TD |
|---|---|---|---|---|---|
 Phillip Folmar#1 | 2 | 96 | 48.0 | 71 | 0 |
Massachusetts| Player | NO | YDS | AVG | LONG | TD |
|---|---|---|---|---|---|
| Drew Alsup#85 | 1 | 0 | 0.0 | 0 | 0 |
Buffalo| Player | NO | YDS | AVG | LONG | TD |
|---|---|---|---|---|---|
| Miles Greer#6 | 1 | -14 | -14.0 | 0 | 0 |
Massachusetts| Player | INT | YDS | TD |
|---|---|---|---|
| TJ Magee#7 | 1 | 15 | 0 |
Buffalo| Player | INT | YDS | TD |
|---|---|---|---|
| Kobi Blackwell | 1 | 0 | 0 |
Drive Summary
MASS
Touchdown
75
BUFF
Field Goal
13
MASS
Punt
19
BUFF
Punt
17
MASS
Punt
56
BUFF
Punt
46
MASS
Safety
-7
BUFF
Punt
22
BUFF
Field Goal
0
MASS
Punt
16
MASS
Touchdown
3
BUFF
Interception
5
MASS
Missed FG
3
BUFF
End Of Half
1
BUFF
Touchdown
75
MASS
Punt
9
BUFF
Punt
22
MASS
Interception
26
BUFF
Punt
15
MASS
Punt
30
BUFF
46
MASS
Missed FG
65
BUFF
Punt
4
MASS
Field Goal
35
BUFF
Field Goal
63
BUFF
Touchdown
24
MASS
Downs
-4
Injury Report
No current injury report is available for this matchup.
Head-to-Head
Historical meetings are not available for this matchup.
Game Information
StageWeek 7
Season2026
KickoffSat, Oct 17, 1:00 pm
VenueBroadview Stadium
LocationBuffalo, NY
SurfaceArtificial Turf
BroadcastESPN+
Division Standings
FBS — Mid-American Conference
| Team | W | L | T | Pct | PF | PA | Home | Away | Strk |
|---|---|---|---|---|---|---|---|---|---|
 Eastern Michigan | 4 | 7 | 0 | 0.364 | 226 | 300 | 2-3 | 2-4 | L4 |
 Ohio | 8 | 3 | 0 | 0.727 | 317 | 257 | 5-0 | 3-3 | W1 |
 Western Michigan | 8 | 3 | 0 | 0.727 | 312 | 214 | 4-1 | 4-2 | W3 |
| Buffalo | 8 | 3 | 0 | 0.727 | 283 | 262 | 5-1 | 3-2 | W6 |
 Bowling Green | 3 | 7 | 0 | 0.300 | 193 | 289 | 2-3 | 1-4 | W1 |
 Toledo | 8 | 2 | 0 | 0.800 | 343 | 220 | 5-1 | 3-1 | W4 |
 Central Michigan | 5 | 6 | 0 | 0.455 | 227 | 261 | 4-2 | 1-4 | L1 |
 Miami (OH) | 7 | 4 | 0 | 0.636 | 301 | 260 | 4-2 | 3-2 | W2 |
 Kent State | 3 | 8 | 0 | 0.273 | 160 | 328 | 3-2 | 0-6 | L3 |
 Ball State | 3 | 8 | 0 | 0.273 | 241 | 376 | 2-2 | 1-6 | L3 |
| Massachusetts | 5 | 6 | 0 | 0.455 | 276 | 257 | 3-3 | 2-3 | L2 |
 Akron | 2 | 9 | 0 | 0.182 | 220 | 365 | 1-4 | 1-5 | W1 |
 Sacramento State | 2 | 9 | 0 | 0.182 | 177 | 321 | 2-4 | 0-5 | L2 |
Massachusetts
9th in MAC
VS
Buffalo
2nd in MAC
Quarterbacks & Specialists
#16
Logan Inagawa
#43
Edward Phillipson
Receivers & Backs
#83
Reece Adkins
#85
Drew Alsup
#15
Tavian Dashiell
#8
Kezion Dia-Johnson
#11
Max Dowling
#23
Elijah Faulkner
#14
Curtis Kimmons IV
#19
Jabari Lewis
#6
Justin Williams-Thomas
Defensive Line & Linebackers
#15
Khari Bendolph
#44
Timmy Hinspeter
#6
Joshua Iseah
#92
Romando Johnson
#9
Justin Krueger
#5
Tyler Martin
#10
Aubrey Melvin
#55
Zakar Morris
#2
Joshua Nobles
#90
Tim Passmore Jr.
#36
David Timson
Defensive Backs
#3
Kendall Bournes
#38
Zeraun Daniel
#22
Jahmad Harmon
#7
TJ Magee
Isaiah Reed
#1
DD Snyder
Other
#99
Derek Morris
Quarterbacks & Specialists
#48
Joseph Stoever
#90
Ethan Stumpf
#7
Jason Wright
Offensive Line
#74
Nino Francavilla
Receivers & Backs
#2
Jaylen Andrews
#4
Messiah Burch
#3
Patrick Clacks III
#11
Dwayne Early Jr.
#1
Phillip Folmar
Nino Hill
#24
James McNeil Jr.
#6
Chance Morrow
#5
Clint Walker
Defensive Line & Linebackers
#2
Stevie Bracey
#1
SaVeon Brown
#97
Christopher Climes
#99
Cornell Evans
#33
Jordan Owens
#88
Rex Stinchcomb
Defensive Backs
Kobi Blackwell
#38
Dylan Cleary
#5
Mikey Crawford
#6
Miles Greer
#7
John Keough
Other
#11
Will Clark
#17
Logan Goodwin
#31
Oliver Hautanen
#16
Caleb Oliver
#15
Sedrick Vessah
Massachusetts
9th in MAC
VS
Buffalo
1st in MAC
Passing
62.9
Completion Percentage
50.3
166
Completions
154
1.50
Interception Percentage
2.00
4
Interceptions
6
64
Longest Pass
59
1,926
Net Passing Yards
1,643
192.6
Net Passing Yards Per Game
164.3
264
Passing Attempts
306
3.80
Passing Touchdown %
4.20
10
Passing Touchdowns
13
133.7
Passer Rating
105.7
15
Total Sacks
24
105
Sack Yards Lost
157
7.3
Yards Per Pass Attempt
5.4
1,926
Passing Yards
1,643
0
Passing Fumbles Lost
0
10
Team Games Played
10
332.0
Yards Per Game
345.1
24.3
Total Points Per Game
24.3
243
Total Points
243
30
Total Touchdowns
28
192.6
Passing Yards Per Game
164.3
166-264
Comp-Att
154-306
15-105
Sacks-Yards Lost
24-157
Rushing
330
Rushing Attempts
423
1,394
Rushing Yards
1,808
4.2
Yards Per Rush Attempt
4.3
56
Long Rushing
87
0
20+ Yard Rushing Plays
0
17
Rushing Touchdowns
15
139.4
Rushing Yards Per Game
180.8
0
Rushing Fumbles
0
0
Rushing Fumbles Lost
0
68
Rushing 1st downs
85
10
Team Games Played
10
3,320
Total Yards
3,451
609
Total Offensive Plays
753
24.3
Total Points Per Game
24.3
243
Total Points
243
30
Total Touchdowns
28
Receiving
166
Receptions
154
0
Receiving Targets
0
1,926
Receiving Yards
1,643
1,926
Receiving Yards
1,643
10
Receiving Touchdowns
13
64
Long Reception
59
0
20+ Yard Receiving Plays
0
192.6
Receiving Yards Per Game
164.3
0
Receiving Fumbles
0
0
Receiving Fumbles Lost
0
809
Receiving Yards After Catch
421
78
Receiving First Downs
85
10
Team Games Played
10
11.6
Yards Per Reception
10.7
24.3
Total Points Per Game
24.3
243
Total Points
243
30
Total Touchdowns
28
Miscellaneous
162
Total 1st downs
200
68
Rushing 1st downs
85
78
Passing 1st downs
86
16
1st downs by penalty
29
38
Third Down Conversions
65
122
Third Down Attempts
167
31.15
3rd down %
38.92
8
Fourth Down Conversions
11
17
First Downs Attempts
15
47.06
4th down %
73.33
73
Total Penalties
49
644
Total Penalty Yards
460
17657
Possession Time Seconds
18083
0.00
Red Zone Field Goal Percentage
0.00
0.00
Red Zone Scoring Percentage
0.00
0.00
Red Zone Efficiency Percentage
0.00
0.00
Red Zone Touchdown Percentage
0.00
11
Total Takeaways
13
9
Total Giveaways
14
2
Turnover Ratio
-1
0
Fumbles Lost
0
38-122
3rd down efficiency
65-167
8-17
4th down efficiency
11-15
73-644
Total-Yards
49-460
Defense
286
Solo Tackles
355
416
Assist Tackles
308
702
Total Tackles
663
25
Sacks
17
145
Sack Yards
109
79
Stuffs
72
37
Passes Defended
46
15.7
Average Interception Yards
0.5
49
Long Interception
2
0
Miscellaneous Touchdowns
0
1
Kicks Blocked
1
34
Tackles For Loss
39
10
Team Games Played
10
Defensive Interceptions
7
Interceptions
4
110
Interception Yards
2
2
Interception Touchdowns
0
7-110
INT: Total
4-2
General
13
Fumbles
15
4
Forced Fumbles
7
7
Fumbles Recovered
7
0
Fumbles Touchdowns
0
10
Games Played
10
13-0
Fumbles-Lost
15-0
Returning
14
Kick Returns
13
251
Kick Return Yards
301
17.9
Yards Per Kick Return
23.2
28
Long Kick Return
71
0
Kick Return Touchdowns
0
9
Punt Returns
11
156
Punt Return Yards
73
17.3
Yards Per Punt Return
6.6
82
Long Punt Return
18
1
Punt Return Touchdowns
0
0
Punt Return Fair Catches
0
0
Kick Return Fumbles Lost
0
0
Punt Return Fumbles Lost
0
10
Team Games Played
10
9-156
Punt: Total
11-73
Kicking
12
Field Goal Made
15
18
Field Goal Attempts
19
66.7
Field Goal Percentage
78.9
56
Long Field Goal Made
52
0
Field Goal Attempts 1-19
0
2
Field Goal Attempts 20-29
6
7
Field Goal Attempts 30-39
8
3
Field Goal Attempts 40-49
4
6
Field Goal Attempts 50+
1
25
Extra Points Made
24
26
Extra Point Attempts
25
96.2
Extra Point Percentage
96.0
0
Field Goals Made 1-19
0
2
Field Goals Made 20-29
6
6
Field Goals Made 30-39
6
0
Field Goals Made 40-49
2
4
Field Goals Made 50+
1
61
Total Kicking Points
69
10
Team Games Played
10
78
Touchback Percentage
75
0.0
Average Kickoff Return Yards
0.0
0
Kickoff Return Yards
0
0
Kickoff Returns
0
0-0
Kickoffs: Total
0-0
12-18
FG: Good-Attempts
15-19
Punting
47
Punts
58
2,053
Punt Yards
2,500
67
Long Punt
72
43.7
Gross Average Punt Yards
43.1
43.7
Net Average Punt Yards
43.1
0
Punts Blocked
0
16
Punts Inside 20
20
4
Touchbacks
7
22
Fair Catches
15
13
Punt Returns
21
0
Punt Return Yards
0
0.0
Average Punt Return Yards
0.0
10
Team Games Played
10
47-2,053
Punt: Total Yards
58-2,500
Scoring
17
Rushing Touchdowns
15
10
Receiving Touchdowns
13
1
Return Touchdowns
0
28
Total Touchdowns
28
12
Field Goals
15
25
Kick Extra Points
24
1
Total Two Point Conversions
2
243
Total Points
243
24.3
Total Points Per Game
24.3