

Mercer vs Georgia Tech Live Score (19 Sep, 2026)
Score by Quarter
| Team | Q1 | Q2 | Q3 | Q4 | Final |
|---|---|---|---|---|---|
 Mercer | 0 | 3 | 8 | 0 | 11 |
 Georgia Tech | 7 | 17 | 13 | 7 | 44 |
Scoring Plays
Q1
8:32
8:32
Justice Haynes 1 Yd pass from Alberto Mendoza (Aidan Birr Kick)
Passing Touchdown
0 – 7
Q2
13:29
13:29
Justice Haynes 1 Yd Run (Aidan Birr Kick)
Rushing Touchdown
0 – 14
Q2
8:19
8:19
Simon Zeidan 21 Yd Field Goal
Field Goal Good
3 – 14
Q2
1:56
1:56
Aidan Birr 32 Yd Field Goal
Field Goal Good
3 – 17
Q2
0:32
0:32
Jaiven Plummer 37 Yd pass from Alberto Mendoza (Aidan Birr Kick)
Passing Touchdown
3 – 24
Q3
9:40
9:40
Simon Zeidan 40 Yd Field Goal
Field Goal Good
6 – 24
Q3
8:20
8:20
Justice Haynes 31 Yd Run (Aidan Birr PAT blocked)
Rushing Touchdown
6 – 30
Q3
8:20
8:20
Cameron Goggins Defensive PAT Conversion
Defensive 2pt Conversion
8 – 30
Q3
2:58
2:58
Simon Zeidan 31 Yd Field Goal
Field Goal Good
11 – 30
Q3
0:55
0:55
Debron Gatling 33 Yd pass from Alberto Mendoza (Aidan Birr Kick)
Passing Touchdown
11 – 37
Q4
11:42
11:42
Chad Alexander 1 Yd Run (Aidan Birr Kick)
Rushing Touchdown
11 – 44
Game Leaders
MercerGeorgia Tech
 J. Pickles QB
Passing Yards
 A. Mendoza QB
 Z. Palode-Gary RB
Rushing Yards
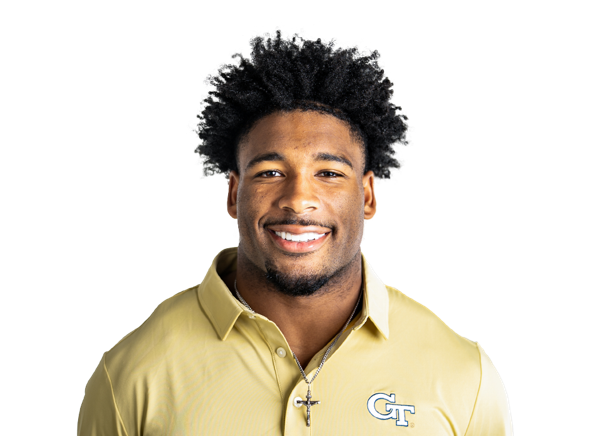 J. Haynes RB
 B. Smith WR
Receiving Yards
 D. Penson WRR. Dangler LB
Sacks
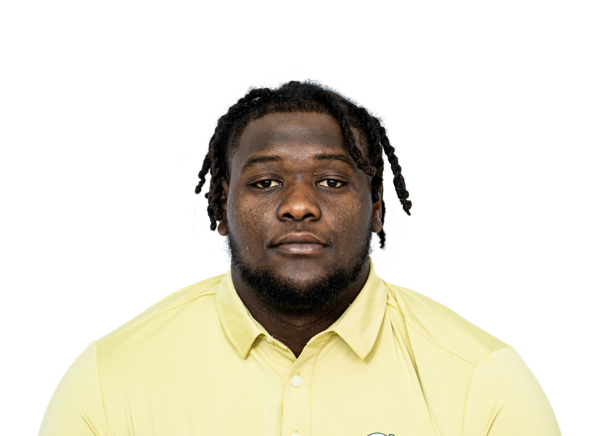 T. Thomas DT
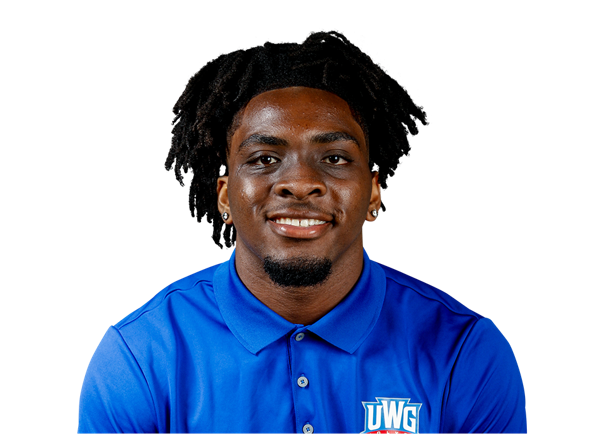 J. Carter LB
Tackles
T. Thomas DTPlayer Box Score
Mercer| Player | C/ATT | YDS | AVG | TD | INT | QBR |
|---|---|---|---|---|---|---|
| JP Pickles#19 | 7/11 | 82 | 7.5 | 0 | 1 | -- |
 Jaylen King#2 | 3/3 | 20 | 6.7 | 0 | 0 | -- |
Georgia Tech| Player | C/ATT | YDS | AVG | TD | INT | QBR |
|---|---|---|---|---|---|---|
| Alberto Mendoza#15 | 15/21 | 249 | 11.9 | 3 | 0 | 81.7 |
 Grady Adamson#9 | 0/1 | 0 | 0.0 | 0 | 0 | -- |
Mercer| Player | CAR | YDS | AVG | TD | LONG |
|---|---|---|---|---|---|
| Zahmari Palode-Gary#7 | 15 | 71 | 4.7 | 0 | 16 |
| JP Pickles#19 | 11 | 53 | 4.8 | 0 | 17 |
| Devon Caldwell#21 | 7 | 28 | 4.0 | 0 | 6 |
| Eric Rasheed | 4 | 24 | 6.0 | 0 | 8 |
| Brayden Smith#9 | 1 | 8 | 8.0 | 0 | 8 |
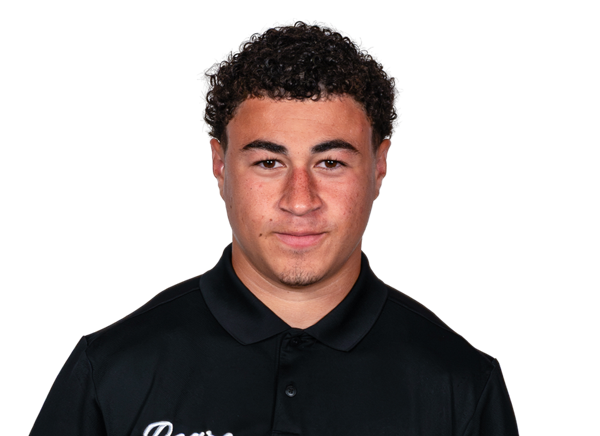 Zachary Lowe#84 | 1 | 6 | 6.0 | 0 | 6 |
| Jaylen King#2 | 5 | 2 | 0.4 | 0 | 5 |
 Micah Bell#27 | 2 | -4 | -2.0 | 0 | 0 |
Georgia Tech| Player | CAR | YDS | AVG | TD | LONG |
|---|---|---|---|---|---|
| Justice Haynes#22 | 22 | 141 | 6.4 | 2 | 31 |
 Trelain Maddox#1 | 5 | 11 | 2.2 | 0 | 4 |
 Chad Alexander#11 | 4 | 8 | 2.0 | 1 | 4 |
 Malachi Hosley | 4 | 7 | 1.8 | 0 | 5 |
| Grady Adamson#9 | 1 | 2 | 2.0 | 0 | 2 |
| Team | 3 | -5 | -1.7 | 0 | -3 |
| Alberto Mendoza#15 | 1 | -8 | -8.0 | 0 | 0 |
Mercer| Player | REC | YDS | AVG | TD | LONG |
|---|---|---|---|---|---|
| Brayden Smith#9 | 4 | 58 | 14.5 | 0 | 37 |
| Eric Rasheed | 2 | 23 | 11.5 | 0 | 14 |
 Jackson Kostmayer#14 | 1 | 20 | 20.0 | 0 | 20 |
| Devon Caldwell#21 | 3 | 1 | 0.3 | 0 | 2 |
Georgia Tech| Player | REC | YDS | AVG | TD | LONG |
|---|---|---|---|---|---|
| Dalen Penson#7 | 3 | 58 | 19.3 | 0 | 26 |
 Kevin Roche Jr.#86 | 2 | 38 | 19.0 | 0 | 23 |
 Jaiven Plummer#16 | 1 | 37 | 37.0 | 1 | 37 |
 Debron Gatling#6 | 1 | 33 | 33.0 | 1 | 33 |
| Justice Haynes#22 | 2 | 26 | 13.0 | 1 | 25 |
| Trelain Maddox#1 | 2 | 22 | 11.0 | 0 | 13 |
 Isaiah Fuhrmann#13 | 1 | 19 | 19.0 | 0 | 19 |
 Jordan Allen#4 | 2 | 10 | 5.0 | 0 | 5 |
 Chris Corbo#17 | 1 | 6 | 6.0 | 0 | 6 |
Mercer| Player | TOT | SOLO | SACKS | TFL | PD | QB HUR | TD |
|---|---|---|---|---|---|---|---|
| Ronin Dangler#48 | 12 | 8 | 1 | 1 | 0 | 1 | 0 |
| Jyarius Carter | 12 | 3 | 0 | 0.5 | 1 | 0 | 0 |
 Javious Bond#30 | 4 | 4 | 0 | 0 | 0 | 0 | 0 |
 Ethan McDowell#14 | 4 | 2 | 0 | 0 | 0 | 0 | 0 |
| Jeremy Richardson#5 | 4 | 2 | 0 | 0 | 0 | 0 | 0 |
 Mac Bradley#34 | 4 | 2 | 0 | 0 | 0 | 0 | 0 |
 Mike Polke#13 | 3 | 3 | 0 | 0 | 0 | 0 | 0 |
 Kobe McInnis#15 | 3 | 2 | 0 | 0 | 0 | 0 | 0 |
 Sam Martin Jr.#6 | 3 | 1 | 0 | 0 | 0 | 0 | 0 |
 Cam Moore#4 | 3 | 1 | 0 | 0 | 0 | 0 | 0 |
 Cameron Goggins#8 | 2 | 2 | 0 | 0 | 0 | 0 | 0 |
 Delano Marcelus#11 | 2 | 2 | 0 | 0 | 0 | 0 | 0 |
 Aiden Holewski#90 | 2 | 1 | 0 | 0 | 0 | 0 | 0 |
| Nigel Gay#24 | 2 | 0 | 0 | 0.5 | 0 | 0 | 0 |
 Emmanuel Lane#2 | 1 | 1 | 0 | 0 | 0 | 0 | 0 |
 Antonio Butts Jr.#33 | 1 | 0 | 0 | 0 | 0 | 0 | 0 |
Georgia Tech| Player | TOT | SOLO | SACKS | TFL | PD | QB HUR | TD |
|---|---|---|---|---|---|---|---|
 Savion Riley#13 | 6 | 4 | 0 | 0 | 0 | 0 | 0 |
| Braylon Outlaw#35 | 6 | 4 | 0 | 1 | 0 | 0 | 0 |
| Tawfiq Thomas#95 | 6 | 3 | 1 | 2 | 0 | 0 | 0 |
 Tae Harris#27 | 6 | 3 | 0 | 0 | 0 | 0 | 0 |
 Melvin Jordan IV | 5 | 3 | 0 | 1 | 0 | 0 | 0 |
 Cayman Spaulding#1 | 5 | 2 | 0 | 1 | 0 | 0 | 0 |
 Jon Mitchell#12 | 4 | 3 | 0 | 0 | 0 | 0 | 0 |
 Taje McCoy#41 | 4 | 2 | 1 | 2 | 0 | 0 | 0 |
 Brayden Manley#11 | 4 | 2 | 0 | 0 | 0 | 0 | 0 |
 Jordan Boyd#8 | 3 | 2 | 0 | 1 | 0 | 0 | 0 |
 Kelvin Hill#6 | 3 | 2 | 0 | 0 | 0 | 0 | 0 |
 E.J. Lightsey#2 | 3 | 1 | 0 | 0.5 | 0 | 0 | 0 |
 Chris Hewitt Jr.#26 | 3 | 1 | 0 | 0 | 0 | 0 | 0 |
 Noah Carter#24 | 2 | 2 | 1 | 1 | 0 | 0 | 0 |
 Daiquan White#4 | 2 | 2 | 0 | 0 | 0 | 0 | 0 |
 Jonas Duclona#14 | 2 | 1 | 0 | 0 | 0 | 0 | 0 |
 Zachary Tobe#5 | 2 | 0 | 0 | 0 | 0 | 0 | 0 |
 Vincent Carroll-Jackson#99 | 2 | 0 | 0 | 0.5 | 0 | 0 | 0 |
 Amontrae Bradford#9 | 2 | 0 | 0 | 0 | 0 | 0 | 0 |
 Landen Marshall#97 | 1 | 0 | 0 | 0 | 0 | 0 | 0 |
 C.J. Gamble#34 | 1 | 0 | 0 | 0 | 0 | 0 | 0 |
| Amier Clarke#98 | 1 | 0 | 0 | 0 | 0 | 0 | 0 |
Mercer| Player | FUM | LOST | REC |
|---|---|---|---|
| Jaylen King#2 | 1 | 1 | 0 |
| Micah Bell#27 | 1 | 0 | 0 |
| JP Pickles#19 | 1 | 0 | 0 |
Georgia Tech| Player | FUM | LOST | REC |
|---|---|---|---|
 Christian Speakman#92 | 0 | 0 | 1 |
Mercer| Player | FG | PCT | LONG | XP | PTS |
|---|---|---|---|---|---|
 Simon Zeidan#37 | 3/3 | 100.0 | 40 | 0/0 | 9 |
Georgia Tech| Player | FG | PCT | LONG | XP | PTS |
|---|---|---|---|---|---|
 Aidan Birr#33 | 1/1 | 100.0 | 32 | 5/6 | 8 |
Mercer| Player | NO | YDS | AVG | TB | In 20 | LONG |
|---|---|---|---|---|---|---|
| Senin Seymour#96 | 6 | 254 | 42.3 | 0 | 1 | 54 |
Georgia Tech| Player | NO | YDS | AVG | TB | In 20 | LONG |
|---|---|---|---|---|---|---|
 Alex Bacchetta#47 | 4 | 205 | 51.3 | 1 | 1 | 65 |
Georgia Tech| Player | NO | YDS | AVG | LONG | TD |
|---|---|---|---|---|---|
| Chad Alexander#11 | 1 | 41 | 41.0 | 41 | 0 |
 Rahkeem Smith#3 | 1 | 35 | 35.0 | 35 | 0 |
Georgia Tech| Player | NO | YDS | AVG | LONG | TD |
|---|---|---|---|---|---|
| Jordan Allen#4 | 1 | 12 | 12.0 | 12 | 0 |
Georgia Tech| Player | INT | YDS | TD |
|---|---|---|---|
| C.J. Gamble#34 | 1 | 1 | 0 |
Drive Summary
GT
Punt
7
MER
Punt
6
GT
Touchdown
67
MER
Punt
31
GT
Punt
4
MER
Fumble
-1
GT
Touchdown
37
MER
Field Goal
71
GT
Field Goal
61
MER
Punt
4
GT
Touchdown
60
MER
End Of Half
16
MER
Field Goal
53
GT
Touchdown
65
MER
Field Goal
62
GT
Touchdown
52
MER
Interception
22
GT
Touchdown
40
MER
Punt
-8
GT
Punt
9
MER
Punt
9
GT
Punt
3
MER
Punt
4
GT
End of Game
-5
Injury Report
No current injury report is available for this matchup.
Head-to-Head
Historical meetings are not available for this matchup.
Game Information
StageWeek 3
Season2026
KickoffSat, Sep 19, 12:00 pm
VenueBobby Dodd Stadium
LocationAtlanta, GA
SurfaceArtificial Turf
BroadcastACC Network
Attendance50,852
Division Standings
FCS — Southern Conference
| Team | W | L | T | Pct | PF | PA | Home | Away | Strk |
|---|---|---|---|---|---|---|---|---|---|
 Tennessee Tech | 0 | 0 | 0 | .000 | 0 | 0 | — | — | — |
 Furman | 0 | 1 | 0 | 0.000 | 9 | 56 | 0-0 | 0-1 | L1 |
 Wofford | 0 | 1 | 0 | 0.000 | 15 | 36 | 0-0 | 0-1 | L1 |
 East Tennessee State | 0 | 1 | 0 | 0.000 | 3 | 35 | 0-0 | 0-1 | L1 |
 Western Carolina | 0 | 1 | 0 | 0.000 | 10 | 62 | 0-0 | 0-1 | L1 |
 VMI | 0 | 1 | 0 | 0.000 | 3 | 73 | 0-0 | 0-1 | L1 |
| Mercer | 0 | 1 | 0 | 0.000 | 11 | 44 | 0-0 | 0-1 | L1 |
 Chattanooga | 0 | 0 | 0 | .000 | 0 | 0 | — | — | — |
 The Citadel | 1 | 1 | 0 | 0.500 | 43 | 82 | 0-0 | 1-1 | L1 |
 Samford | 0 | 1 | 0 | 0.000 | 14 | 33 | 0-0 | 0-1 | L1 |
FBS — Atlantic Coast Conference
| Team | W | L | T | Pct | PF | PA | Home | Away | Strk |
|---|---|---|---|---|---|---|---|---|---|
 Miami | 8 | 0 | 0 | 1.000 | 381 | 142 | 4-0 | 4-0 | W8 |
 Duke | 6 | 2 | 0 | 0.750 | 256 | 114 | 4-1 | 2-1 | W2 |
 Pittsburgh | 6 | 3 | 0 | 0.667 | 287 | 178 | 5-1 | 1-2 | W1 |
 Virginia | 4 | 5 | 0 | 0.444 | 233 | 208 | 4-2 | 0-3 | L3 |
 California | 3 | 6 | 0 | 0.333 | 197 | 284 | 2-3 | 1-3 | L3 |
 Clemson | 5 | 3 | 0 | 0.625 | 186 | 173 | 3-2 | 2-1 | W1 |
 Louisville | 5 | 3 | 0 | 0.625 | 323 | 216 | 4-1 | 1-2 | W3 |
 SMU | 6 | 2 | 0 | 0.750 | 282 | 178 | 5-0 | 1-2 | L1 |
 Virginia Tech | 6 | 2 | 0 | 0.750 | 280 | 164 | 3-1 | 3-1 | W2 |
 Boston College | 4 | 4 | 0 | 0.500 | 173 | 212 | 3-1 | 1-3 | L1 |
| Georgia Tech | 2 | 6 | 0 | 0.250 | 198 | 246 | 2-3 | 0-3 | L3 |
 North Carolina | 4 | 4 | 0 | 0.500 | 206 | 184 | 1-3 | 3-1 | L2 |
 Wake Forest | 7 | 1 | 0 | 0.875 | 313 | 143 | 3-1 | 4-0 | W5 |
 Florida State | 3 | 5 | 0 | 0.375 | 245 | 231 | 3-2 | 0-3 | L3 |
 NC State | 4 | 4 | 0 | 0.500 | 257 | 207 | 4-1 | 0-3 | W1 |
 Stanford | 4 | 5 | 0 | 0.444 | 183 | 336 | 4-1 | 0-4 | L1 |
 Syracuse | 4 | 4 | 0 | 0.500 | 251 | 211 | 2-2 | 2-2 | W2 |
Mercer
3rd in Southern
VS
Georgia Tech
17th in ACC
Quarterbacks & Specialists
#2
Jaylen King
#19
JP Pickles
#96
Senin Seymour
Receivers & Backs
#27
Micah Bell
#21
Devon Caldwell
#14
Jackson Kostmayer
#84
Zachary Lowe
#7
Zahmari Palode-Gary
Eric Rasheed
#9
Brayden Smith
Defensive Line & Linebackers
#34
Mac Bradley
#33
Antonio Butts Jr.
Jyarius Carter
#48
Ronin Dangler
#90
Aiden Holewski
#11
Delano Marcelus
#14
Ethan McDowell
#15
Kobe McInnis
#4
Cam Moore
Defensive Backs
#30
Javious Bond
#24
Nigel Gay
#8
Cameron Goggins
#2
Emmanuel Lane
#6
Sam Martin Jr.
#13
Mike Polke
#5
Jeremy Richardson
Other
#37
Simon Zeidan
Quarterbacks & Specialists
#9
Grady Adamson
#47
Alex Bacchetta
#15
Alberto Mendoza
Receivers & Backs
#11
Chad Alexander
#4
Jordan Allen
#17
Chris Corbo
#13
Isaiah Fuhrmann
#6
Debron Gatling
#22
Justice Haynes
Malachi Hosley
#1
Trelain Maddox
#7
Dalen Penson
#16
Jaiven Plummer
#86
Kevin Roche Jr.
#3
Rahkeem Smith
Defensive Line & Linebackers
#8
Jordan Boyd
#9
Amontrae Bradford
#99
Vincent Carroll-Jackson
#24
Noah Carter
#98
Amier Clarke
#34
C.J. Gamble
Melvin Jordan IV
#2
E.J. Lightsey
#11
Brayden Manley
#97
Landen Marshall
#41
Taje McCoy
#35
Braylon Outlaw
#1
Cayman Spaulding
#92
Christian Speakman
#95
Tawfiq Thomas
Defensive Backs
#14
Jonas Duclona
#27
Tae Harris
#26
Chris Hewitt Jr.
#6
Kelvin Hill
#12
Jon Mitchell
#13
Savion Riley
#5
Zachary Tobe
#4
Daiquan White
Other
#33
Aidan Birr
Mercer
3rd in Southern
VS
Georgia Tech
16th in ACC
Passing
64.3
Completion Percentage
70.8
119
Completions
160
4.30
Interception Percentage
2.70
8
Interceptions
6
63
Longest Pass
46
1,360
Net Passing Yards
1,787
170.0
Net Passing Yards Per Game
255.3
185
Passing Attempts
226
7.00
Passing Touchdown %
4.90
13
Passing Touchdowns
11
141.0
Passer Rating
147.8
15
Total Sacks
16
93
Sack Yards Lost
122
7.4
Yards Per Pass Attempt
7.9
1,360
Passing Yards
1,787
0
Passing Fumbles Lost
0
8
Team Games Played
7
422.5
Yards Per Game
378.7
30.6
Total Points Per Game
26.7
245
Total Points
187
28
Total Touchdowns
23
170.0
Passing Yards Per Game
255.3
119-185
Comp-Att
160-226
15-93
Sacks-Yards Lost
16-122
Rushing
334
Rushing Attempts
209
2,020
Rushing Yards
864
6.0
Yards Per Rush Attempt
4.1
83
Long Rushing
60
0
20+ Yard Rushing Plays
0
13
Rushing Touchdowns
10
252.5
Rushing Yards Per Game
123.4
0
Rushing Fumbles
0
0
Rushing Fumbles Lost
0
93
Rushing 1st downs
48
8
Team Games Played
7
3,380
Total Yards
2,651
534
Total Offensive Plays
451
30.6
Total Points Per Game
26.7
245
Total Points
187
28
Total Touchdowns
23
Receiving
119
Receptions
160
0
Receiving Targets
0
1,360
Receiving Yards
1,787
1,360
Receiving Yards
1,787
13
Receiving Touchdowns
11
63
Long Reception
46
0
20+ Yard Receiving Plays
0
170.0
Receiving Yards Per Game
255.3
0
Receiving Fumbles
0
0
Receiving Fumbles Lost
0
59
Receiving Yards After Catch
804
56
Receiving First Downs
79
8
Team Games Played
7
11.4
Yards Per Reception
11.2
30.6
Total Points Per Game
26.7
245
Total Points
187
28
Total Touchdowns
23
Miscellaneous
156
Total 1st downs
151
93
Rushing 1st downs
48
56
Passing 1st downs
79
7
1st downs by penalty
24
32
Third Down Conversions
27
105
Third Down Attempts
80
30.48
3rd down %
33.75
8
Fourth Down Conversions
6
10
First Downs Attempts
12
80.00
4th down %
50.00
73
Total Penalties
54
618
Total Penalty Yards
482
14531
Possession Time Seconds
11554
0.00
Red Zone Field Goal Percentage
0.00
0.00
Red Zone Scoring Percentage
0.00
0.00
Red Zone Efficiency Percentage
0.00
0.00
Red Zone Touchdown Percentage
0.00
13
Total Takeaways
11
10
Total Giveaways
9
3
Turnover Ratio
2
0
Fumbles Lost
0
32-105
3rd down efficiency
27-80
8-10
4th down efficiency
6-12
73-618
Total-Yards
54-482
Defense
254
Solo Tackles
259
294
Assist Tackles
206
548
Total Tackles
465
20
Sacks
12
125
Sack Yards
102
74
Stuffs
51
22
Passes Defended
14
12.5
Average Interception Yards
1.0
38
Long Interception
1
0
Miscellaneous Touchdowns
0
1
Kicks Blocked
2
42
Tackles For Loss
36
8
Team Games Played
7
Defensive Interceptions
11
Interceptions
1
138
Interception Yards
1
2
Interception Touchdowns
0
11-138
INT: Total
1-1
General
7
Fumbles
11
4
Forced Fumbles
3
5
Fumbles Recovered
5
0
Fumbles Touchdowns
0
8
Games Played
7
7-0
Fumbles-Lost
11-0
Returning
15
Kick Returns
24
270
Kick Return Yards
665
18.0
Yards Per Kick Return
27.7
68
Long Kick Return
100
0
Kick Return Touchdowns
1
11
Punt Returns
7
155
Punt Return Yards
85
14.1
Yards Per Punt Return
12.1
45
Long Punt Return
33
0
Punt Return Touchdowns
1
0
Punt Return Fair Catches
0
0
Kick Return Fumbles Lost
0
0
Punt Return Fumbles Lost
0
8
Team Games Played
7
11-155
Punt: Total
7-85
Kicking
16
Field Goal Made
9
19
Field Goal Attempts
12
84.2
Field Goal Percentage
75.0
55
Long Field Goal Made
33
0
Field Goal Attempts 1-19
0
7
Field Goal Attempts 20-29
4
5
Field Goal Attempts 30-39
7
5
Field Goal Attempts 40-49
1
2
Field Goal Attempts 50+
0
27
Extra Points Made
22
27
Extra Point Attempts
23
100.0
Extra Point Percentage
95.7
0
Field Goals Made 1-19
0
6
Field Goals Made 20-29
4
4
Field Goals Made 30-39
5
4
Field Goals Made 40-49
0
2
Field Goals Made 50+
0
75
Total Kicking Points
49
8
Team Games Played
7
75
Touchback Percentage
86
0.0
Average Kickoff Return Yards
0.0
0
Kickoff Return Yards
0
0
Kickoff Returns
0
0-0
Kickoffs: Total
0-0
16-19
FG: Good-Attempts
9-12
Punting
40
Punts
26
1,663
Punt Yards
1,101
58
Long Punt
65
41.6
Gross Average Punt Yards
42.3
41.6
Net Average Punt Yards
42.3
0
Punts Blocked
0
12
Punts Inside 20
9
0
Touchbacks
2
13
Fair Catches
7
11
Punt Returns
6
0
Punt Return Yards
0
0.0
Average Punt Return Yards
0.0
8
Team Games Played
7
40-1,663
Punt: Total Yards
26-1,101
Scoring
13
Rushing Touchdowns
10
13
Receiving Touchdowns
11
0
Return Touchdowns
2
26
Total Touchdowns
23
16
Field Goals
9
27
Kick Extra Points
22
0
Total Two Point Conversions
0
245
Total Points
187
30.6
Total Points Per Game
26.7