

Miami vs Wake Forest Live Score (18 Sep, 2026)
Score by Quarter
| Team | Q1 | Q2 | Q3 | Q4 | Final |
|---|---|---|---|---|---|
 Miami | 7 | 17 | 7 | 2 | 33 |
 Wake Forest | 7 | 0 | 6 | 7 | 20 |
Scoring Plays
Q1
7:20
7:20
Joshua Moore 9 Yd pass from Darian Mensah (Jake Weinberg Kick)
Passing Touchdown
7 – 0
Q1
1:22
1:22
Kamrean Johnson 10 Yd pass from Gio Lopez (Connor Calvert Kick)
Passing Touchdown
7 – 7
Q2
13:07
13:07
Elija Lofton 21 Yd pass from Darian Mensah (Jake Weinberg Kick)
Passing Touchdown
14 – 7
Q2
8:17
8:17
Mark Fletcher Jr. 1 Yd Run (Jake Weinberg Kick)
Rushing Touchdown
21 – 7
Q2
0:00
0:00
Jake Weinberg 27 Yd Field Goal
Field Goal Good
24 – 7
Q3
8:56
8:56
Malachi Toney 2 Yd pass from Darian Mensah (Jake Weinberg Kick)
Passing Touchdown
31 – 7
Q3
4:06
4:06
Jack Foley 23 Yd pass from Gio Lopez (Two-Point Pass Conversion Failed)
Passing Touchdown
31 – 13
Q4
14:56
14:56
Carlos Hernandez 17 Yd pass from Gio Lopez (Connor Calvert Kick)
Passing Touchdown
31 – 20
Q4
13:11
13:11
Team Safety
Safety
33 – 20
Game Leaders
MiamiWake Forest
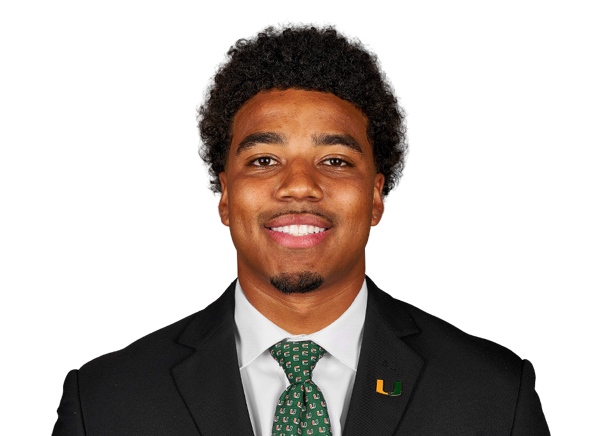 D. Mensah QB
Passing Yards
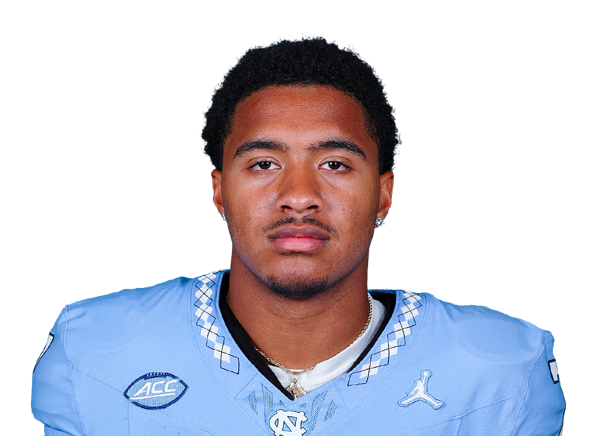 G. Lopez QB
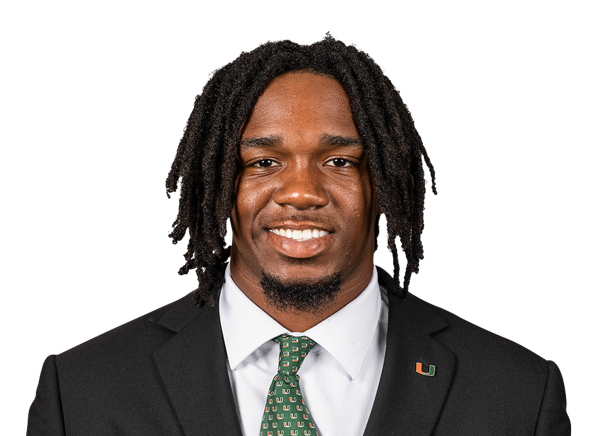 M. Fletcher Jr. RB
Rushing Yards
 D. Lawrence RB
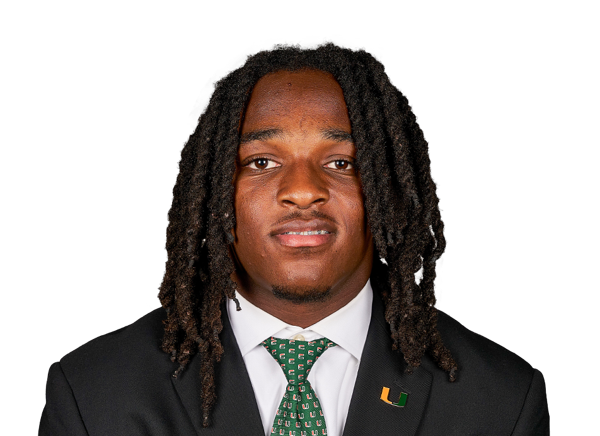 M. Toney WR
Receiving Yards
 J. Foley WR
 D. Wilson II DL
Sacks
 L. Hardy DL
 E. O'Connor DB
Tackles
 A. Hall LB
Player Box Score
Miami| Player | C/ATT | YDS | AVG | TD | INT | QBR |
|---|---|---|---|---|---|---|
| Darian Mensah#10 | 30/34 | 220 | 6.5 | 3 | 0 | 83.3 |
Wake Forest| Player | C/ATT | YDS | AVG | TD | INT | QBR |
|---|---|---|---|---|---|---|
| Gio Lopez#3 | 29/46 | 312 | 6.8 | 3 | 1 | 72.7 |
Miami| Player | CAR | YDS | AVG | TD | LONG |
|---|---|---|---|---|---|
| Mark Fletcher Jr.#4 | 16 | 85 | 5.3 | 1 | 17 |
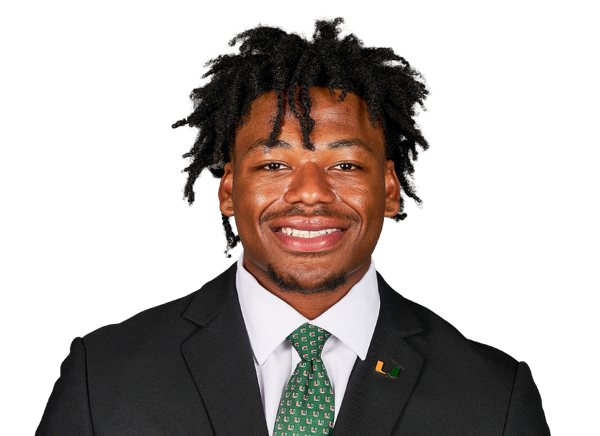 CharMar Brown#6 | 2 | 35 | 17.5 | 0 | 32 |
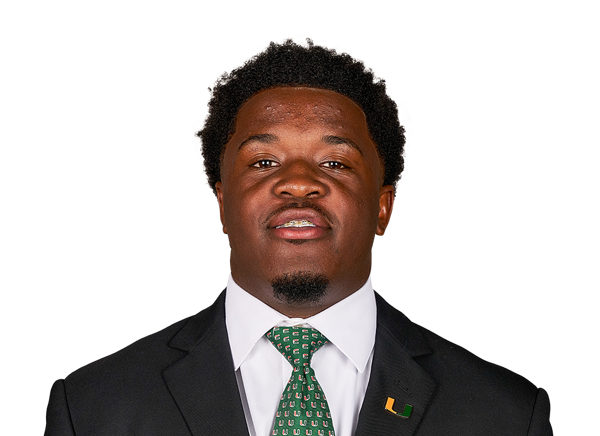 Javian Mallory#21 | 7 | 23 | 3.3 | 0 | 9 |
 Girard Pringle Jr. | 4 | 12 | 3.0 | 0 | 8 |
| Darian Mensah#10 | 2 | 5 | 2.5 | 0 | 6 |
| Team | 3 | -2 | -0.7 | 0 | -1 |
Wake Forest| Player | CAR | YDS | AVG | TD | LONG |
|---|---|---|---|---|---|
| Deuce Lawrence#22 | 6 | 27 | 4.5 | 0 | 13 |
 Ty Clark III#4 | 3 | 3 | 1.0 | 0 | 2 |
| Gio Lopez#3 | 7 | -8 | -1.1 | 0 | 5 |
Miami| Player | REC | YDS | AVG | TD | LONG |
|---|---|---|---|---|---|
| Malachi Toney#1 | 12 | 114 | 9.5 | 1 | 28 |
 Elija Lofton#9 | 5 | 39 | 7.8 | 1 | 21 |
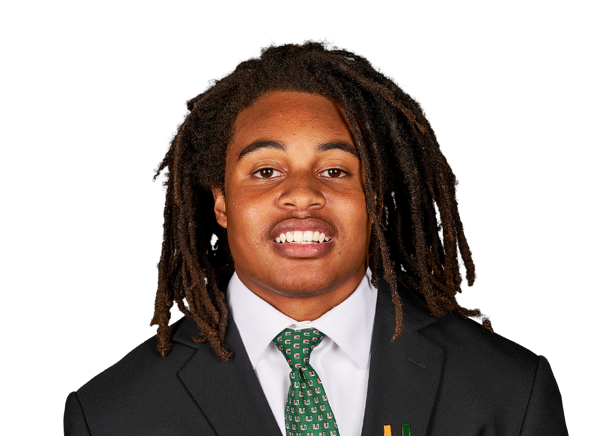 Daylyn Upshaw#7 | 4 | 22 | 5.5 | 0 | 9 |
 Joshua Moore#3 | 3 | 16 | 5.3 | 1 | 9 |
 Cooper Barkate#18 | 4 | 13 | 3.3 | 0 | 7 |
| Girard Pringle Jr. | 1 | 10 | 10.0 | 0 | 10 |
| CharMar Brown#6 | 1 | 6 | 6.0 | 0 | 6 |
Wake Forest| Player | REC | YDS | AVG | TD | LONG |
|---|---|---|---|---|---|
| Jack Foley#10 | 6 | 118 | 19.7 | 1 | 49 |
 Carlos Hernandez#8 | 10 | 69 | 6.9 | 1 | 21 |
 Kamrean Johnson#12 | 2 | 25 | 12.5 | 1 | 15 |
 Drayden Dickmann#18 | 2 | 22 | 11.0 | 0 | 12 |
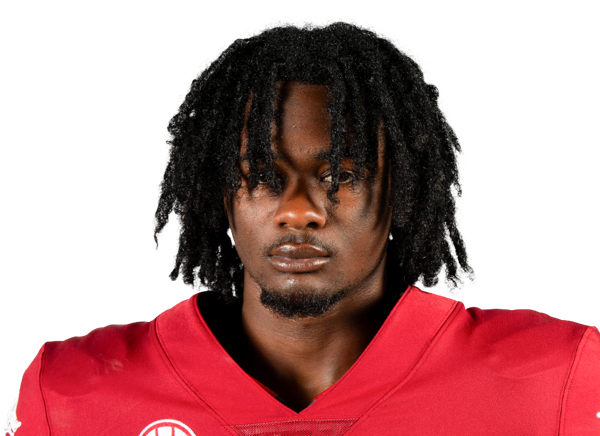 Kam Shanks#5 | 2 | 17 | 8.5 | 0 | 17 |
 Will Loerzel#85 | 1 | 15 | 15.0 | 0 | 15 |
| Deuce Lawrence#22 | 1 | 14 | 14.0 | 0 | 14 |
| Ty Clark III#4 | 1 | 13 | 13.0 | 0 | 13 |
 Antonio Meeks#14 | 2 | 9 | 4.5 | 0 | 5 |
| Dominick Barry#84 | 1 | 6 | 6.0 | 0 | 6 |
 Steele Pizzella#6 | 1 | 4 | 4.0 | 0 | 4 |
Miami| Player | TOT | SOLO | SACKS | TFL | PD | QB HUR | TD |
|---|---|---|---|---|---|---|---|
| Ethan O'Connor#24 | 8 | 5 | 0 | 0 | 0 | 0 | 0 |
 JJ Dunnigan#25 | 8 | 5 | 0 | 0 | 0 | 3 | 0 |
 Justin Scott#5 | 4 | 2 | 0 | 0 | 0 | 0 | 0 |
 Zechariah Poyser#7 | 4 | 2 | 0 | 0 | 2 | 0 | 0 |
 Bryce Fitzgerald#3 | 4 | 2 | 0 | 0 | 1 | 0 | 0 |
 Chase Smith#9 | 4 | 1 | 0 | 0 | 0 | 0 | 0 |
 Ezekiel Marcelin Jr.#17 | 4 | 0 | 0 | 0 | 0 | 1 | 0 |
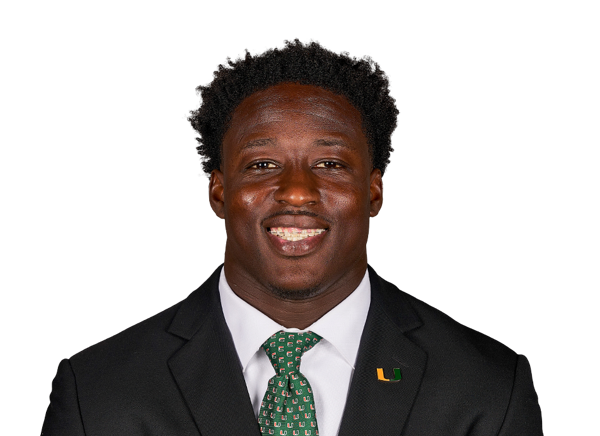 Mohamed Toure#1 | 3 | 1 | 0 | 0 | 0 | 0 | 0 |
 Ahmad Moten Sr.#99 | 3 | 1 | 0.5 | 0.5 | 0 | 0 | 0 |
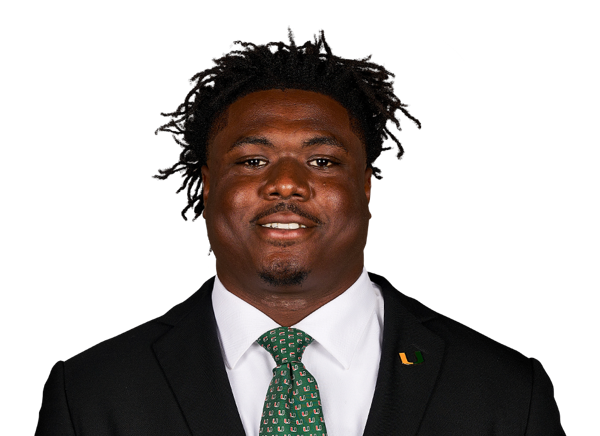 Armondo Blount#18 | 3 | 0 | 0.5 | 0.5 | 0 | 1 | 0 |
 Damari Brown#2 | 2 | 2 | 0 | 1 | 0 | 0 | 0 |
 Marquise Lightfoot#8 | 2 | 1 | 1 | 1 | 0 | 1 | 0 |
 Kamal Bonner#11 | 2 | 1 | 0 | 0 | 0 | 0 | 0 |
 Omar Thornton | 2 | 1 | 0 | 0.5 | 0 | 2 | 0 |
| Damon Wilson II#10 | 1 | 1 | 1 | 1 | 0 | 0 | 0 |
 Monroe Toney#35 | 1 | 1 | 0 | 0 | 0 | 0 | 0 |
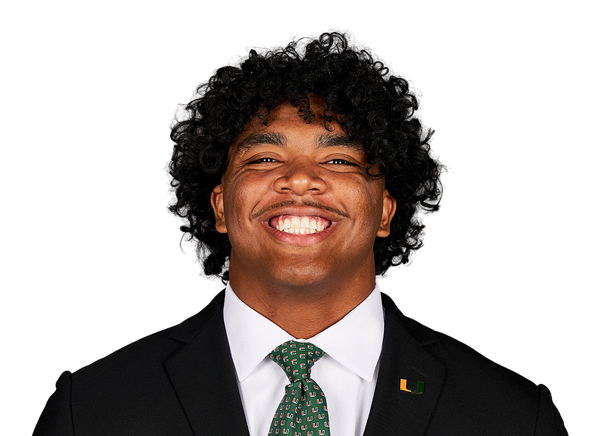 Keona Davis#97 | 1 | 0 | 0 | 0.5 | 0 | 0 | 0 |
Wake Forest| Player | TOT | SOLO | SACKS | TFL | PD | QB HUR | TD |
|---|---|---|---|---|---|---|---|
| Aiden Hall#21 | 9 | 2 | 0 | 0 | 0 | 0 | 0 |
 Deuce Blades II#2 | 8 | 5 | 0 | 0 | 0 | 0 | 0 |
 Davaughn Patterson#5 | 8 | 2 | 0 | 0 | 1 | 1 | 0 |
 Zach Lohavichan#94 | 8 | 0 | 0 | 0 | 0 | 0 | 0 |
 Braylon Johnson#8 | 7 | 3 | 0 | 0 | 0 | 0 | 0 |
 Ashaad Williams#13 | 6 | 3 | 0 | 0 | 0 | 0 | 0 |
| Langston Hardy#11 | 6 | 1 | 1 | 1 | 0 | 0 | 0 |
 Frank Cusano#43 | 6 | 0 | 0 | 0 | 0 | 0 | 0 |
| Vincent Firenze#23 | 6 | 0 | 0 | 0 | 0 | 0 | 0 |
 Rushaun Tongue#6 | 4 | 3 | 0 | 0 | 0 | 0 | 0 |
 Dallas Afalava#52 | 4 | 1 | 0 | 0 | 0 | 1 | 0 |
 Gabe Kirschke#10 | 3 | 1 | 0 | 1 | 0 | 0 | 0 |
| Somad Eaddy#38 | 3 | 1 | 0 | 0 | 0 | 0 | 0 |
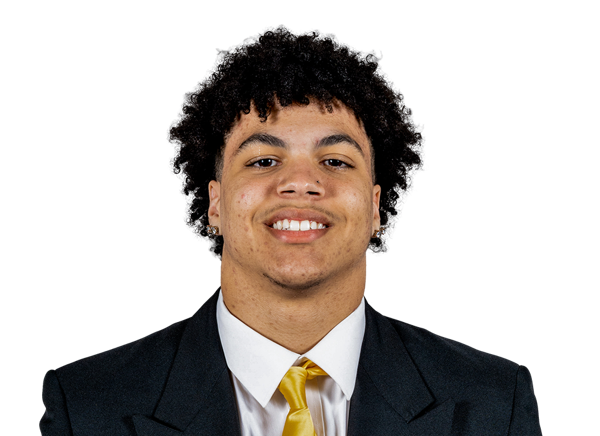 Myles Turpin#22 | 2 | 2 | 0 | 0 | 0 | 0 | 0 |
 Matt Herron#97 | 2 | 0 | 0 | 0 | 0 | 0 | 0 |
 Camden Hardy#9 | 1 | 1 | 0 | 0 | 0 | 0 | 0 |
 Kadear Dembele#55 | 1 | 1 | 0 | 0 | 0 | 0 | 0 |
 KD Daniels#1 | 1 | 1 | 0 | 0 | 0 | 0 | 0 |
 Zamari Stevenson#17 | 1 | 0 | 0 | 0 | 0 | 0 | 0 |
| Deuce Dyce#46 | 1 | 0 | 0 | 0 | 0 | 1 | 0 |
Miami| Player | FG | PCT | LONG | XP | PTS |
|---|---|---|---|---|---|
 Jake Weinberg#22 | 1/2 | 50.0 | 27 | 4/4 | 7 |
Wake Forest| Player | FG | PCT | LONG | XP | PTS |
|---|---|---|---|---|---|
 Connor Calvert#90 | 0/0 | 0.0 | 0 | 2/2 | 2 |
Miami| Player | NO | YDS | AVG | TB | In 20 | LONG |
|---|---|---|---|---|---|---|
 Dylan Joyce#94 | 5 | 235 | 47.0 | 0 | 0 | 54 |
Wake Forest| Player | NO | YDS | AVG | TB | In 20 | LONG |
|---|---|---|---|---|---|---|
| Ethan Hyams#45 | 4 | 178 | 44.5 | 0 | 0 | 49 |
Miami| Player | NO | YDS | AVG | LONG | TD |
|---|---|---|---|---|---|
| Girard Pringle Jr. | 4 | 67 | 16.8 | 19 | 0 |
Wake Forest| Player | NO | YDS | AVG | LONG | TD |
|---|---|---|---|---|---|
| Carlos Hernandez#8 | 2 | 14 | 7.0 | 14 | 0 |
Miami| Player | INT | YDS | TD |
|---|---|---|---|
| Ethan O'Connor#24 | 1 | 0 | 0 |
Drive Summary
MIA
Touchdown
92
WAKE
Touchdown
75
MIA
Touchdown
80
WAKE
Punt
5
MIA
Touchdown
79
WAKE
Punt
7
MIA
Punt
2
WAKE
Punt
6
MIA
Field Goal
70
WAKE
Punt
-10
MIA
Touchdown
56
WAKE
Touchdown
75
MIA
Punt
8
WAKE
Touchdown
63
MIA
Punt
3
WAKE
Safety
0
MIA
Punt
-1
WAKE
Downs
64
MIA
Punt
1
WAKE
Downs
7
MIA
Missed FG
6
WAKE
Interception
42
MIA
End of Half
9
Injury Report
No current injury report is available for this matchup.
Head-to-Head
Historical meetings are not available for this matchup.
Game Information
StageWeek 3
Season2026
KickoffFri, Sep 18, 7:30 pm
VenueAllegacy Federal Credit Union Stadium
LocationWinston-Salem, NC
SurfaceArtificial Turf
BroadcastESPN
Attendance32,147
Division Standings
FBS — Atlantic Coast Conference
| Team | W | L | T | Pct | PF | PA | Home | Away | Strk |
|---|---|---|---|---|---|---|---|---|---|
| Miami | 8 | 0 | 0 | 1.000 | 381 | 142 | 4-0 | 4-0 | W8 |
 Duke | 6 | 2 | 0 | 0.750 | 256 | 114 | 4-1 | 2-1 | W2 |
 Pittsburgh | 6 | 3 | 0 | 0.667 | 287 | 178 | 5-1 | 1-2 | W1 |
 California | 3 | 6 | 0 | 0.333 | 197 | 284 | 2-3 | 1-3 | L3 |
 Clemson | 5 | 3 | 0 | 0.625 | 186 | 173 | 3-2 | 2-1 | W1 |
 Louisville | 5 | 3 | 0 | 0.625 | 323 | 216 | 4-1 | 1-2 | W3 |
 Virginia | 4 | 5 | 0 | 0.444 | 233 | 208 | 4-2 | 0-3 | L3 |
 SMU | 6 | 2 | 0 | 0.750 | 282 | 178 | 5-0 | 1-2 | L1 |
 Virginia Tech | 6 | 2 | 0 | 0.750 | 280 | 164 | 3-1 | 3-1 | W2 |
 Boston College | 4 | 4 | 0 | 0.500 | 173 | 212 | 3-1 | 1-3 | L1 |
 Georgia Tech | 2 | 6 | 0 | 0.250 | 198 | 246 | 2-3 | 0-3 | L3 |
 North Carolina | 4 | 4 | 0 | 0.500 | 206 | 184 | 1-3 | 3-1 | L2 |
| Wake Forest | 7 | 1 | 0 | 0.875 | 313 | 143 | 3-1 | 4-0 | W5 |
 Florida State | 3 | 5 | 0 | 0.375 | 245 | 231 | 3-2 | 0-3 | L3 |
 NC State | 4 | 4 | 0 | 0.500 | 257 | 207 | 4-1 | 0-3 | W1 |
 Stanford | 4 | 5 | 0 | 0.444 | 183 | 336 | 4-1 | 0-4 | L1 |
 Syracuse | 4 | 4 | 0 | 0.500 | 251 | 211 | 2-2 | 2-2 | W2 |
Miami
1st in ACC
VS
Wake Forest
2nd in ACC
Quarterbacks & Specialists
#94
Dylan Joyce
#10
Darian Mensah
Receivers & Backs
#18
Cooper Barkate
#6
CharMar Brown
#4
Mark Fletcher Jr.
#9
Elija Lofton
#21
Javian Mallory
#3
Joshua Moore
Girard Pringle Jr.
#1
Malachi Toney
#7
Daylyn Upshaw
Defensive Line & Linebackers
#18
Armondo Blount
#11
Kamal Bonner
#97
Keona Davis
#8
Marquise Lightfoot
#17
Ezekiel Marcelin Jr.
#99
Ahmad Moten Sr.
#5
Justin Scott
#9
Chase Smith
#1
Mohamed Toure
#10
Damon Wilson II
Defensive Backs
#2
Damari Brown
#25
JJ Dunnigan
#3
Bryce Fitzgerald
#24
Ethan O'Connor
#7
Zechariah Poyser
Omar Thornton
#35
Monroe Toney
Other
#22
Jake Weinberg
Quarterbacks & Specialists
#45
Ethan Hyams
#3
Gio Lopez
#6
Steele Pizzella
Receivers & Backs
#84
Dominick Barry
#4
Ty Clark III
#1
KD Daniels
#18
Drayden Dickmann
#10
Jack Foley
#8
Carlos Hernandez
#12
Kamrean Johnson
#22
Deuce Lawrence
#85
Will Loerzel
#14
Antonio Meeks
#5
Kam Shanks
Defensive Line & Linebackers
#52
Dallas Afalava
#43
Frank Cusano
#55
Kadear Dembele
#46
Deuce Dyce
#23
Vincent Firenze
#21
Aiden Hall
#9
Camden Hardy
#11
Langston Hardy
#97
Matt Herron
#10
Gabe Kirschke
#94
Zach Lohavichan
Defensive Backs
#2
Deuce Blades II
#38
Somad Eaddy
#8
Braylon Johnson
#5
Davaughn Patterson
#17
Zamari Stevenson
#6
Rushaun Tongue
#22
Myles Turpin
#13
Ashaad Williams
Other
#90
Connor Calvert
Miami
1st in ACC
VS
Wake Forest
2nd in ACC
Passing
80.3
Completion Percentage
67.1
208
Completions
159
0.80
Interception Percentage
0.40
2
Interceptions
1
61
Longest Pass
78
2,659
Net Passing Yards
2,261
332.4
Net Passing Yards Per Game
282.6
259
Passing Attempts
237
10.80
Passing Touchdown %
7.60
28
Passing Touchdowns
18
200.9
Passer Rating
171.2
10
Total Sacks
12
58
Sack Yards Lost
78
10.3
Yards Per Pass Attempt
9.5
2,659
Passing Yards
2,261
0
Passing Fumbles Lost
0
8
Team Games Played
8
534.9
Yards Per Game
457.4
47.6
Total Points Per Game
39.1
381
Total Points
313
51
Total Touchdowns
39
332.4
Passing Yards Per Game
282.6
208-259
Comp-Att
159-237
10-58
Sacks-Yards Lost
12-78
Rushing
295
Rushing Attempts
292
1,620
Rushing Yards
1,398
5.5
Yards Per Rush Attempt
4.8
52
Long Rushing
57
0
20+ Yard Rushing Plays
0
22
Rushing Touchdowns
21
202.5
Rushing Yards Per Game
174.8
0
Rushing Fumbles
0
0
Rushing Fumbles Lost
0
81
Rushing 1st downs
78
8
Team Games Played
8
4,279
Total Yards
3,659
564
Total Offensive Plays
541
47.6
Total Points Per Game
39.1
381
Total Points
313
51
Total Touchdowns
39
Receiving
208
Receptions
159
0
Receiving Targets
0
2,659
Receiving Yards
2,261
2,659
Receiving Yards
2,261
28
Receiving Touchdowns
18
61
Long Reception
78
0
20+ Yard Receiving Plays
0
332.4
Receiving Yards Per Game
282.6
0
Receiving Fumbles
0
0
Receiving Fumbles Lost
0
1399
Receiving Yards After Catch
1030
126
Receiving First Downs
89
8
Team Games Played
8
12.8
Yards Per Reception
14.2
47.6
Total Points Per Game
39.1
381
Total Points
313
51
Total Touchdowns
39
Miscellaneous
224
Total 1st downs
185
81
Rushing 1st downs
78
126
Passing 1st downs
89
16
1st downs by penalty
18
48
Third Down Conversions
52
88
Third Down Attempts
102
54.55
3rd down %
50.98
4
Fourth Down Conversions
9
9
First Downs Attempts
12
44.44
4th down %
75.00
51
Total Penalties
66
470
Total Penalty Yards
634
16259
Possession Time Seconds
13833
0.00
Red Zone Field Goal Percentage
0.00
0.00
Red Zone Scoring Percentage
0.00
0.00
Red Zone Efficiency Percentage
0.00
0.00
Red Zone Touchdown Percentage
0.00
8
Total Takeaways
5
3
Total Giveaways
3
5
Turnover Ratio
2
0
Fumbles Lost
0
48-88
3rd down efficiency
52-102
4-9
4th down efficiency
9-12
51-470
Total-Yards
66-634
Defense
247
Solo Tackles
268
188
Assist Tackles
346
435
Total Tackles
614
24
Sacks
20
132
Sack Yards
167
56
Stuffs
70
22
Passes Defended
29
15.8
Average Interception Yards
0.0
39
Long Interception
2
0
Miscellaneous Touchdowns
0
0
Kicks Blocked
2
36
Tackles For Loss
41
8
Team Games Played
8
Defensive Interceptions
4
Interceptions
3
63
Interception Yards
0
1
Interception Touchdowns
0
4-63
INT: Total
3-0
General
4
Fumbles
9
5
Forced Fumbles
3
6
Fumbles Recovered
4
0
Fumbles Touchdowns
0
8
Games Played
8
4-0
Fumbles-Lost
9-0
Returning
13
Kick Returns
9
250
Kick Return Yards
194
19.2
Yards Per Kick Return
21.6
27
Long Kick Return
27
0
Kick Return Touchdowns
0
10
Punt Returns
11
117
Punt Return Yards
160
11.7
Yards Per Punt Return
14.5
42
Long Punt Return
64
0
Punt Return Touchdowns
0
0
Punt Return Fair Catches
0
0
Kick Return Fumbles Lost
0
0
Punt Return Fumbles Lost
0
8
Team Games Played
8
10-117
Punt: Total
11-160
Kicking
7
Field Goal Made
13
8
Field Goal Attempts
14
87.5
Field Goal Percentage
92.9
50
Long Field Goal Made
45
0
Field Goal Attempts 1-19
0
3
Field Goal Attempts 20-29
6
1
Field Goal Attempts 30-39
5
2
Field Goal Attempts 40-49
3
2
Field Goal Attempts 50+
0
50
Extra Points Made
34
50
Extra Point Attempts
34
100.0
Extra Point Percentage
100.0
0
Field Goals Made 1-19
0
3
Field Goals Made 20-29
6
1
Field Goals Made 30-39
4
2
Field Goals Made 40-49
3
1
Field Goals Made 50+
0
71
Total Kicking Points
73
8
Team Games Played
8
88
Touchback Percentage
67
0.0
Average Kickoff Return Yards
0.0
0
Kickoff Return Yards
0
0
Kickoff Returns
0
0-0
Kickoffs: Total
0-0
7-8
FG: Good-Attempts
13-14
Punting
19
Punts
22
856
Punt Yards
1,005
54
Long Punt
70
45.1
Gross Average Punt Yards
45.7
45.1
Net Average Punt Yards
45.7
0
Punts Blocked
0
7
Punts Inside 20
7
1
Touchbacks
1
10
Fair Catches
9
6
Punt Returns
3
0
Punt Return Yards
0
0.0
Average Punt Return Yards
0.0
8
Team Games Played
8
19-856
Punt: Total Yards
22-1,005
Scoring
22
Rushing Touchdowns
21
28
Receiving Touchdowns
18
0
Return Touchdowns
0
50
Total Touchdowns
39
7
Field Goals
13
50
Kick Extra Points
34
1
Total Two Point Conversions
3
381
Total Points
313
47.6
Total Points Per Game
39.1