

Missouri vs Kansas Live Score (12 Sep, 2026)
Score by Quarter
| Team | Q1 | Q2 | Q3 | Q4 | Final |
|---|---|---|---|---|---|
 Missouri |
0 | 14 | 14 | 10 | 38 |
 Kansas |
0 | 14 | 7 | 0 | 21 |
Scoring Plays
Q2
7:16
7:16
Austin Alexander 88 Yd Return of Blocked Field Goal (Martin Connington Kick)
Blocked Field Goal Touchdown
0 – 7
Q2
5:22
5:22
Jamal Roberts 64 Yd Run (Blake Craig Kick)
Rushing Touchdown
7 – 7
Q2
1:48
1:48
Nik McMillan 20 Yd pass from Isaiah Marshall (Martin Connington Kick)
Passing Touchdown
7 – 14
Q2
0:30
0:30
Cayden Lee 27 Yd pass from Austin Simmons (Blake Craig Kick)
Passing Touchdown
14 – 14
Q3
11:40
11:40
Donovan Olugbode 8 Yd pass from Austin Simmons (Blake Craig Kick)
Passing Touchdown
21 – 14
Q3
10:52
10:52
Xai'Shaun Edwards 10 Yd Run (Blake Craig Kick)
Rushing Touchdown
28 – 14
Q3
2:07
2:07
Nahzae Cox 10 Yd pass from Isaiah Marshall (Martin Connington Kick)
Passing Touchdown
28 – 21
Q4
11:46
11:46
Blake Craig 32 Yd Field Goal
Field Goal Good
31 – 21
Q4
2:02
2:02
Brett Norfleet 13 Yd pass from Austin Simmons (Blake Craig Kick)
Passing Touchdown
38 – 21
Game Leaders
MissouriKansas
 A. Simmons QB
Passing Yards
 I. Marshall QB
 J. Roberts RB
Rushing Yards
 D. Edwards RB
 D. Olugbode WR
Receiving Yards
 N. McMillan WR
 D. Simpson DT
Sacks
—
 N. Rodriguez LB
Tackles
 T. Lathan LB
Player Box Score
Missouri| Player | C/ATT | YDS | AVG | TD | INT | QBR |
|---|---|---|---|---|---|---|
| Austin Simmons#13 | 19/29 | 292 | 10.1 | 3 | 0 | 86.3 |
 Matt Zollers#5 | 0/1 | 0 | 0.0 | 0 | 0 | -- |
Kansas| Player | C/ATT | YDS | AVG | TD | INT | QBR |
|---|---|---|---|---|---|---|
| Isaiah Marshall#8 | 13/30 | 168 | 5.6 | 2 | 2 | 20.7 |
 Cole Ballard#15 | 1/1 | 6 | 6.0 | 0 | 0 | -- |
Missouri| Player | CAR | YDS | AVG | TD | LONG |
|---|---|---|---|---|---|
| Jamal Roberts#20 | 28 | 125 | 4.5 | 1 | 64 |
 Xai'Shaun Edwards#24 | 10 | 45 | 4.5 | 1 | 10 |
| Austin Simmons#13 | 2 | 8 | 4.0 | 0 | 6 |
 Team | 1 | -1 | -1.0 | 0 | 0 |
Kansas| Player | CAR | YDS | AVG | TD | LONG |
|---|---|---|---|---|---|
| Dylan Edwards#1 | 6 | 39 | 6.5 | 0 | 24 |
| Isaiah Marshall#8 | 20 | 23 | 1.2 | 0 | 10 |
 Yasin Willis#6 | 8 | 18 | 2.3 | 0 | 7 |
 Tate Nagy#11 | 1 | 1 | 1.0 | 0 | 1 |
| Team | 1 | 0 | 0.0 | 0 | 0 |
Missouri| Player | REC | YDS | AVG | TD | LONG |
|---|---|---|---|---|---|
| Donovan Olugbode#1 | 6 | 121 | 20.2 | 1 | 65 |
 Cayden Lee#19 | 6 | 120 | 20.0 | 1 | 27 |
 Brett Norfleet#87 | 3 | 23 | 7.7 | 1 | 13 |
 Shaun Terry II#4 | 2 | 20 | 10.0 | 0 | 12 |
 Naeshaun Montgomery | 1 | 12 | 12.0 | 0 | 12 |
| Jamal Roberts#20 | 1 | -4 | -4.0 | 0 | 0 |
Kansas| Player | REC | YDS | AVG | TD | LONG |
|---|---|---|---|---|---|
| Nik McMillan#5 | 2 | 52 | 26.0 | 1 | 32 |
 Keaton Kubecka#3 | 3 | 38 | 12.7 | 0 | 21 |
 Carson Bruhn#44 | 2 | 34 | 17.0 | 0 | 18 |
| Dylan Edwards#1 | 1 | 18 | 18.0 | 0 | 18 |
 Nahzae Cox | 1 | 10 | 10.0 | 1 | 10 |
| Yasin Willis#6 | 2 | 10 | 5.0 | 0 | 9 |
| Isaiah Marshall#8 | 1 | 6 | 6.0 | 0 | 6 |
 Cam Pickett#7 | 2 | 6 | 3.0 | 0 | 3 |
Missouri| Player | TOT | SOLO | SACKS | TFL | PD | QB HUR | TD |
|---|---|---|---|---|---|---|---|
| Nicholas Rodriguez#5 | 8 | 8 | 1 | 1 | 0 | 0 | 0 |
 Robert Woodyard Jr. | 6 | 5 | 0 | 0 | 0 | 0 | 0 |
 Santana Banner#15 | 6 | 5 | 0 | 0 | 1 | 0 | 0 |
 Kensley Louidor-Faustin#7 | 4 | 3 | 0 | 1.5 | 1 | 0 | 0 |
 Elijah Dotson#22 | 3 | 3 | 0 | 0 | 0 | 0 | 0 |
 Sione Laulea#2 | 3 | 3 | 0 | 0 | 3 | 0 | 0 |
 Daeden Hopkins#10 | 3 | 2 | 1.5 | 1.5 | 0 | 0 | 0 |
 Darris Smith#19 | 3 | 2 | 0 | 1.5 | 0 | 1 | 0 |
 Jeremiah Beasley#6 | 2 | 2 | 0 | 0 | 0 | 0 | 0 |
 Trajen Greco#4 | 2 | 2 | 0 | 0 | 0 | 0 | 0 |
 Langden Kitchen#11 | 2 | 2 | 0 | 0 | 0 | 0 | 0 |
| Donta Simpson#8 | 2 | 1 | 1.5 | 1.5 | 0 | 0 | 0 |
 Sterling Webb#90 | 2 | 0 | 0 | 0 | 0 | 0 | 0 |
 Chris Graves Jr.#1 | 1 | 1 | 0 | 0 | 1 | 0 | 0 |
 Jahlil Florence#21 | 1 | 1 | 0 | 0 | 0 | 0 | 0 |
Kansas| Player | TOT | SOLO | SACKS | TFL | PD | QB HUR | TD |
|---|---|---|---|---|---|---|---|
| Trey Lathan#4 | 9 | 5 | 0 | 0.5 | 0 | 0 | 0 |
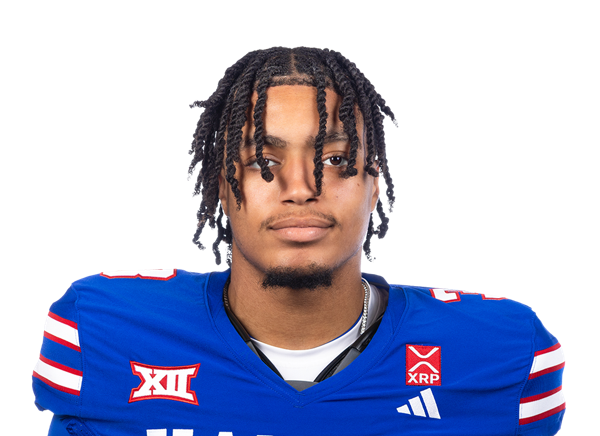 Corey Gordon#3 | 7 | 5 | 0 | 1 | 1 | 0 | 0 |
 David Santiago#44 | 5 | 3 | 0 | 1 | 0 | 0 | 0 |
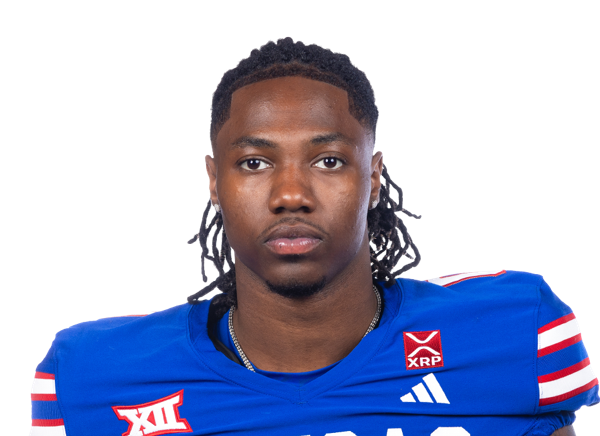 Austin Alexander | 4 | 3 | 0 | 0 | 0 | 0 | 0 |
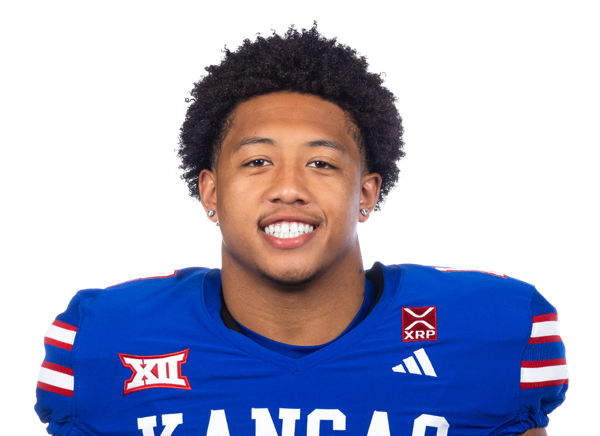 Quincy Davis#13 | 4 | 3 | 0 | 1 | 0 | 0 | 0 |
 Mason Ellis#23 | 4 | 2 | 0 | 0 | 0 | 0 | 0 |
 Dakyus Brinkley#9 | 4 | 2 | 0 | 0.5 | 0 | 0 | 0 |
 Jalen Todd#1 | 4 | 2 | 0 | 0 | 0 | 0 | 0 |
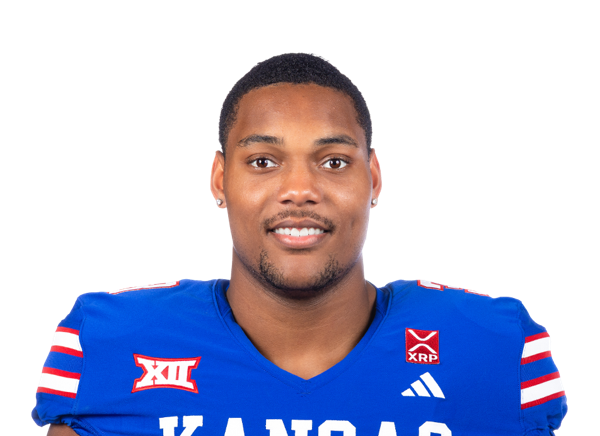 Leroy Harris III#33 | 4 | 2 | 0 | 0 | 2 | 0 | 0 |
 Taylor Davis#27 | 3 | 3 | 0 | 0 | 0 | 0 | 0 |
 Roman Pearson#5 | 3 | 2 | 0 | 0 | 0 | 0 | 0 |
 Marcus Calvin#56 | 3 | 1 | 0 | 0.5 | 0 | 0 | 0 |
 Alex Bray#91 | 3 | 1 | 0 | 0 | 0 | 0 | 0 |
 Blake Herold#94 | 2 | 2 | 0 | 0 | 0 | 0 | 0 |
 Elijah Cannon#10 | 2 | 2 | 0 | 0 | 1 | 0 | 0 |
 Eamon Smalls#99 | 2 | 0 | 0 | 0 | 0 | 0 | 0 |
| Carson Bruhn#44 | 1 | 1 | 0 | 0 | 0 | 0 | 0 |
 Khijohnn Cummings-Coleman#22 | 1 | 1 | 0 | 0 | 0 | 0 | 0 |
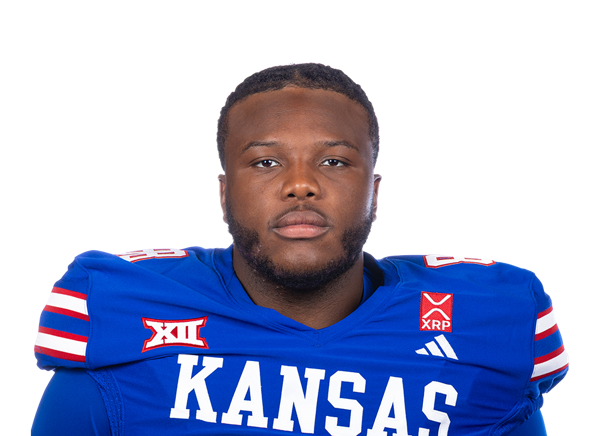 Kevin Oatis#88 | 1 | 0 | 0 | 0.5 | 0 | 0 | 0 |
Missouri| Player | FUM | LOST | REC |
|---|---|---|---|
| Jamal Roberts#20 | 2 | 1 | 0 |
| Team | 1 | 0 | 0 |
| Robert Woodyard Jr. | 0 | 0 | 1 |
Kansas| Player | FUM | LOST | REC |
|---|---|---|---|
| Isaiah Marshall#8 | 3 | 1 | 0 |
| Dylan Edwards#1 | 1 | 0 | 0 |
| Taylor Davis#27 | 0 | 0 | 1 |
Missouri| Player | FG | PCT | LONG | XP | PTS |
|---|---|---|---|---|---|
 Blake Craig#19 | 1/3 | 33.0 | 32 | 5/5 | 8 |
Kansas| Player | FG | PCT | LONG | XP | PTS |
|---|---|---|---|---|---|
 Martin Connington#29 | 0/1 | 0.0 | 0 | 3/3 | 3 |
Missouri| Player | NO | YDS | AVG | TB | In 20 | LONG |
|---|---|---|---|---|---|---|
 Brunno Reus#40 | 4 | 202 | 50.5 | 1 | 1 | 66 |
Kansas| Player | NO | YDS | AVG | TB | In 20 | LONG |
|---|---|---|---|---|---|---|
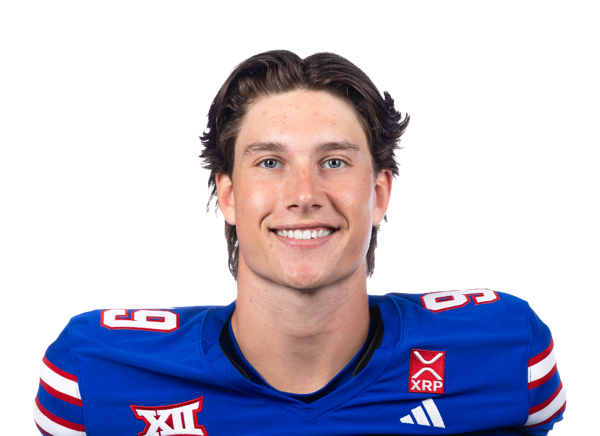 Matthew Gill#99 | 4 | 158 | 39.5 | 0 | 1 | 44 |
Missouri| Player | NO | YDS | AVG | LONG | TD |
|---|---|---|---|---|---|
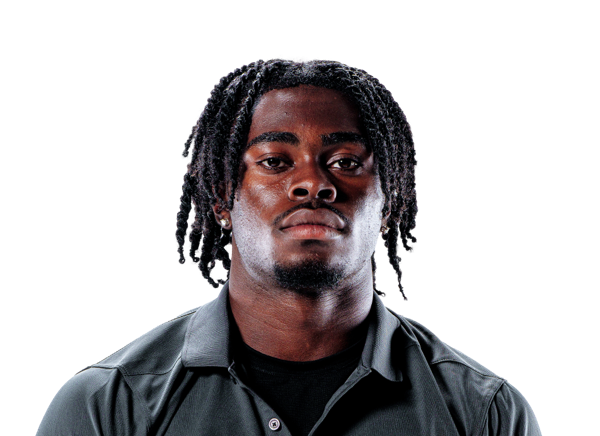 DaMarion Fowlkes#3 | 1 | 18 | 18.0 | 18 | 0 |
Kansas| Player | NO | YDS | AVG | LONG | TD |
|---|---|---|---|---|---|
| Dylan Edwards#1 | 1 | 17 | 17.0 | 17 | 0 |
Missouri| Player | INT | YDS | TD |
|---|---|---|---|
| Robert Woodyard Jr. | 1 | 27 | 0 |
| Jahlil Florence#21 | 1 | 0 | 0 |
Drive Summary
KU
Punt
1
MIZ
Punt
4
KU
Punt
36
MIZ
Missed FG
72
KU
Interception
35
MIZ
Fumble
27
KU
Missed FG
0
MIZ
Touchdown
55
MIZ
Touchdown
75
KU
Touchdown
75
MIZ
Touchdown
75
KU
End of Half
3
MIZ
Punt
0
KU
Fumble
2
MIZ
Touchdown
34
KU
Interception
0
MIZ
Touchdown
12
KU
Punt
6
MIZ
Punt
8
KU
Touchdown
83
MIZ
Field Goal
61
KU
Punt
22
MIZ
Punt
19
KU
Downs
-6
MIZ
Touchdown
14
KU
Downs
-12
MIZ
End of Game
6
Injury Report
No current injury report is available for this matchup.
Head-to-Head
Historical meetings are not available for this matchup.
Game Information
StageWeek 2
Season2026
KickoffFri, Sep 11, 8:00 pm
VenueDavid Booth Kansas Memorial Stadium
LocationLawrence, KS
SurfaceArtificial Turf
BroadcastFOX
Attendance32,000
Division Standings
FBS — Southeastern Conference
| Team | W | L | T | Pct | PF | PA | Home | Away | Strk |
|---|---|---|---|---|---|---|---|---|---|
 Alabama | 8 | 2 | 0 | 0.800 | 358 | 189 | 4-1 | 4-1 | W3 |
 Auburn | 6 | 4 | 0 | 0.600 | 260 | 246 | 4-2 | 2-2 | W2 |
 Florida | 6 | 4 | 0 | 0.600 | 313 | 262 | 3-2 | 3-2 | W1 |
 Georgia | 9 | 1 | 0 | 0.900 | 418 | 147 | 6-1 | 3-0 | W3 |
 LSU | 6 | 4 | 0 | 0.600 | 355 | 181 | 5-2 | 1-2 | L2 |
 Mississippi State | 4 | 6 | 0 | 0.400 | 245 | 291 | 2-4 | 2-2 | L6 |
| Missouri | 6 | 4 | 0 | 0.600 | 293 | 229 | 4-1 | 2-3 | L2 |
 Ole Miss | 6 | 3 | 0 | 0.667 | 304 | 234 | 5-1 | 1-2 | L1 |
 South Carolina | 6 | 4 | 0 | 0.600 | 318 | 245 | 4-2 | 2-2 | L1 |
 Tennessee | 8 | 2 | 0 | 0.800 | 314 | 143 | 5-1 | 3-1 | W2 |
 Texas | 8 | 2 | 0 | 0.800 | 302 | 178 | 5-1 | 3-1 | W4 |
 Texas A&M | 4 | 6 | 0 | 0.400 | 242 | 190 | 4-2 | 0-4 | L3 |
 Vanderbilt | 4 | 6 | 0 | 0.400 | 213 | 286 | 3-3 | 1-3 | L1 |
 Arkansas | 4 | 6 | 0 | 0.400 | 214 | 253 | 3-3 | 1-3 | W1 |
 Oklahoma | 5 | 4 | 0 | 0.556 | 199 | 173 | 3-2 | 2-2 | W1 |
 Kentucky | 7 | 3 | 0 | 0.700 | 283 | 253 | 4-2 | 3-1 | L2 |
FBS — Big 12 Conference
| Team | W | L | T | Pct | PF | PA | Home | Away | Strk |
|---|---|---|---|---|---|---|---|---|---|
 BYU | 8 | 2 | 0 | 0.800 | 307 | 185 | 6-0 | 2-2 | W1 |
 Cincinnati | 5 | 5 | 0 | 0.500 | 310 | 306 | 5-1 | 0-4 | L3 |
 Colorado | 4 | 6 | 0 | 0.400 | 220 | 287 | 3-2 | 1-4 | W1 |
 Houston | 7 | 3 | 0 | 0.700 | 351 | 234 | 5-0 | 2-3 | L1 |
 Kansas State | 4 | 6 | 0 | 0.400 | 292 | 261 | 4-2 | 0-4 | L4 |
 Texas Tech | 8 | 1 | 0 | 0.889 | 338 | 217 | 6-0 | 2-1 | W2 |
 Utah | 9 | 0 | 0 | 1.000 | 339 | 147 | 6-0 | 3-0 | W9 |
 West Virginia | 5 | 5 | 0 | 0.500 | 349 | 348 | 3-3 | 2-2 | L2 |
 Arizona State | 6 | 4 | 0 | 0.600 | 282 | 259 | 4-1 | 2-3 | W2 |
 Baylor | 6 | 4 | 0 | 0.600 | 294 | 181 | 4-1 | 2-3 | L1 |
 Iowa State | 5 | 6 | 0 | 0.455 | 321 | 321 | 5-1 | 0-5 | L1 |
| Kansas | 4 | 6 | 0 | 0.400 | 302 | 237 | 3-3 | 1-3 | W1 |
 Oklahoma State | 6 | 3 | 0 | 0.667 | 395 | 245 | 4-0 | 2-3 | W1 |
 TCU | 5 | 5 | 0 | 0.500 | 234 | 152 | 4-3 | 1-2 | W1 |
 UCF | 6 | 5 | 0 | 0.545 | 332 | 277 | 5-2 | 1-3 | W1 |
 Arizona | 7 | 2 | 0 | 0.778 | 308 | 179 | 5-0 | 2-2 | W1 |
Missouri
6th in SEC
VS
Kansas
12th in Big 12
Quarterbacks & Specialists
#13
Austin Simmons
#5
Matt Zollers
Receivers & Backs
#24
Xai'Shaun Edwards
#3
DaMarion Fowlkes
#19
Cayden Lee
Naeshaun Montgomery
#87
Brett Norfleet
#1
Donovan Olugbode
#20
Jamal Roberts
#4
Shaun Terry II
Defensive Line & Linebackers
#6
Jeremiah Beasley
#5
Nicholas Rodriguez
#8
Donta Simpson
#90
Sterling Webb
Robert Woodyard Jr.
Defensive Backs
#15
Santana Banner
#22
Elijah Dotson
#21
Jahlil Florence
#1
Chris Graves Jr.
#4
Trajen Greco
#2
Sione Laulea
#7
Kensley Louidor-Faustin
Other
#19
Blake Craig
#10
Daeden Hopkins
#11
Langden Kitchen
#40
Brunno Reus
#19
Darris Smith
Quarterbacks & Specialists
#15
Cole Ballard
#99
Matthew Gill
#8
Isaiah Marshall
Receivers & Backs
#44
Carson Bruhn
Nahzae Cox
#1
Dylan Edwards
#3
Keaton Kubecka
#5
Nik McMillan
#11
Tate Nagy
#7
Cam Pickett
#6
Yasin Willis
Defensive Line & Linebackers
#91
Alex Bray
#9
Dakyus Brinkley
#56
Marcus Calvin
#13
Quincy Davis
#33
Leroy Harris III
#94
Blake Herold
#4
Trey Lathan
#88
Kevin Oatis
#44
David Santiago
#99
Eamon Smalls
Defensive Backs
Austin Alexander
#10
Elijah Cannon
#22
Khijohnn Cummings-Coleman
#27
Taylor Davis
#23
Mason Ellis
#3
Corey Gordon
#5
Roman Pearson
#1
Jalen Todd
Other
#29
Martin Connington
Missouri
11th in SEC
VS
Kansas
12th in Big 12
Passing
61.4
Completion Percentage
57.9
202
Completions
169
0.90
Interception Percentage
3.10
3
Interceptions
9
72
Longest Pass
50
2,493
Net Passing Yards
2,314
249.3
Net Passing Yards Per Game
231.4
329
Passing Attempts
292
6.40
Passing Touchdown %
4.10
21
Passing Touchdowns
12
144.5
Passer Rating
131.6
9
Total Sacks
13
46
Sack Yards Lost
82
7.6
Yards Per Pass Attempt
7.9
2,493
Passing Yards
2,314
0
Passing Fumbles Lost
0
10
Team Games Played
10
401.9
Yards Per Game
442.1
29.3
Total Points Per Game
30.2
293
Total Points
302
35
Total Touchdowns
38
249.3
Passing Yards Per Game
231.4
202-329
Comp-Att
169-292
9-46
Sacks-Yards Lost
13-82
Rushing
347
Rushing Attempts
437
1,526
Rushing Yards
2,107
4.4
Yards Per Rush Attempt
4.8
80
Long Rushing
50
0
20+ Yard Rushing Plays
0
12
Rushing Touchdowns
23
152.6
Rushing Yards Per Game
210.7
0
Rushing Fumbles
0
0
Rushing Fumbles Lost
0
71
Rushing 1st downs
109
10
Team Games Played
10
4,019
Total Yards
4,421
685
Total Offensive Plays
742
29.3
Total Points Per Game
30.2
293
Total Points
302
35
Total Touchdowns
38
Receiving
202
Receptions
169
0
Receiving Targets
0
2,493
Receiving Yards
2,314
2,493
Receiving Yards
2,314
21
Receiving Touchdowns
12
72
Long Reception
50
0
20+ Yard Receiving Plays
0
249.3
Receiving Yards Per Game
231.4
0
Receiving Fumbles
0
0
Receiving Fumbles Lost
0
1086
Receiving Yards After Catch
984
115
Receiving First Downs
96
10
Team Games Played
10
12.3
Yards Per Reception
13.7
29.3
Total Points Per Game
30.2
293
Total Points
302
35
Total Touchdowns
38
Miscellaneous
205
Total 1st downs
226
71
Rushing 1st downs
109
115
Passing 1st downs
96
18
1st downs by penalty
20
52
Third Down Conversions
56
140
Third Down Attempts
148
37.14
3rd down %
37.84
7
Fourth Down Conversions
17
13
First Downs Attempts
32
53.85
4th down %
53.13
63
Total Penalties
62
582
Total Penalty Yards
564
17659
Possession Time Seconds
19011
0.00
Red Zone Field Goal Percentage
0.00
0.00
Red Zone Scoring Percentage
0.00
0.00
Red Zone Efficiency Percentage
0.00
0.00
Red Zone Touchdown Percentage
0.00
15
Total Takeaways
18
7
Total Giveaways
16
8
Turnover Ratio
2
0
Fumbles Lost
0
52-140
3rd down efficiency
56-148
7-13
4th down efficiency
17-32
63-582
Total-Yards
62-564
Defense
291
Solo Tackles
361
394
Assist Tackles
242
685
Total Tackles
603
22
Sacks
21
160
Sack Yards
102
85
Stuffs
102
45
Passes Defended
35
13.9
Average Interception Yards
4.5
28
Long Interception
12
0
Miscellaneous Touchdowns
0
0
Kicks Blocked
4
43
Tackles For Loss
51
10
Team Games Played
10
Defensive Interceptions
7
Interceptions
4
97
Interception Yards
18
0
Interception Touchdowns
0
7-97
INT: Total
4-18
General
11
Fumbles
16
14
Forced Fumbles
8
12
Fumbles Recovered
9
1
Fumbles Touchdowns
0
10
Games Played
10
11-0
Fumbles-Lost
16-0
Returning
16
Kick Returns
11
331
Kick Return Yards
269
20.7
Yards Per Kick Return
24.5
54
Long Kick Return
95
0
Kick Return Touchdowns
1
10
Punt Returns
18
150
Punt Return Yards
180
15.0
Yards Per Punt Return
10.0
68
Long Punt Return
72
1
Punt Return Touchdowns
1
0
Punt Return Fair Catches
0
0
Kick Return Fumbles Lost
0
0
Punt Return Fumbles Lost
0
10
Team Games Played
10
10-150
Punt: Total
18-180
Kicking
15
Field Goal Made
13
24
Field Goal Attempts
17
62.5
Field Goal Percentage
76.5
53
Long Field Goal Made
46
0
Field Goal Attempts 1-19
0
5
Field Goal Attempts 20-29
3
10
Field Goal Attempts 30-39
6
2
Field Goal Attempts 40-49
7
7
Field Goal Attempts 50+
1
34
Extra Points Made
33
34
Extra Point Attempts
34
100.0
Extra Point Percentage
97.1
0
Field Goals Made 1-19
0
2
Field Goals Made 20-29
2
7
Field Goals Made 30-39
6
1
Field Goals Made 40-49
5
5
Field Goals Made 50+
0
79
Total Kicking Points
72
10
Team Games Played
10
78
Touchback Percentage
43
0.0
Average Kickoff Return Yards
0.0
0
Kickoff Return Yards
0
0
Kickoff Returns
0
0-0
Kickoffs: Total
0-0
15-24
FG: Good-Attempts
13-17
Punting
48
Punts
35
2,099
Punt Yards
1,418
66
Long Punt
66
43.7
Gross Average Punt Yards
40.5
43.7
Net Average Punt Yards
40.5
0
Punts Blocked
0
16
Punts Inside 20
10
6
Touchbacks
1
16
Fair Catches
9
5
Punt Returns
10
0
Punt Return Yards
0
0.0
Average Punt Return Yards
0.0
10
Team Games Played
10
48-2,099
Punt: Total Yards
35-1,418
Scoring
12
Rushing Touchdowns
23
21
Receiving Touchdowns
12
1
Return Touchdowns
2
35
Total Touchdowns
37
15
Field Goals
13
34
Kick Extra Points
33
1
Total Two Point Conversions
1
293
Total Points
302
29.3
Total Points Per Game
30.2