

Monmouth vs Western Michigan Live Score (12 Sep, 2026)
Score by Quarter
| Team | Q1 | Q2 | Q3 | Q4 | Final |
|---|---|---|---|---|---|
 Monmouth |
0 | 0 | 7 | 7 | 14 |
 Western Michigan |
7 | 14 | 21 | 7 | 49 |
Scoring Plays
Q1
9:26
9:26
B. Lowry pass to B. Brooks for 13 yds, for a TD (D. Kelly KICK)
Passing Touchdown
0 – 7
Q2
10:53
10:53
B. Lowry pass to E. Nelson for 23 yds, for a TD (D. Kelly KICK)
Passing Touchdown
0 – 14
Q2
4:47
4:47
J. Buckley run for 1 yd, for a TD (D. Kelly KICK)
Rushing Touchdown
0 – 21
Q3
14:03
14:03
J. Buckley run for 11 yds, for a TD (D. Kelly KICK)
Rushing Touchdown
0 – 28
Q3
11:20
11:20
F. Weaver pass to T. Neal for 5 yds, for a TD (S. Sholder KICK)
Passing Touchdown
7 – 28
Q3
9:10
9:10
B. Lowry pass to B. Brooks for 12 yds, for a TD (D. Kelly KICK)
Passing Touchdown
7 – 35
Q3
3:55
3:55
J. Buckley run for 1 yd, for a TD (D. Kelly KICK)
Rushing Touchdown
7 – 42
Q4
4:18
4:18
T. Petty pass to R. Brotherton for 21 yds, for a TD (D. Kelly KICK)
Passing Touchdown
7 – 49
Q4
0:15
0:15
N. Treadwell run for 1 yd, for a TD (S. Sholder KICK)
Rushing Touchdown
14 – 49
Game Leaders
MonmouthWestern Michigan
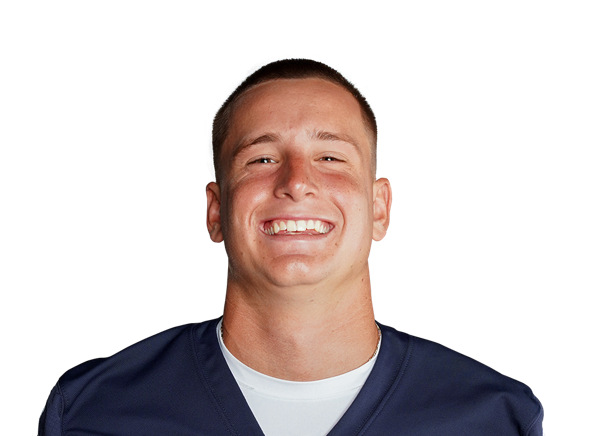 F. Weaver QB
Passing Yards
 B. Lowry QB
 E. Jennings RB
Rushing Yards
B. Lowry QB T. Neal WR
Receiving Yards
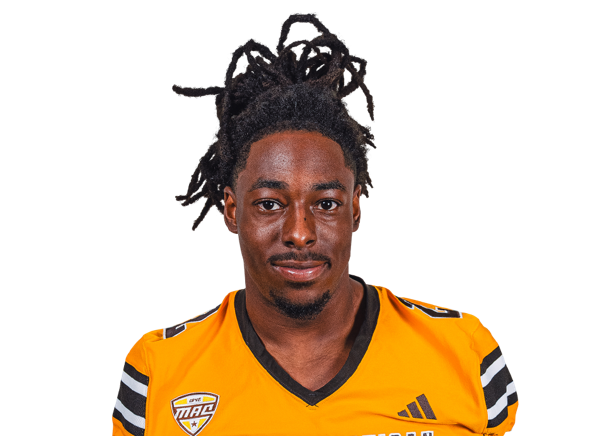 A. Chenault WR
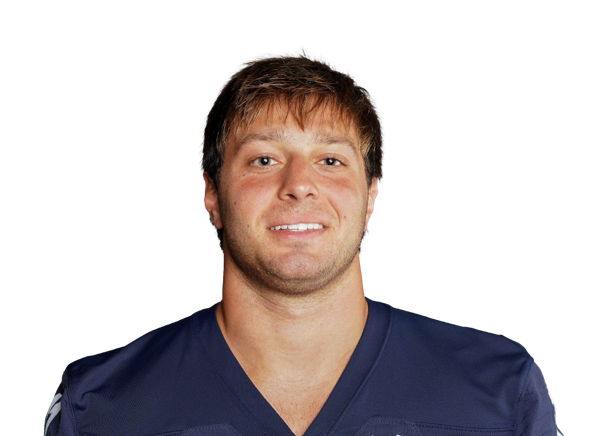 R. Russo LB
Sacks
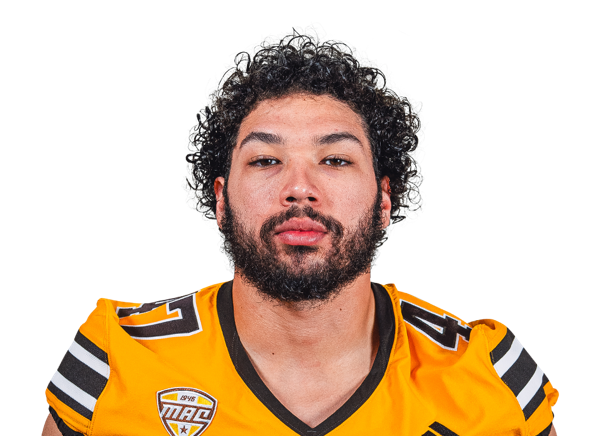 D. Moon LBR. Russo LB
Tackles
D. Moon LBPlayer Box Score
Monmouth| Player | C/ATT | YDS | AVG | TD | INT |
|---|---|---|---|---|---|
| Frankie Weaver#13 | 28/46 | 273 | 5.9 | 1 | 0 |
Western Michigan| Player | C/ATT | YDS | AVG | TD | INT |
|---|---|---|---|---|---|
| Broc Lowry#12 | 14/20 | 212 | 10.6 | 3 | 0 |
 Trey Petty#10 | 4/5 | 54 | 10.8 | 1 | 0 |
Monmouth| Player | CAR | YDS | AVG | TD | LONG |
|---|---|---|---|---|---|
| Elijah Jennings#3 | 19 | 87 | 4.6 | 0 | 15 |
 Kenny Smith Jr.#28 | 18 | 69 | 3.8 | 0 | 16 |
 Nazir Treadwell#28 | 5 | 6 | 1.2 | 1 | 2 |
| Frankie Weaver#13 | 2 | -4 | -2.0 | 0 | 0 |
Western Michigan| Player | CAR | YDS | AVG | TD | LONG |
|---|---|---|---|---|---|
| Broc Lowry#12 | 4 | 40 | 10.0 | 0 | 23 |
| Trey Petty#10 | 4 | 30 | 7.5 | 0 | 9 |
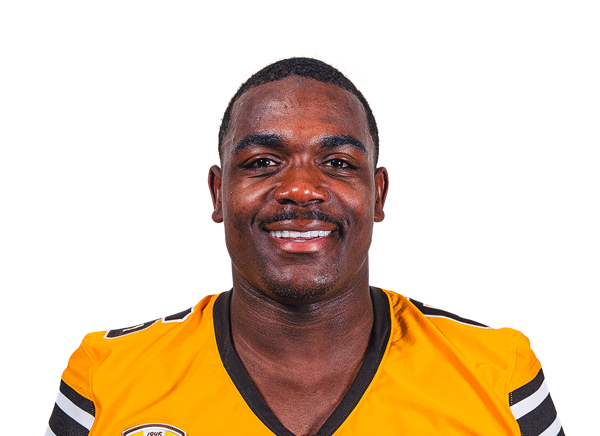 Jalen Buckley#6 | 10 | 28 | 2.8 | 3 | 11 |
 Lolo Mataele#24 | 4 | 28 | 7.0 | 0 | 16 |
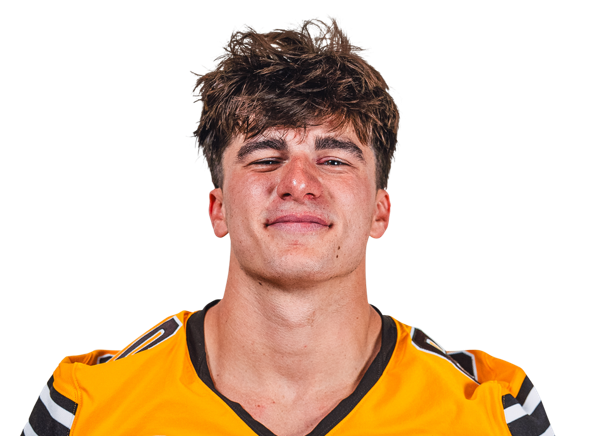 Harper Hughes#80 | 3 | 12 | 4.0 | 0 | 14 |
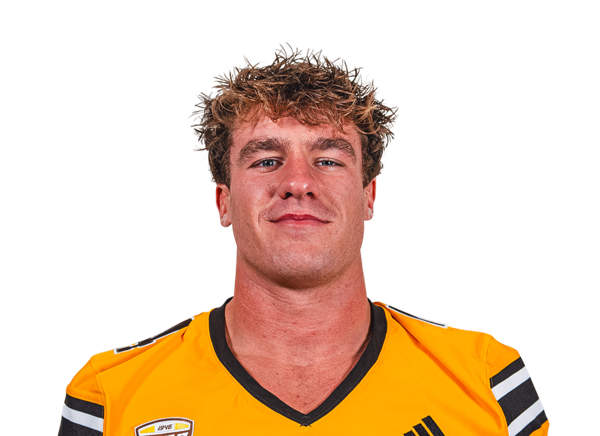 Cole Cabana#4 | 4 | 6 | 1.5 | 0 | 2 |
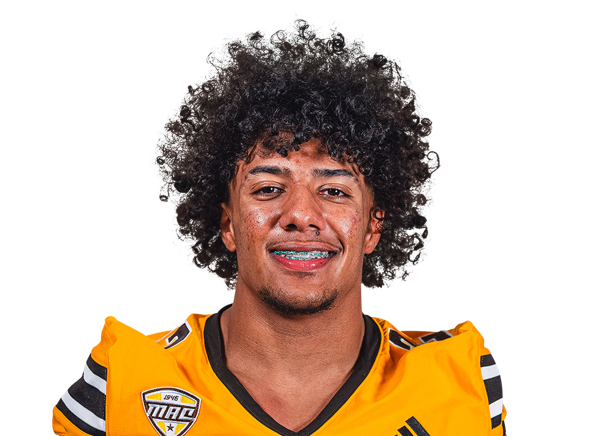 Donovan Triplett#22 | 1 | 3 | 3.0 | 0 | 3 |
 AJ Green Jr. | 1 | 2 | 2.0 | 0 | 2 |
 Team | 1 | -1 | -1.0 | 0 | 1 |
Monmouth| Player | REC | YDS | AVG | TD | LONG |
|---|---|---|---|---|---|
| Tra Neal#7 | 7 | 106 | 15.1 | 1 | 44 |
 Gavin Nelson | 7 | 63 | 9.0 | 0 | 19 |
| Kenny Smith Jr.#28 | 5 | 33 | 6.6 | 0 | 20 |
 Marcus Middleton#88 | 4 | 22 | 5.5 | 0 | 8 |
| Frankie Tackett Jr#36 | 1 | 17 | 17.0 | 0 | 17 |
| Christian Harrison#14 | 1 | 11 | 11.0 | 0 | 11 |
| Elijah Jennings#3 | 2 | 11 | 5.5 | 0 | 6 |
| Nazir Treadwell#28 | 1 | 10 | 10.0 | 0 | 10 |
Western Michigan| Player | REC | YDS | AVG | TD | LONG |
|---|---|---|---|---|---|
| Aveion Chenault#2 | 4 | 101 | 25.3 | 0 | 44 |
 Egypt Nelson#8 | 3 | 39 | 13.0 | 1 | 23 |
 Nate Levicki#88 | 2 | 28 | 14.0 | 0 | 27 |
 Baylin Brooks#7 | 2 | 25 | 12.5 | 2 | 13 |
| Harper Hughes#80 | 2 | 23 | 11.5 | 0 | 18 |
 Ryan Brotherton#83 | 1 | 21 | 21.0 | 1 | 21 |
 Adam Parks#15 | 2 | 12 | 6.0 | 0 | 8 |
| Jalen Buckley#6 | 1 | 9 | 9.0 | 0 | 9 |
 Terence Marshall#11 | 1 | 8 | 8.0 | 0 | 8 |
Monmouth| Player | TOT | SOLO | SACKS | TFL | PD | QB HUR | TD |
|---|---|---|---|---|---|---|---|
| Ryan Russo#1 | 10 | 7 | 1 | 1 | 0 | 0 | 0 |
 Jaeden Jones#2 | 10 | 7 | 0 | 0 | 0 | 0 | 0 |
| Amori McNeil#31 | 5 | 4 | 0 | 1 | 0 | 0 | 0 |
 Christian Palmer Jr#22 | 3 | 3 | 0 | 0 | 0 | 0 | 0 |
 Donovan Fey#26 | 3 | 2 | 0 | 0 | 0 | 0 | 0 |
 Mir Haskett#23 | 3 | 2 | 0 | 0 | 0 | 0 | 0 |
 Charlie Sasso#5 | 2 | 2 | 0 | 0 | 0 | 0 | 0 |
| Jaiden McLendon Parker#16 | 2 | 2 | 0 | 0 | 0 | 0 | 0 |
 Omar Ibrahim#21 | 2 | 0 | 0 | 0 | 2 | 0 | 0 |
 Jahide Lesaine Jr.#99 | 1 | 1 | 0 | 0 | 0 | 0 | 0 |
 Donovan Dyson#44 | 1 | 1 | 0 | 0 | 0 | 0 | 0 |
 Brendan Bigos#90 | 1 | 1 | 0 | 0 | 0 | 0 | 0 |
 Hasson Manning Jr#20 | 1 | 1 | 0 | 0 | 0 | 0 | 0 |
 Hugo Gil#98 | 1 | 1 | 0 | 0 | 0 | 0 | 0 |
 Sebastien Acheampong#96 | 1 | 1 | 0 | 0 | 0 | 0 | 0 |
 Mandel Pettiford Jr#58 | 1 | 1 | 0 | 0 | 0 | 0 | 0 |
 Avery Barnes#50 | 1 | 0 | 0 | 0 | 0 | 0 | 0 |
| Rashee Bell#97 | 1 | 0 | 0 | 0 | 0 | 0 | 0 |
 Mounir Keshen#52 | 1 | 0 | 0 | 0 | 0 | 0 | 0 |
 Alexander Williams#33 | 1 | 0 | 0 | 0 | 0 | 0 | 0 |
| Keisean Johnson-Wilson#93 | 1 | 0 | 0 | 0 | 0 | 0 | 0 |
Western Michigan| Player | TOT | SOLO | SACKS | TFL | PD | QB HUR | TD |
|---|---|---|---|---|---|---|---|
| Domanick Moon#47 | 12 | 3 | 1 | 1.5 | 1 | 0 | 0 |
| Justyce Betts#10 | 11 | 5 | 0 | 0 | 0 | 0 | 0 |
 Daeh McCullough#14 | 7 | 4 | 0 | 0.5 | 1 | 0 | 0 |
 Jarvarius Sims#8 | 7 | 3 | 0 | 0.5 | 0 | 0 | 0 |
 Gabe Welch#42 | 6 | 5 | 0 | 0 | 0 | 0 | 0 |
 Austin Alexander#4 | 6 | 2 | 0 | 0 | 1 | 3 | 0 |
 Dillon Moore#12 | 5 | 3 | 0 | 0.5 | 0 | 0 | 0 |
 Joey Pope#6 | 5 | 2 | 0 | 0 | 1 | 0 | 0 |
 Brenden Anes | 5 | 0 | 0 | 0 | 0 | 0 | 0 |
 Joshua Franklin#1 | 4 | 3 | 0 | 0 | 1 | 0 | 0 |
 Kouri Crump#26 | 4 | 3 | 0 | 0 | 0 | 0 | 0 |
 Micah Davis#18 | 4 | 1 | 0 | 0 | 0 | 0 | 0 |
 Ahmed Tounkara#94 | 4 | 1 | 0 | 0 | 0 | 0 | 0 |
 Zavian Tibbs#41 | 2 | 1 | 0 | 0 | 0 | 0 | 0 |
 Dakari Frazier#98 | 2 | 0 | 0 | 0 | 0 | 1 | 0 |
 Jordon Thomas#13 | 2 | 0 | 0 | 0 | 0 | 0 | 0 |
 Scoop Gardner Jr.#2 | 2 | 0 | 0 | 0 | 0 | 1 | 0 |
 Amarian Louis#22 | 2 | 0 | 0 | 0 | 1 | 0 | 0 |
 Jori Benson#90 | 1 | 1 | 0 | 0 | 0 | 0 | 0 |
 DeJuan Echoles Jr.#31 | 1 | 1 | 0 | 0 | 0 | 0 | 0 |
 Willard Ferrell#20 | 1 | 1 | 0 | 0 | 0 | 0 | 0 |
| Lolo Mataele#24 | 1 | 1 | 0 | 0 | 0 | 0 | 0 |
 Dalton Gustwiller#96 | 1 | 0 | 0 | 0 | 0 | 0 | 0 |
 Gian Carter#7 | 1 | 0 | 0 | 0 | 0 | 1 | 0 |
 Andrew Baker#45 | 1 | 0 | 0 | 0 | 0 | 0 | 0 |
 DeShawn Robinson#95 | 1 | 0 | 0 | 0 | 0 | 0 | 0 |
Monmouth| Player | FUM | LOST | REC |
|---|---|---|---|
| Frankie Weaver#13 | 2 | 1 | 0 |
| Elijah Jennings#3 | 1 | 1 | 0 |
Western Michigan| Player | FUM | LOST | REC |
|---|---|---|---|
| Gian Carter#7 | 0 | 0 | 1 |
| Austin Alexander#4 | 0 | 0 | 1 |
Monmouth| Player | FG | PCT | LONG | XP | PTS |
|---|---|---|---|---|---|
 Sky Sholder#32 | 0/0 | 0.0 | 0 | 2/2 | 2 |
Western Michigan| Player | FG | PCT | LONG | XP | PTS |
|---|---|---|---|---|---|
 Dieter Kelly#32 | 0/0 | 0.0 | 0 | 7/7 | 7 |
Monmouth| Player | NO | YDS | AVG | TB | In 20 | LONG |
|---|---|---|---|---|---|---|
 Luke Schabel#9 | 4 | 164 | 41.0 | 0 | 2 | 46 |
Western Michigan| Player | NO | YDS | AVG | TB | In 20 | LONG |
|---|---|---|---|---|---|---|
 Ryan Millmore#25 | 4 | 195 | 48.8 | 1 | 0 | 56 |
Western Michigan| Player | NO | YDS | AVG | LONG | TD |
|---|---|---|---|---|---|
 Keivin Boone-Nelson II#3 | 1 | 11 | 11.0 | 11 | 0 |
| Nate Levicki#88 | 1 | 9 | 9.0 | 9 | 0 |
| Joshua Franklin#1 | 1 | 0 | 0.0 | 0 | 0 |
Western Michigan| Player | NO | YDS | AVG | LONG | TD |
|---|---|---|---|---|---|
 Kordell Gouldsby#5 | 2 | 80 | 40.0 | 76 | 0 |
Drive Summary
MONM
Punt
24
WMU
Punt
8
MONM
Downs
7
WMU
Touchdown
56
MONM
Punt
20
WMU
Punt
3
MONM
Downs
44
WMU
Touchdown
70
MONM
Punt
12
WMU
Punt
7
MONM
Punt
3
WMU
Touchdown
5
MONM
Fumble
69
WMU
End Of Half
-1
WMU
Touchdown
68
MONM
Touchdown
75
WMU
Touchdown
74
MONM
Downs
18
WMU
Touchdown
43
MONM
Fumble
36
WMU
Punt
11
MONM
Downs
66
WMU
Touchdown
86
MONM
Touchdown
75
WMU
End Of Quarter
3
Injury Report
No current injury report is available for this matchup.
Head-to-Head
Historical meetings are not available for this matchup.
Game Information
StageWeek 2
Season2026
KickoffSat, Sep 12, 6:30 pm
VenueWaldo Stadium
LocationKalamazoo, MI
SurfaceArtificial Turf
BroadcastESPN+
Division Standings
FCS — Coastal Athletic Association
| Team | W | L | T | Pct | PF | PA | Home | Away | Strk |
|---|---|---|---|---|---|---|---|---|---|
 Bryant | 0 | 1 | 0 | 0.000 | 3 | 59 | 0-0 | 0-1 | L1 |
 Rhode Island | 0 | 1 | 0 | 0.000 | 14 | 38 | 0-0 | 0-1 | L1 |
 UAlbany | 0 | 1 | 0 | 0.000 | 17 | 21 | 0-0 | 0-1 | L1 |
 Maine | 0 | 2 | 0 | 0.000 | 19 | 77 | 0-0 | 0-2 | L2 |
| Monmouth | 0 | 1 | 0 | 0.000 | 14 | 49 | 0-0 | 0-1 | L1 |
 Campbell | 0 | 1 | 0 | 0.000 | 3 | 52 | 0-0 | 0-1 | L1 |
 Stony Brook | 0 | 1 | 0 | 0.000 | 17 | 41 | 0-0 | 0-1 | L1 |
 North Carolina A&T | 0 | 1 | 0 | 0.000 | 10 | 59 | 0-0 | 0-1 | L1 |
 Elon | 0 | 1 | 0 | 0.000 | 7 | 34 | 0-0 | 0-1 | L1 |
 Hampton | 0 | 1 | 0 | 0.000 | 0 | 62 | 0-0 | 0-1 | L1 |
 New Hampshire | 0 | 1 | 0 | 0.000 | 3 | 66 | 0-0 | 0-1 | L1 |
 Sacred Heart | 0 | 1 | 0 | 0.000 | 10 | 37 | 0-0 | 0-1 | L1 |
 Towson | 0 | 2 | 0 | 0.000 | 24 | 87 | 0-0 | 0-2 | L2 |
FBS — Mid-American Conference
| Team | W | L | T | Pct | PF | PA | Home | Away | Strk |
|---|---|---|---|---|---|---|---|---|---|
 Eastern Michigan | 4 | 7 | 0 | 0.364 | 226 | 300 | 2-3 | 2-4 | L4 |
 Massachusetts | 5 | 6 | 0 | 0.455 | 276 | 257 | 3-3 | 2-3 | L2 |
 Akron | 2 | 9 | 0 | 0.182 | 220 | 365 | 1-4 | 1-5 | W1 |
 Ball State | 3 | 8 | 0 | 0.273 | 241 | 376 | 2-2 | 1-6 | L3 |
 Buffalo | 8 | 3 | 0 | 0.727 | 283 | 262 | 5-1 | 3-2 | W6 |
 Central Michigan | 5 | 6 | 0 | 0.455 | 227 | 261 | 4-2 | 1-4 | L1 |
 Kent State | 3 | 8 | 0 | 0.273 | 160 | 328 | 3-2 | 0-6 | L3 |
 Miami (OH) | 7 | 4 | 0 | 0.636 | 301 | 260 | 4-2 | 3-2 | W2 |
 Ohio | 8 | 3 | 0 | 0.727 | 317 | 257 | 5-0 | 3-3 | W1 |
 Toledo | 9 | 2 | 0 | 0.818 | 362 | 220 | 6-1 | 3-1 | W5 |
| Western Michigan | 8 | 3 | 0 | 0.727 | 312 | 214 | 4-1 | 4-2 | W3 |
 Bowling Green | 3 | 8 | 0 | 0.273 | 193 | 308 | 2-3 | 1-5 | L1 |
 Sacramento State | 2 | 9 | 0 | 0.182 | 177 | 321 | 2-4 | 0-5 | L2 |
Monmouth
1st in CAA
VS
Western Michigan
2nd in MAC
Quarterbacks & Specialists
#9
Luke Schabel
#13
Frankie Weaver
Receivers & Backs
#14
Christian Harrison
#3
Elijah Jennings
#88
Marcus Middleton
#7
Tra Neal
Gavin Nelson
#28
Kenny Smith Jr.
#36
Frankie Tackett Jr
#28
Nazir Treadwell
Defensive Line & Linebackers
#96
Sebastien Acheampong
#50
Avery Barnes
#97
Rashee Bell
#90
Brendan Bigos
#44
Donovan Dyson
#98
Hugo Gil
#93
Keisean Johnson-Wilson
#52
Mounir Keshen
#99
Jahide Lesaine Jr.
#58
Mandel Pettiford Jr
#1
Ryan Russo
#5
Charlie Sasso
Defensive Backs
#26
Donovan Fey
#23
Mir Haskett
#21
Omar Ibrahim
#2
Jaeden Jones
#20
Hasson Manning Jr
#31
Amori McNeil
#22
Christian Palmer Jr
#33
Alexander Williams
Other
#32
Sky Sholder
Quarterbacks & Specialists
#12
Broc Lowry
#25
Ryan Millmore
#10
Trey Petty
Receivers & Backs
#3
Keivin Boone-Nelson II
#7
Baylin Brooks
#83
Ryan Brotherton
#6
Jalen Buckley
#4
Cole Cabana
#2
Aveion Chenault
#5
Kordell Gouldsby
AJ Green Jr.
#80
Harper Hughes
#88
Nate Levicki
#11
Terence Marshall
#24
Lolo Mataele
#8
Egypt Nelson
#15
Adam Parks
#22
Donovan Triplett
Defensive Line & Linebackers
#4
Austin Alexander
Brenden Anes
#45
Andrew Baker
#90
Jori Benson
#10
Justyce Betts
#7
Gian Carter
#31
DeJuan Echoles Jr.
#98
Dakari Frazier
#2
Scoop Gardner Jr.
#96
Dalton Gustwiller
#47
Domanick Moon
#12
Dillon Moore
#95
DeShawn Robinson
#41
Zavian Tibbs
#94
Ahmed Tounkara
#42
Gabe Welch
Defensive Backs
#26
Kouri Crump
#18
Micah Davis
#20
Willard Ferrell
#1
Joshua Franklin
#22
Amarian Louis
#14
Daeh McCullough
#6
Joey Pope
#8
Jarvarius Sims
#13
Jordon Thomas
Other
#32
Dieter Kelly
Monmouth
1st in CAA
VS
Western Michigan
1st in MAC
Passing
63.5
Completion Percentage
65.3
233
Completions
160
1.40
Interception Percentage
1.20
5
Interceptions
3
60
Longest Pass
49
2,545
Net Passing Yards
1,768
231.4
Net Passing Yards Per Game
160.7
367
Passing Attempts
245
6.00
Passing Touchdown %
6.10
22
Passing Touchdowns
15
138.4
Passer Rating
143.6
7
Total Sacks
16
52
Sack Yards Lost
103
6.9
Yards Per Pass Attempt
7.2
2,545
Passing Yards
1,768
0
Passing Fumbles Lost
0
11
Team Games Played
11
421.9
Yards Per Game
350.0
30.3
Total Points Per Game
28.4
333
Total Points
312
45
Total Touchdowns
39
231.4
Passing Yards Per Game
160.7
233-367
Comp-Att
160-245
7-52
Sacks-Yards Lost
16-103
Rushing
449
Rushing Attempts
433
2,096
Rushing Yards
2,082
4.7
Yards Per Rush Attempt
4.8
70
Long Rushing
82
0
20+ Yard Rushing Plays
0
21
Rushing Touchdowns
22
190.5
Rushing Yards Per Game
189.3
0
Rushing Fumbles
0
0
Rushing Fumbles Lost
0
125
Rushing 1st downs
101
11
Team Games Played
11
4,641
Total Yards
3,850
823
Total Offensive Plays
694
30.3
Total Points Per Game
28.4
333
Total Points
312
45
Total Touchdowns
39
Receiving
233
Receptions
160
0
Receiving Targets
0
2,545
Receiving Yards
1,768
2,545
Receiving Yards
1,768
22
Receiving Touchdowns
15
60
Long Reception
49
0
20+ Yard Receiving Plays
0
231.4
Receiving Yards Per Game
160.7
0
Receiving Fumbles
0
0
Receiving Fumbles Lost
0
141
Receiving Yards After Catch
819
121
Receiving First Downs
82
11
Team Games Played
11
10.9
Yards Per Reception
11.1
30.3
Total Points Per Game
28.4
333
Total Points
312
45
Total Touchdowns
39
Miscellaneous
265
Total 1st downs
210
125
Rushing 1st downs
101
121
Passing 1st downs
82
19
1st downs by penalty
25
80
Third Down Conversions
64
161
Third Down Attempts
142
49.69
3rd down %
45.07
18
Fourth Down Conversions
10
30
First Downs Attempts
21
60.00
4th down %
47.62
66
Total Penalties
54
621
Total Penalty Yards
479
20042
Possession Time Seconds
20534
0.00
Red Zone Field Goal Percentage
0.00
0.00
Red Zone Scoring Percentage
0.00
0.00
Red Zone Efficiency Percentage
0.00
0.00
Red Zone Touchdown Percentage
0.00
10
Total Takeaways
12
10
Total Giveaways
9
0
Turnover Ratio
3
0
Fumbles Lost
0
80-161
3rd down efficiency
64-142
18-30
4th down efficiency
10-21
66-621
Total-Yards
54-479
Defense
334
Solo Tackles
370
390
Assist Tackles
416
724
Total Tackles
786
30
Sacks
28
183
Sack Yards
182
79
Stuffs
79
29
Passes Defended
33
20.2
Average Interception Yards
10.5
71
Long Interception
50
0
Miscellaneous Touchdowns
0
1
Kicks Blocked
0
43
Tackles For Loss
44
11
Team Games Played
11
Defensive Interceptions
5
Interceptions
8
101
Interception Yards
84
2
Interception Touchdowns
1
5-101
INT: Total
8-84
General
8
Fumbles
16
7
Forced Fumbles
11
5
Fumbles Recovered
9
0
Fumbles Touchdowns
0
11
Games Played
11
8-0
Fumbles-Lost
16-0
Returning
28
Kick Returns
19
549
Kick Return Yards
400
19.6
Yards Per Kick Return
21.1
40
Long Kick Return
92
0
Kick Return Touchdowns
1
11
Punt Returns
13
117
Punt Return Yards
111
10.6
Yards Per Punt Return
8.5
38
Long Punt Return
76
0
Punt Return Touchdowns
0
0
Punt Return Fair Catches
0
0
Kick Return Fumbles Lost
0
0
Punt Return Fumbles Lost
0
11
Team Games Played
11
11-117
Punt: Total
13-111
Kicking
6
Field Goal Made
13
9
Field Goal Attempts
14
66.7
Field Goal Percentage
92.9
40
Long Field Goal Made
52
1
Field Goal Attempts 1-19
0
4
Field Goal Attempts 20-29
2
2
Field Goal Attempts 30-39
6
2
Field Goal Attempts 40-49
4
0
Field Goal Attempts 50+
2
45
Extra Points Made
39
45
Extra Point Attempts
39
100.0
Extra Point Percentage
100.0
0
Field Goals Made 1-19
0
3
Field Goals Made 20-29
2
2
Field Goals Made 30-39
6
1
Field Goals Made 40-49
3
0
Field Goals Made 50+
2
63
Total Kicking Points
78
11
Team Games Played
11
24
Touchback Percentage
25
0.0
Average Kickoff Return Yards
0.0
0
Kickoff Return Yards
0
0
Kickoff Returns
0
0-0
Kickoffs: Total
0-0
6-9
FG: Good-Attempts
13-14
Punting
37
Punts
39
1,484
Punt Yards
1,742
55
Long Punt
69
40.1
Gross Average Punt Yards
44.7
40.1
Net Average Punt Yards
44.7
0
Punts Blocked
0
9
Punts Inside 20
15
1
Touchbacks
2
14
Fair Catches
13
11
Punt Returns
9
0
Punt Return Yards
0
0.0
Average Punt Return Yards
0.0
11
Team Games Played
11
37-1,484
Punt: Total Yards
39-1,742
Scoring
21
Rushing Touchdowns
22
22
Receiving Touchdowns
15
0
Return Touchdowns
1
43
Total Touchdowns
38
6
Field Goals
13
45
Kick Extra Points
39
0
Total Two Point Conversions
0
333
Total Points
312
30.3
Total Points Per Game
28.4