

Navy vs UAB Live Score (25 Sep, 2026)
Score by Quarter
| Team | Q1 | Q2 | Q3 | Q4 | Final |
|---|---|---|---|---|---|
 Navy | 0 | 13 | 7 | 0 | 20 |
 UAB | 0 | 17 | 0 | 7 | 24 |
Scoring Plays
Q2
14:56
14:56
Bam McReynolds 10 Yd Run (Jonah Delange Kick)
Rushing Touchdown
0 – 7
Q2
11:06
11:06
Jackson Gutierrez 4 Yd Run (Nolan Bartley Kick)
Rushing Touchdown
7 – 7
Q2
6:25
6:25
Jonah Delange 44 Yd Field Goal
Field Goal Good
7 – 10
Q2
2:00
2:00
Nolan Bartley 34 Yd Field Goal
Field Goal Good
10 – 10
Q2
1:11
1:11
Ty Mims 56 Yd pass from Ryder Burton (Jonah Delange Kick)
Passing Touchdown
10 – 17
Q2
0:04
0:04
Nolan Bartley 31 Yd Field Goal
Field Goal Good
13 – 17
Q3
4:24
4:24
Vic Listorti 7 Yd Run (Nolan Bartley Kick)
Rush
20 – 17
Q4
10:36
10:36
Bam McReynolds 48 Yd Run (Jonah Delange Kick)
Rushing Touchdown
20 – 24
Game Leaders
NavyUAB
 J. Gutierrez QB
Passing Yards
 R. Burton QBJ. Gutierrez QB
Rushing Yards
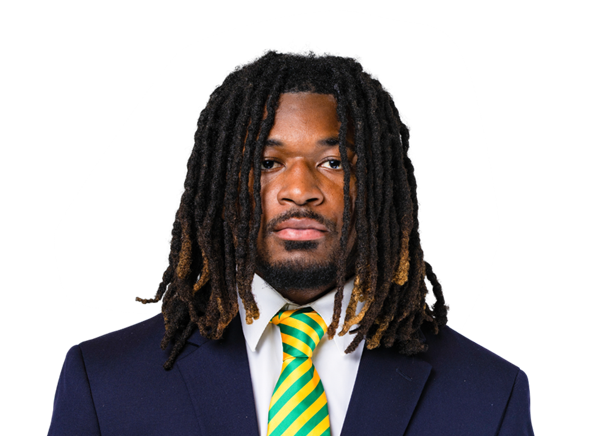 B. McReynolds RB
 V. Listorti RB
Receiving Yards
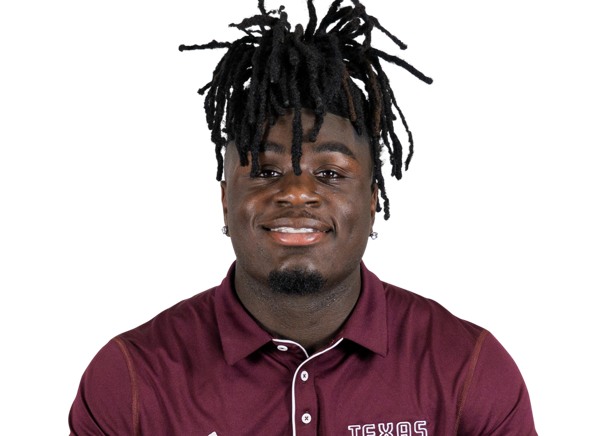 T. Mims WR
 M. Parker LB
Sacks
 J. Pierce DBM. Parker LB
Tackles
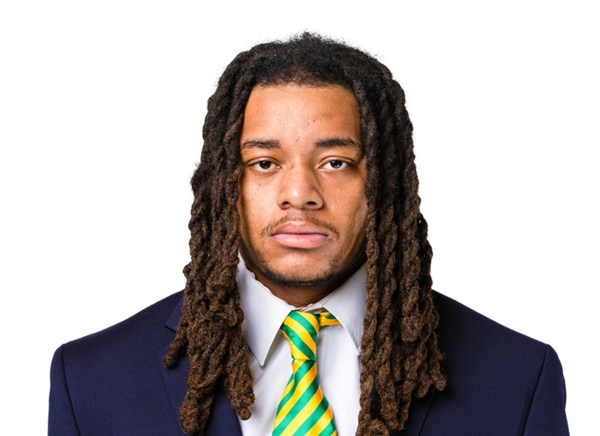 M. Byard LB
Player Box Score
Navy| Player | C/ATT | YDS | AVG | TD | INT | QBR |
|---|---|---|---|---|---|---|
| Jackson Gutierrez#8 | 4/13 | 104 | 8.0 | 0 | 0 | 41.4 |
UAB| Player | C/ATT | YDS | AVG | TD | INT | QBR |
|---|---|---|---|---|---|---|
| Ryder Burton#5 | 13/20 | 174 | 8.7 | 1 | 1 | 34.2 |
Navy| Player | CAR | YDS | AVG | TD | LONG |
|---|---|---|---|---|---|
| Jackson Gutierrez#8 | 34 | 134 | 3.9 | 1 | 42 |
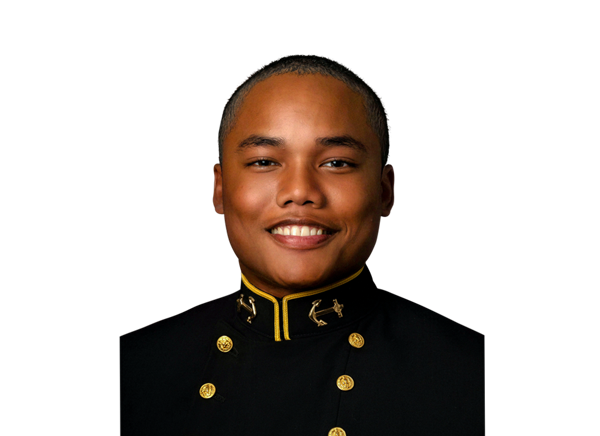 Michael Barrow#26 | 9 | 48 | 5.3 | 0 | 17 |
| Vic Listorti#40 | 7 | 29 | 4.1 | 1 | 7 |
 Charles Robinson#23 | 4 | 24 | 6.0 | 0 | 9 |
 Evan Blouir#15 | 2 | 12 | 6.0 | 0 | 10 |
 Isaiah Bryant#25 | 1 | 1 | 1.0 | 0 | 1 |
 Christian Cromer#42 | 1 | 1 | 1.0 | 0 | 1 |
UAB| Player | CAR | YDS | AVG | TD | LONG |
|---|---|---|---|---|---|
| Bam McReynolds#3 | 8 | 71 | 8.9 | 2 | 48 |
 Rod Robinson II#2 | 12 | 38 | 3.2 | 0 | 11 |
 Ja'Vin Simpkins#7 | 5 | 31 | 6.2 | 0 | 11 |
 Nate Rogers#16 | 2 | 3 | 1.5 | 0 | 3 |
 Team | 1 | -2 | -2.0 | 0 | 0 |
| Ryder Burton#5 | 6 | -25 | -4.2 | 0 | 3 |
Navy| Player | REC | YDS | AVG | TD | LONG |
|---|---|---|---|---|---|
| Vic Listorti#40 | 1 | 39 | 39.0 | 0 | 39 |
 Truman Brasfield#83 | 1 | 39 | 39.0 | 0 | 39 |
| Isaiah Bryant#25 | 1 | 14 | 14.0 | 0 | 14 |
| Michael Barrow#26 | 1 | 12 | 12.0 | 0 | 12 |
UAB| Player | REC | YDS | AVG | TD | LONG |
|---|---|---|---|---|---|
| Ty Mims | 3 | 76 | 25.3 | 1 | 56 |
 CJ Smith#1 | 3 | 39 | 13.0 | 0 | 16 |
 EJ Reid#4 | 3 | 17 | 5.7 | 0 | 6 |
 KJ Daniels#6 | 1 | 13 | 13.0 | 0 | 13 |
 Sean Persson#87 | 1 | 12 | 12.0 | 0 | 12 |
 Antonio Ferguson#85 | 1 | 11 | 11.0 | 0 | 11 |
 Scott Isacks#44 | 1 | 6 | 6.0 | 0 | 6 |
Navy| Player | TOT | SOLO | SACKS | TFL | PD | QB HUR | TD |
|---|---|---|---|---|---|---|---|
| MarcAnthony Parker#56 | 10 | 7 | 3 | 3 | 0 | 0 | 0 |
 Coleman Cauley#58 | 7 | 5 | 1 | 1 | 0 | 0 | 0 |
 Giuseppe Sessi#16 | 6 | 4 | 0 | 0 | 0 | 0 | 0 |
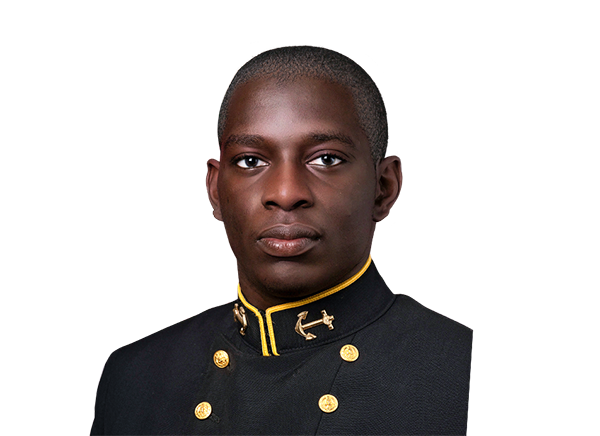 Irabonoise Oniha#3 | 4 | 3 | 0 | 0 | 0 | 0 | 0 |
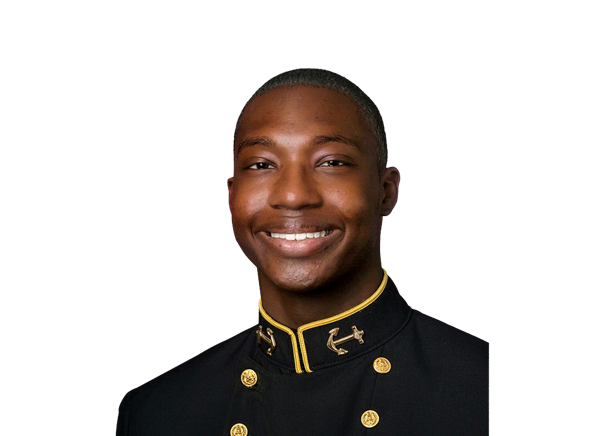 Aaron Rose#8 | 4 | 3 | 0 | 0 | 1 | 0 | 0 |
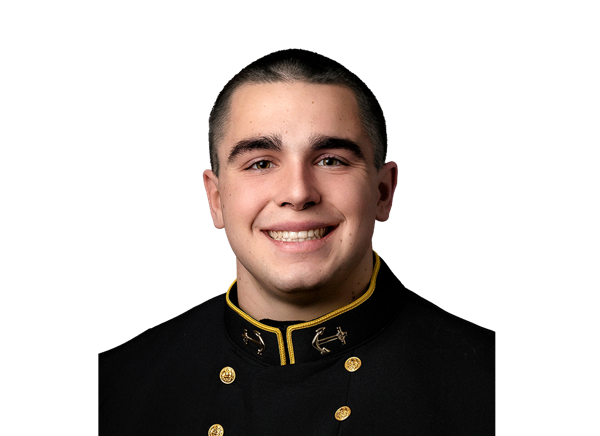 Griffen Willis#95 | 4 | 1 | 0 | 0 | 0 | 0 | 0 |
 Kush'i Abraham#7 | 3 | 3 | 0 | 0 | 0 | 1 | 0 |
 Sean Martin#4 | 3 | 2 | 0 | 0 | 0 | 0 | 0 |
 Aiden Lyczek#65 | 3 | 1 | 0 | 0 | 1 | 0 | 0 |
 Gavin Noe#43 | 2 | 1 | 0 | 0 | 0 | 0 | 0 |
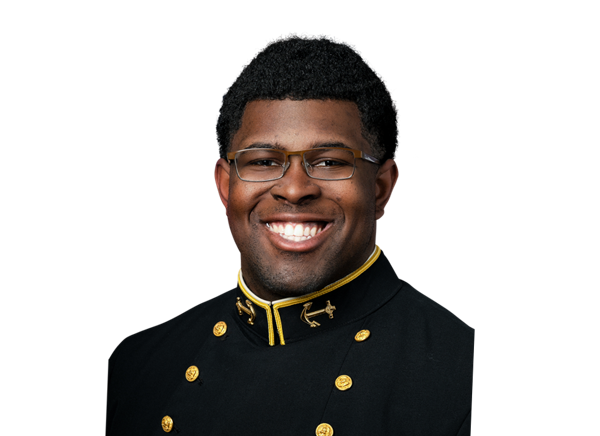 Xavyer Arrington#94 | 2 | 1 | 0 | 1 | 0 | 1 | 0 |
 Will Miller#18 | 2 | 1 | 0 | 0 | 0 | 0 | 0 |
 Christian Johnson#45 | 1 | 1 | 0 | 0 | 0 | 0 | 0 |
 Cam Robinson#13 | 1 | 1 | 0 | 0 | 0 | 0 | 0 |
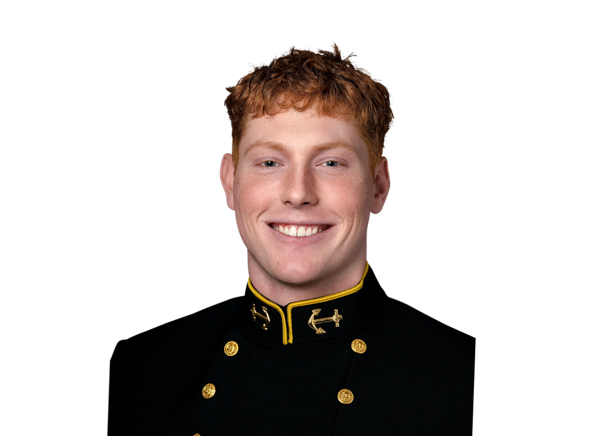 Jacob Asbeck#51 | 1 | 0 | 0 | 0 | 0 | 0 | 0 |
 Trent Gillis#14 | 1 | 0 | 0 | 0 | 0 | 0 | 0 |
UAB| Player | TOT | SOLO | SACKS | TFL | PD | QB HUR | TD |
|---|---|---|---|---|---|---|---|
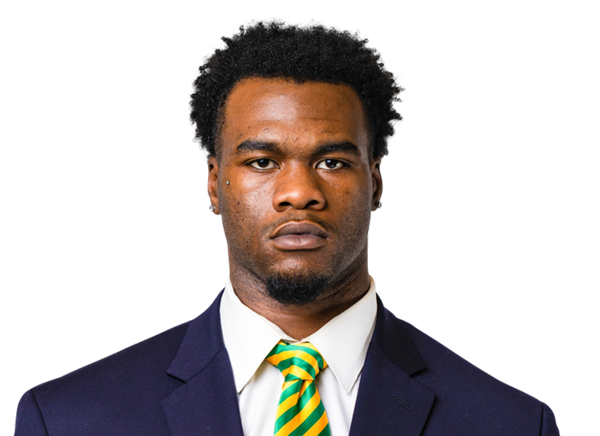 Marlin Dean#4 | 12 | 10 | 2.5 | 4.5 | 0 | 0 | 0 |
| Muaaz Byard#35 | 12 | 10 | 0 | 0 | 1 | 0 | 0 |
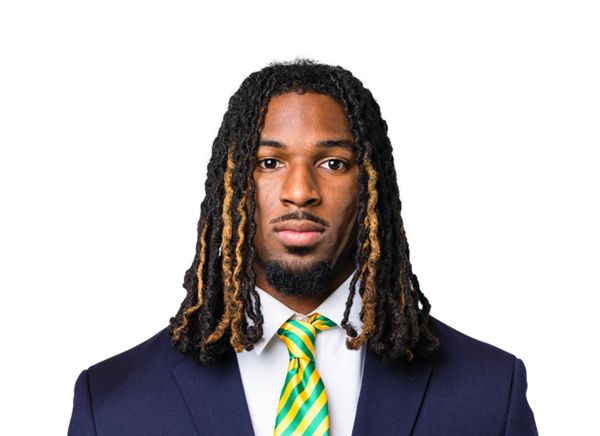 Jeremiah Jordan#13 | 8 | 6 | 0 | 0 | 0 | 0 | 0 |
| Jo'Tavion Pierce | 7 | 5 | 2.5 | 2.5 | 0 | 0 | 0 |
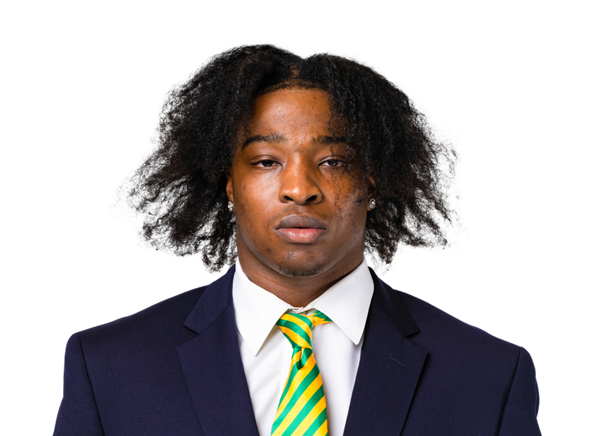 Ike Esonwune#3 | 6 | 3 | 0 | 0 | 0 | 0 | 0 |
 Delvon Gulley#5 | 5 | 3 | 0 | 1 | 1 | 0 | 0 |
 Cam Cunningham#29 | 5 | 3 | 0 | 0 | 0 | 0 | 0 |
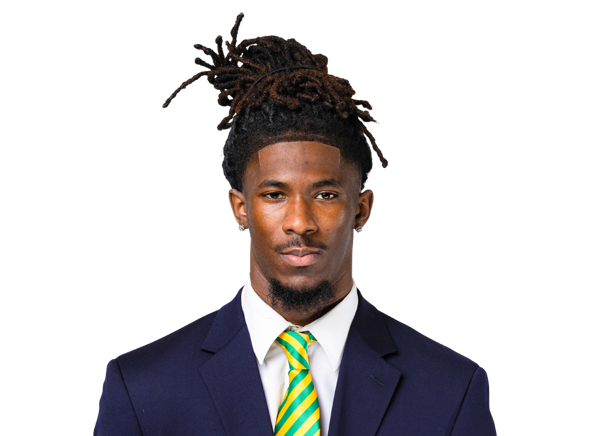 Darrell Sweeting#1 | 4 | 3 | 0 | 1 | 2 | 0 | 0 |
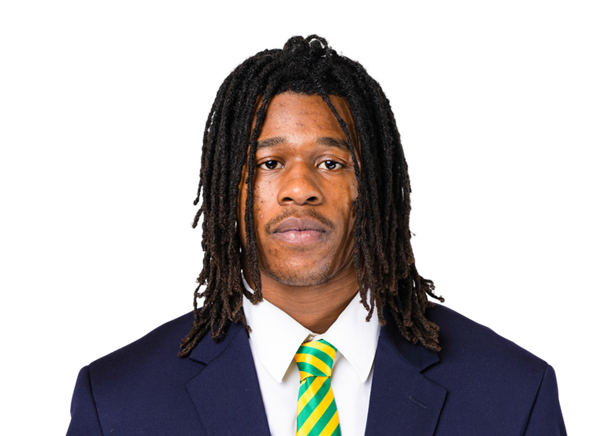 Draden Fullbright#21 | 3 | 3 | 0 | 0 | 0 | 0 | 0 |
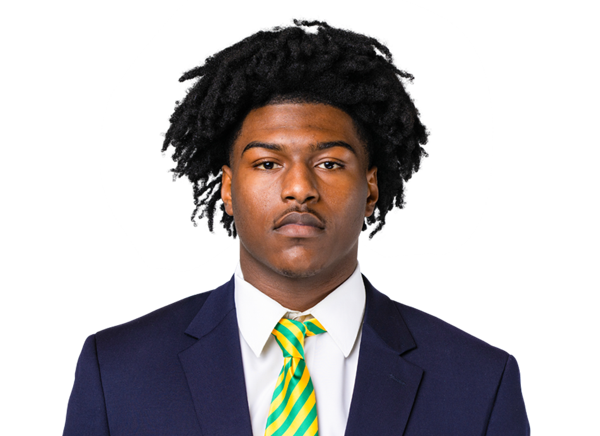 Anta'Veon McKenzie#11 | 3 | 3 | 0 | 0 | 0 | 0 | 0 |
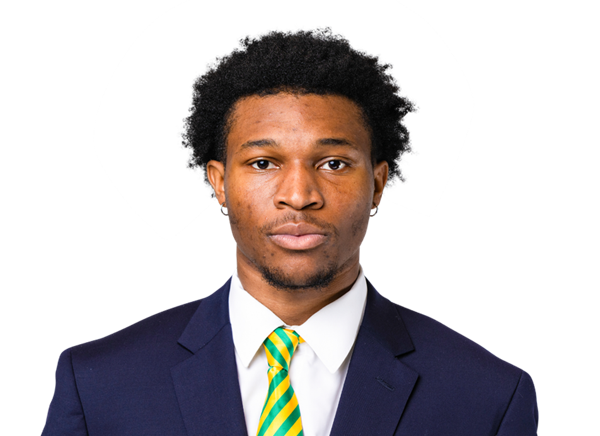 Que Billingsley#6 | 2 | 2 | 0 | 0 | 0 | 0 | 0 |
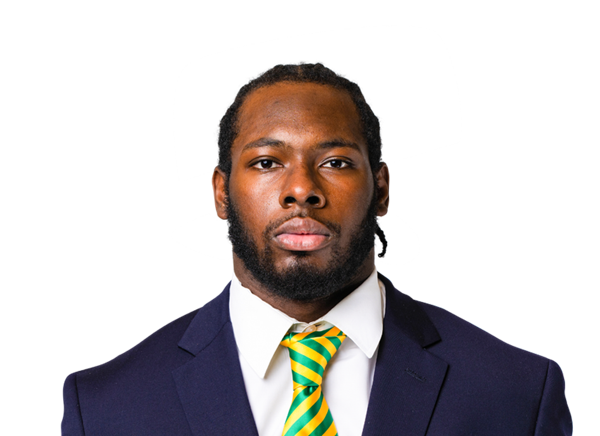 Chris Spencer#90 | 2 | 1 | 1 | 1 | 0 | 0 | 0 |
| CJ Smith#1 | 1 | 1 | 0 | 0 | 0 | 0 | 0 |
| Bam McReynolds#3 | 1 | 1 | 0 | 0 | 0 | 0 | 0 |
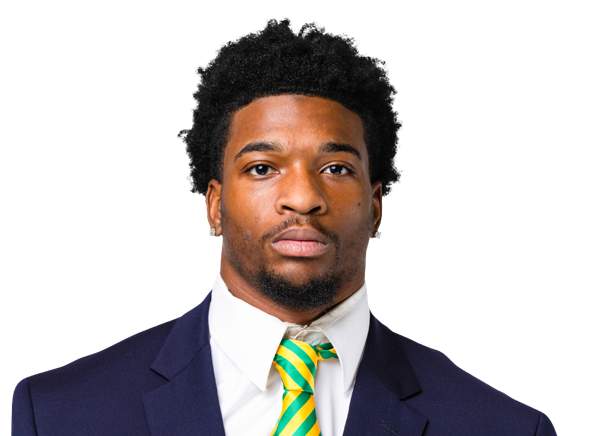 Kris Wokomah#10 | 1 | 1 | 0 | 0 | 0 | 0 | 0 |
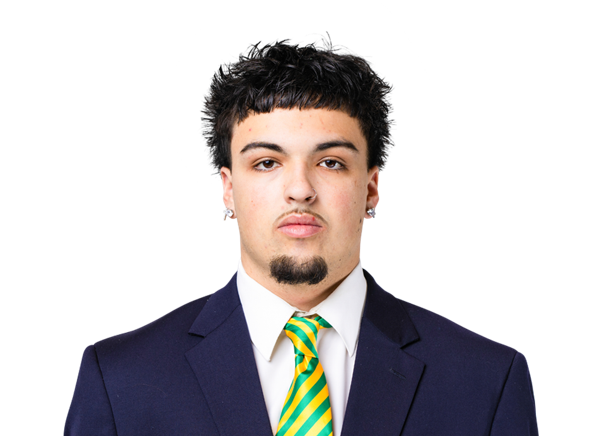 Diezel Wilkinson#24 | 1 | 1 | 0 | 0 | 0 | 0 | 0 |
 Mykale Hrabowski#23 | 1 | 1 | 0 | 0 | 0 | 0 | 0 |
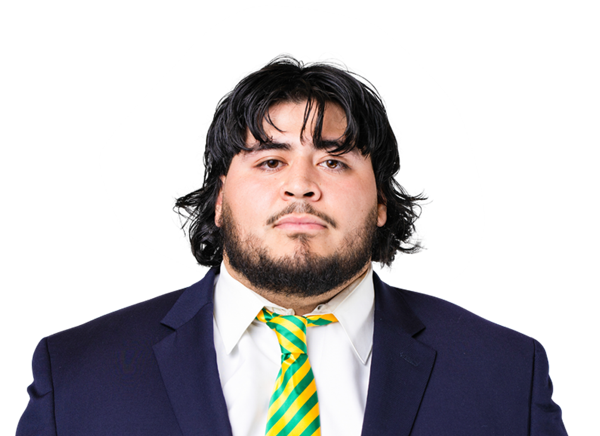 Raymond Macias#99 | 1 | 0 | 0 | 0 | 0 | 0 | 0 |
 Tylin Jackson#17 | 0 | 0 | 0 | 0 | 0 | 1 | 0 |
Navy| Player | FUM | LOST | REC |
|---|---|---|---|
| Jackson Gutierrez#8 | 2 | 1 | 0 |
| Michael Barrow#26 | 1 | 1 | 0 |
UAB| Player | FUM | LOST | REC |
|---|---|---|---|
| Chris Spencer#90 | 0 | 0 | 1 |
| Marlin Dean#4 | 0 | 0 | 1 |
Navy| Player | FG | PCT | LONG | XP | PTS |
|---|---|---|---|---|---|
 Nolan Bartley#15 | 2/2 | 100.0 | 34 | 2/2 | 8 |
UAB| Player | FG | PCT | LONG | XP | PTS |
|---|---|---|---|---|---|
 Jonah Delange#39 | 1/2 | 50.0 | 44 | 3/3 | 6 |
Navy| Player | NO | YDS | AVG | TB | In 20 | LONG |
|---|---|---|---|---|---|---|
 Jacob Carlson#11 | 3 | 77 | 25.7 | 0 | 0 | 37 |
UAB| Player | NO | YDS | AVG | TB | In 20 | LONG |
|---|---|---|---|---|---|---|
 Oliver Straw#46 | 4 | 191 | 47.8 | 0 | 2 | 53 |
UAB| Player | NO | YDS | AVG | LONG | TD |
|---|---|---|---|---|---|
| KJ Daniels#6 | 2 | 39 | 19.5 | 23 | 0 |
 Hudson Higgins#21 | 1 | 13 | 13.0 | 13 | 0 |
| Antonio Ferguson#85 | 1 | 0 | 0.0 | 0 | 0 |
Navy| Player | NO | YDS | AVG | LONG | TD |
|---|---|---|---|---|---|
| Charles Robinson#23 | 4 | 21 | 5.3 | 23 | 0 |
Navy| Player | INT | YDS | TD |
|---|---|---|---|
| Giuseppe Sessi#16 | 1 | 2 | 0 |
Drive Summary
UAB
Punt
17
NAVY
Punt
18
UAB
Punt
4
NAVY
Punt
7
UAB
Touchdown
40
NAVY
Touchdown
75
UAB
Field Goal
49
NAVY
Field Goal
58
UAB
Touchdown
78
NAVY
Field Goal
61
UAB
End of Half
-2
NAVY
Punt
18
UAB
Punt
8
NAVY
Touchdown
47
UAB
Interception
29
NAVY
Fumble
25
UAB
Touchdown
48
NAVY
Fumble
31
UAB
Punt
1
NAVY
Downs
28
UAB
Missed FG
8
NAVY
End of Half
-10
Injury Report
No current injury report is available for this matchup.
Head-to-Head
Historical meetings are not available for this matchup.
Game Information
StageWeek 4
Season2026
KickoffFri, Sep 25, 7:00 pm
VenueProtective Stadium
LocationBirmingham, AL
SurfaceGrass
BroadcastESPN
Attendance24,647
Division Standings
FBS — American Conference
| Team | W | L | T | Pct | PF | PA | Home | Away | Strk |
|---|---|---|---|---|---|---|---|---|---|
 South Florida | 6 | 2 | 0 | 0.750 | 216 | 116 | 4-1 | 2-1 | W2 |
 Florida Atlantic | 5 | 3 | 0 | 0.625 | 302 | 286 | 4-0 | 1-3 | L1 |
| UAB | 4 | 4 | 0 | 0.500 | 173 | 202 | 4-0 | 0-4 | L1 |
 Army | 5 | 3 | 0 | 0.625 | 269 | 204 | 3-1 | 2-2 | L1 |
 Memphis | 7 | 2 | 0 | 0.778 | 338 | 212 | 5-0 | 2-2 | W2 |
 Tulsa | 4 | 4 | 0 | 0.500 | 238 | 195 | 2-2 | 2-2 | L1 |
 UTSA | 7 | 1 | 0 | 0.875 | 268 | 208 | 4-0 | 3-1 | W5 |
 East Carolina | 4 | 4 | 0 | 0.500 | 192 | 193 | 3-1 | 1-3 | W1 |
 North Texas | 6 | 2 | 0 | 0.750 | 350 | 255 | 4-0 | 2-2 | W5 |
 Tulane | 4 | 4 | 0 | 0.500 | 180 | 203 | 3-1 | 1-3 | W1 |
 Rice | 1 | 7 | 0 | 0.125 | 168 | 254 | 1-3 | 0-4 | L7 |
 Charlotte | 1 | 7 | 0 | 0.125 | 165 | 322 | 0-4 | 1-3 | L1 |
 Temple | 2 | 6 | 0 | 0.250 | 189 | 213 | 1-4 | 1-2 | L3 |
| Navy | 2 | 6 | 0 | 0.250 | 221 | 239 | 2-2 | 0-4 | L3 |
Navy
5th in FBS
VS
UAB
Quarterbacks & Specialists
#15
Evan Blouir
#11
Jacob Carlson
#8
Jackson Gutierrez
Receivers & Backs
#26
Michael Barrow
#83
Truman Brasfield
#25
Isaiah Bryant
#42
Christian Cromer
#40
Vic Listorti
#43
Gavin Noe
#23
Charles Robinson
Defensive Line & Linebackers
#94
Xavyer Arrington
#51
Jacob Asbeck
#58
Coleman Cauley
#14
Trent Gillis
#45
Christian Johnson
#65
Aiden Lyczek
#18
Will Miller
#56
MarcAnthony Parker
#95
Griffen Willis
Defensive Backs
#7
Kush'i Abraham
#4
Sean Martin
#3
Irabonoise Oniha
#13
Cam Robinson
#8
Aaron Rose
#16
Giuseppe Sessi
Other
#15
Nolan Bartley
Quarterbacks & Specialists
#5
Ryder Burton
#16
Nate Rogers
#46
Oliver Straw
Receivers & Backs
#6
KJ Daniels
#85
Antonio Ferguson
#21
Hudson Higgins
#44
Scott Isacks
#3
Bam McReynolds
Ty Mims
#87
Sean Persson
#4
EJ Reid
#2
Rod Robinson II
#7
Ja'Vin Simpkins
#1
CJ Smith
Defensive Line & Linebackers
#35
Muaaz Byard
#29
Cam Cunningham
#4
Marlin Dean
#3
Ike Esonwune
#17
Tylin Jackson
#99
Raymond Macias
#90
Chris Spencer
Defensive Backs
#6
Que Billingsley
#21
Draden Fullbright
#5
Delvon Gulley
#23
Mykale Hrabowski
#13
Jeremiah Jordan
#11
Anta'Veon McKenzie
Jo'Tavion Pierce
#1
Darrell Sweeting
#24
Diezel Wilkinson
#10
Kris Wokomah
Other
#39
Jonah Delange
Navy
13th in American
VS
UAB
5th in American
Passing
47.9
Completion Percentage
53.0
46
Completions
106
2.10
Interception Percentage
2.50
2
Interceptions
5
92
Longest Pass
56
869
Net Passing Yards
1,357
108.6
Net Passing Yards Per Game
169.6
96
Passing Attempts
200
7.30
Passing Touchdown %
3.00
7
Passing Touchdowns
6
144.2
Passer Rating
115.0
9
Total Sacks
25
64
Sack Yards Lost
168
9.1
Yards Per Pass Attempt
6.8
869
Passing Yards
1,357
0
Passing Fumbles Lost
0
8
Team Games Played
8
404.4
Yards Per Game
318.8
27.6
Total Points Per Game
21.6
221
Total Points
173
29
Total Touchdowns
17
108.6
Passing Yards Per Game
169.6
46-96
Comp-Att
106-200
9-64
Sacks-Yards Lost
25-168
Rushing
425
Rushing Attempts
330
2,366
Rushing Yards
1,193
5.6
Yards Per Rush Attempt
3.6
56
Long Rushing
48
0
20+ Yard Rushing Plays
0
22
Rushing Touchdowns
9
295.8
Rushing Yards Per Game
149.1
0
Rushing Fumbles
0
0
Rushing Fumbles Lost
0
124
Rushing 1st downs
75
8
Team Games Played
8
3,235
Total Yards
2,550
530
Total Offensive Plays
555
27.6
Total Points Per Game
21.6
221
Total Points
173
29
Total Touchdowns
17
Receiving
46
Receptions
106
0
Receiving Targets
0
869
Receiving Yards
1,357
869
Receiving Yards
1,357
7
Receiving Touchdowns
6
92
Long Reception
56
0
20+ Yard Receiving Plays
0
108.6
Receiving Yards Per Game
169.6
0
Receiving Fumbles
0
0
Receiving Fumbles Lost
0
385
Receiving Yards After Catch
418
30
Receiving First Downs
62
8
Team Games Played
8
18.9
Yards Per Reception
12.8
27.6
Total Points Per Game
21.6
221
Total Points
173
29
Total Touchdowns
17
Miscellaneous
169
Total 1st downs
145
124
Rushing 1st downs
75
31
Passing 1st downs
62
14
1st downs by penalty
8
39
Third Down Conversions
48
93
Third Down Attempts
121
41.94
3rd down %
39.67
13
Fourth Down Conversions
6
20
First Downs Attempts
16
65.00
4th down %
37.50
43
Total Penalties
47
361
Total Penalty Yards
410
15393
Possession Time Seconds
14614
0.00
Red Zone Field Goal Percentage
0.00
0.00
Red Zone Scoring Percentage
0.00
0.00
Red Zone Efficiency Percentage
0.00
0.00
Red Zone Touchdown Percentage
0.00
3
Total Takeaways
10
10
Total Giveaways
12
-7
Turnover Ratio
-2
0
Fumbles Lost
0
39-93
3rd down efficiency
48-121
13-20
4th down efficiency
6-16
43-361
Total-Yards
47-410
Defense
257
Solo Tackles
314
266
Assist Tackles
208
523
Total Tackles
522
15
Sacks
17
105
Sack Yards
97
59
Stuffs
56
13
Passes Defended
22
3.5
Average Interception Yards
17.6
12
Long Interception
80
0
Miscellaneous Touchdowns
0
0
Kicks Blocked
0
33
Tackles For Loss
32
8
Team Games Played
8
Defensive Interceptions
4
Interceptions
5
14
Interception Yards
88
0
Interception Touchdowns
1
4-14
INT: Total
5-88
General
16
Fumbles
9
0
Forced Fumbles
9
1
Fumbles Recovered
5
0
Fumbles Touchdowns
1
8
Games Played
8
16-0
Fumbles-Lost
9-0
Returning
7
Kick Returns
11
160
Kick Return Yards
184
22.9
Yards Per Kick Return
16.7
37
Long Kick Return
27
0
Kick Return Touchdowns
0
11
Punt Returns
12
55
Punt Return Yards
149
5.0
Yards Per Punt Return
12.4
23
Long Punt Return
42
0
Punt Return Touchdowns
0
0
Punt Return Fair Catches
0
0
Kick Return Fumbles Lost
0
0
Punt Return Fumbles Lost
0
8
Team Games Played
8
11-55
Punt: Total
12-149
Kicking
6
Field Goal Made
18
9
Field Goal Attempts
22
66.7
Field Goal Percentage
81.8
38
Long Field Goal Made
57
0
Field Goal Attempts 1-19
0
2
Field Goal Attempts 20-29
5
4
Field Goal Attempts 30-39
4
2
Field Goal Attempts 40-49
10
1
Field Goal Attempts 50+
3
23
Extra Points Made
15
25
Extra Point Attempts
15
92.0
Extra Point Percentage
100.0
0
Field Goals Made 1-19
0
2
Field Goals Made 20-29
5
4
Field Goals Made 30-39
3
0
Field Goals Made 40-49
8
0
Field Goals Made 50+
2
41
Total Kicking Points
69
8
Team Games Played
8
24
Touchback Percentage
76
0.0
Average Kickoff Return Yards
0.0
0
Kickoff Return Yards
0
0
Kickoff Returns
0
0-0
Kickoffs: Total
0-0
6-9
FG: Good-Attempts
18-22
Punting
25
Punts
28
1,084
Punt Yards
1,298
62
Long Punt
59
43.4
Gross Average Punt Yards
46.4
43.4
Net Average Punt Yards
46.4
0
Punts Blocked
0
5
Punts Inside 20
10
2
Touchbacks
0
6
Fair Catches
7
8
Punt Returns
12
0
Punt Return Yards
0
0.0
Average Punt Return Yards
0.0
8
Team Games Played
8
25-1,084
Punt: Total Yards
28-1,298
Scoring
22
Rushing Touchdowns
9
7
Receiving Touchdowns
6
0
Return Touchdowns
0
29
Total Touchdowns
16
6
Field Goals
18
23
Kick Extra Points
15
2
Total Two Point Conversions
1
221
Total Points
173
27.6
Total Points Per Game
21.6