

NC State vs Vanderbilt Live Score (19 Sep, 2026)
Score by Quarter
| Team | Q1 | Q2 | Q3 | Q4 | Final |
|---|---|---|---|---|---|
 NC State | 14 | 3 | 7 | 7 | 31 |
 Vanderbilt | 0 | 7 | 7 | 21 | 35 |
Scoring Plays
Q1
11:05
11:05
W. Wilson run for 38 yds, for a TD (K. Vinesett KICK)
Rushing Touchdown
7 – 0
Q1
2:58
2:58
CJ Bailey pass to K. Jackson for 30 yds, for a TD (K. Vinesett KICK)
Passing Touchdown
14 – 0
Q2
8:09
8:09
K. Vinesett 24 yd FG GOOD
Field Goal Good
17 – 0
Q2
0:12
0:12
Jar. Curtis pass to J. Sherrill for 12 yds, for a TD (B. Taylor KICK)
Passing Touchdown
17 – 7
Q3
8:52
8:52
CJ Bailey pass to K. Jackson for 6 yds, for a TD (K. Vinesett KICK)
Passing Touchdown
24 – 7
Q3
7:02
7:02
M. Young run for 7 yds, for a TD (B. Taylor KICK)
Rushing Touchdown
24 – 14
Q4
14:11
14:11
Jar. Curtis pass to S. Alexander for 10 yds, for a TD (B. Taylor KICK)
Passing Touchdown
24 – 21
Q4
9:35
9:35
CJ Bailey pass to K. Jackson for 23 yds, for a TD (K. Vinesett KICK)
Passing Touchdown
31 – 21
Q4
6:24
6:24
Jar. Curtis pass to J. Sherrill for 43 yds, for a TD (B. Taylor KICK)
Passing Touchdown
31 – 28
Q4
0:03
0:03
CJ Bailey run for -5 yds, CJ Bailey fumbled, forced by M. Capers, recovered by C. Daniels, C. Daniels returned for a TD (B. Taylor KICK)
Fumble Return Touchdown
31 – 35
Game Leaders
NC StateVanderbilt
 C. Bailey QB
Passing Yards
 J. Curtis QB
 J. Scott RB
Rushing Yards
J. Curtis QB K. Jackson WR
Receiving Yards
 J. Sherrill WR
 P. Aguirre LB
Tackles
 C. Heard S
—
Sacks
 N. Rinaldi LB
Player Box Score
NC State| Player | C/ATT | YDS | AVG | TD | INT |
|---|---|---|---|---|---|
| CJ Bailey#11 | 25/37 | 275 | 7.4 | 3 | 1 |
 Joshisa Trader#2 | 1/1 | 5 | 5.0 | 0 | 0 |
Vanderbilt| Player | C/ATT | YDS | AVG | TD | INT |
|---|---|---|---|---|---|
| Jared Curtis#2 | 20/34 | 277 | 8.1 | 3 | 2 |
NC State| Player | CAR | YDS | AVG | TD | LONG |
|---|---|---|---|---|---|
| Jayden Scott#1 | 16 | 50 | 3.1 | 0 | 9 |
 Will Wilson#10 | 8 | 49 | 6.1 | 1 | 38 |
| CJ Bailey#11 | 9 | 35 | 3.9 | 0 | 28 |
 Davion Gause#7 | 7 | 33 | 4.7 | 0 | 12 |
| Team | 1 | -1 | -1.0 | 0 | -1 |
Vanderbilt| Player | CAR | YDS | AVG | TD | LONG |
|---|---|---|---|---|---|
| Jared Curtis#2 | 12 | 64 | 5.3 | 0 | 19 |
 Sedrick Alexander#28 | 7 | 53 | 7.6 | 0 | 17 |
 Makhilyn Young#22 | 4 | 16 | 4.0 | 1 | 7 |
 Jamezell Lassiter#3 | 1 | -1 | -1.0 | 0 | 0 |
NC State| Player | REC | YDS | AVG | TD | LONG |
|---|---|---|---|---|---|
| Keenan Jackson#8 | 9 | 102 | 11.3 | 3 | 30 |
 Preston Douglas#19 | 4 | 50 | 12.5 | 0 | 22 |
| Davion Gause#7 | 5 | 44 | 8.8 | 0 | 17 |
| Joshisa Trader#2 | 2 | 29 | 14.5 | 0 | 15 |
 Hunter Provience#86 | 1 | 18 | 18.0 | 0 | 18 |
 Davion Dozier#5 | 1 | 13 | 13.0 | 0 | 13 |
| Jayden Scott#1 | 1 | 13 | 13.0 | 0 | 11 |
 Chance Robinson#82 | 1 | 7 | 7.0 | 0 | 7 |
 Tyran Warren#13 | 1 | 5 | 5.0 | 0 | 5 |
 Victor Snow | 1 | -1 | -1.0 | 0 | 0 |
Vanderbilt| Player | REC | YDS | AVG | TD | LONG |
|---|---|---|---|---|---|
| Junior Sherrill | 6 | 108 | 18.0 | 2 | 43 |
 Tristen Brown#5 | 4 | 81 | 20.3 | 0 | 33 |
 Cole Adams#7 | 2 | 25 | 12.5 | 0 | 16 |
 Brycen Coleman#9 | 1 | 18 | 18.0 | 0 | 18 |
| Sedrick Alexander#28 | 2 | 15 | 7.5 | 1 | 10 |
 Kayleb Barnett#13 | 2 | 11 | 5.5 | 0 | 6 |
| Makhilyn Young#22 | 2 | 10 | 5.0 | 0 | 10 |
 Jayvontay Conner#8 | 1 | 9 | 9.0 | 0 | 9 |
NC State| Player | TOT | SOLO | SACKS | TFL | PD | QB HUR | TD |
|---|---|---|---|---|---|---|---|
| Popo Aguirre | 6 | 4 | 0 | 0 | 0 | 0 | 0 |
 Bailey Benson#31 | 5 | 3 | 0 | 0 | 0 | 0 | 0 |
 Jaren Sensabaugh#14 | 4 | 3 | 0 | 0 | 1 | 0 | 0 |
 Ronnie Royal III#2 | 3 | 3 | 0 | 1 | 0 | 0 | 0 |
 Tristan Teasdell#3 | 3 | 2 | 0 | 0 | 0 | 0 | 0 |
 King Mack#4 | 3 | 1 | 0 | 0 | 1 | 0 | 0 |
 Jackson Vick#22 | 2 | 2 | 0 | 0 | 0 | 0 | 0 |
 Brian Nelson II#7 | 2 | 2 | 0 | 0 | 0 | 0 | 0 |
 Elijah Satchell#58 | 2 | 2 | 0 | 0 | 0 | 0 | 0 |
 Adrian Farrow#47 | 2 | 1 | 0 | 0 | 0 | 0 | 0 |
 Ke'Von Carter#42 | 2 | 1 | 0 | 0 | 0 | 0 | 0 |
 Logan Foust#38 | 2 | 1 | 0 | 0 | 0 | 0 | 0 |
 Chase Bond#92 | 2 | 0 | 0 | 0 | 0 | 0 | 0 |
 Colby Cronk#34 | 2 | 0 | 0 | 0 | 0 | 0 | 0 |
 Sterling Dixon#25 | 1 | 1 | 0 | 0 | 0 | 0 | 0 |
| Hunter Provience#86 | 1 | 1 | 0 | 0 | 0 | 0 | 0 |
 Ty White#10 | 1 | 1 | 0 | 0 | 0 | 0 | 0 |
 AJ Prim#99 | 1 | 1 | 0 | 0 | 0 | 0 | 0 |
 Katron Evans#55 | 1 | 0 | 0 | 0 | 0 | 1 | 0 |
 Isaiah Shirley#88 | 1 | 0 | 0 | 0 | 0 | 0 | 0 |
 Harvey Dyson III#5 | 1 | 0 | 0 | 0 | 0 | 2 | 0 |
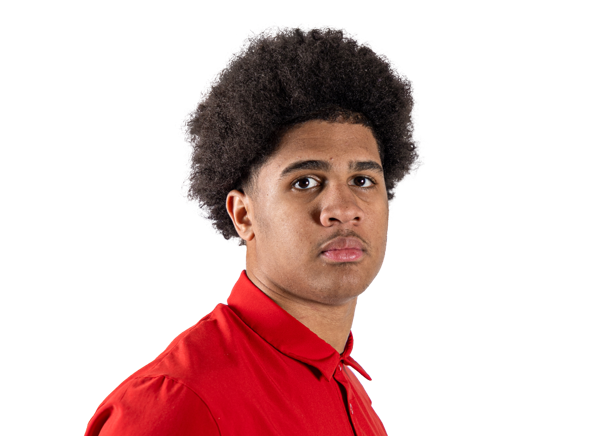 Jordan Moreta#44 | 1 | 0 | 0 | 0 | 0 | 0 | 0 |
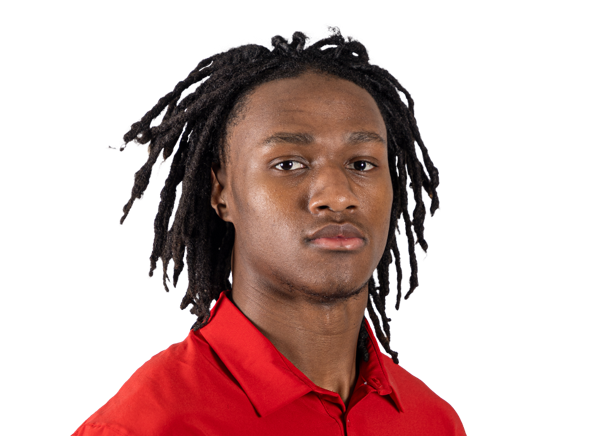 Jordyn Best#26 | 1 | 0 | 0 | 0 | 0 | 0 | 0 |
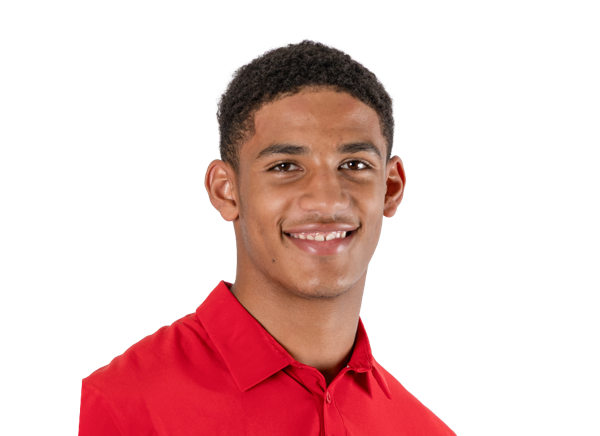 Noah Moss#34 | 1 | 0 | 0 | 0 | 0 | 0 | 0 |
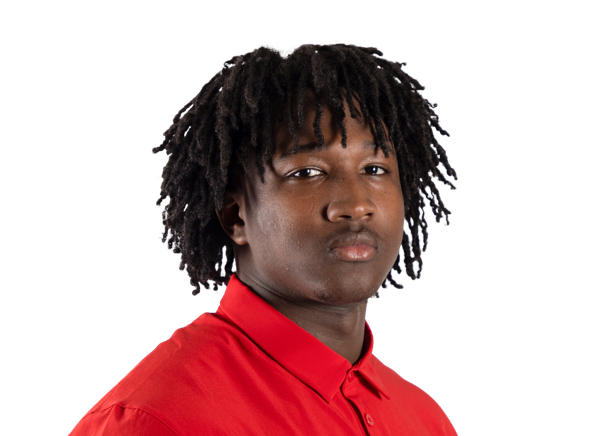 Josh Warren Jr.#53 | 1 | 0 | 0 | 0 | 0 | 0 | 0 |
 Brody Barnhardt#29 | 0 | 0 | 0 | 0 | 1 | 0 | 0 |
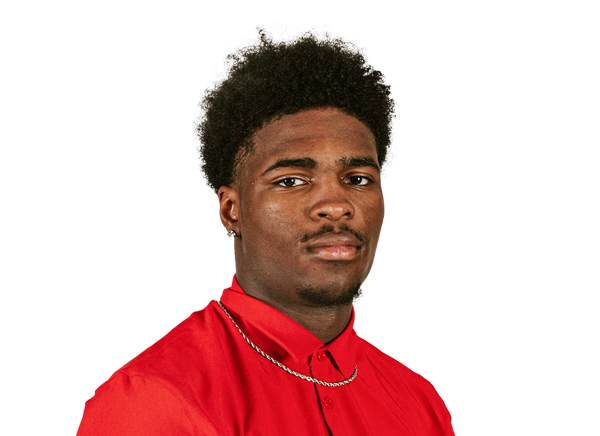 LaCorian Hodge#35 | 0 | 0 | 0 | 0 | 1 | 1 | 0 |
Vanderbilt| Player | TOT | SOLO | SACKS | TFL | PD | QB HUR | TD |
|---|---|---|---|---|---|---|---|
| CJ Heard#8 | 8 | 7 | 0 | 0 | 0 | 0 | 0 |
| Mason Lewis#25 | 8 | 6 | 0 | 0 | 0 | 0 | 0 |
 Ricardo Jones#7 | 8 | 5 | 0 | 1 | 1 | 0 | 0 |
 Bryan Longwell#11 | 7 | 3 | 0 | 0 | 0 | 0 | 0 |
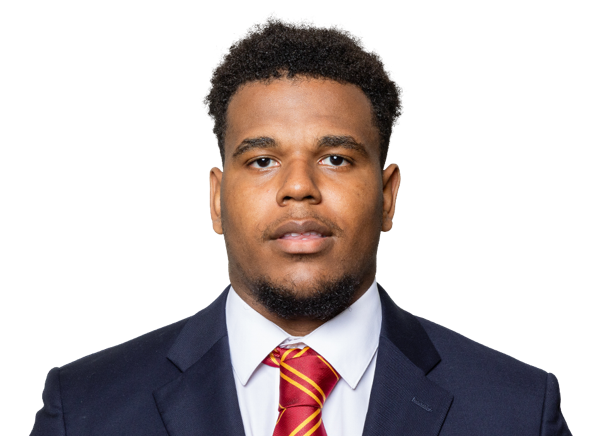 Edwin Kolenge#17 | 6 | 0 | 0 | 0 | 0 | 0 | 0 |
| Nick Rinaldi#24 | 5 | 2 | 1 | 1 | 1 | 1 | 0 |
 Bradley Mann#94 | 5 | 1 | 0 | 0 | 0 | 0 | 0 |
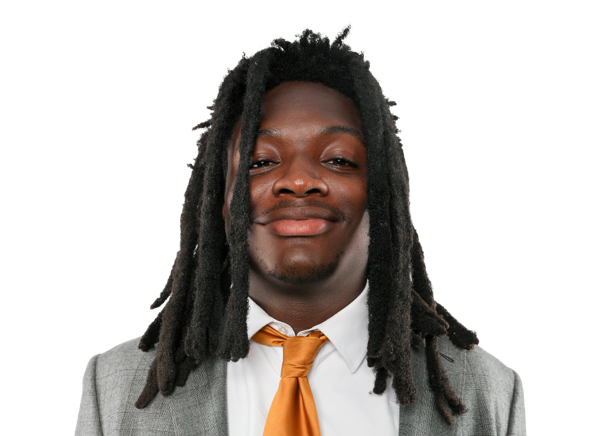 Bryce Cowan#22 | 4 | 2 | 0 | 0 | 0 | 0 | 0 |
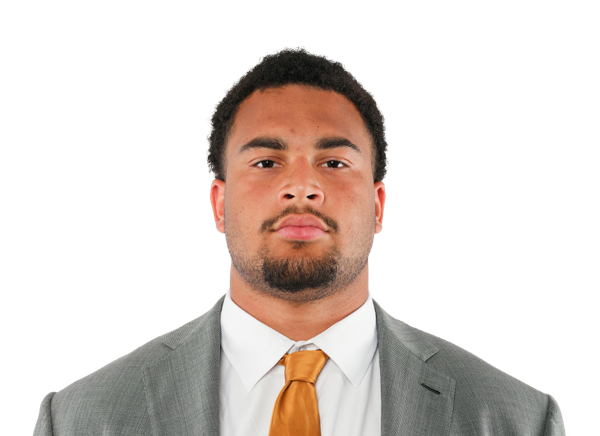 Issa Ouattara#5 | 4 | 2 | 0 | 0 | 0 | 0 | 0 |
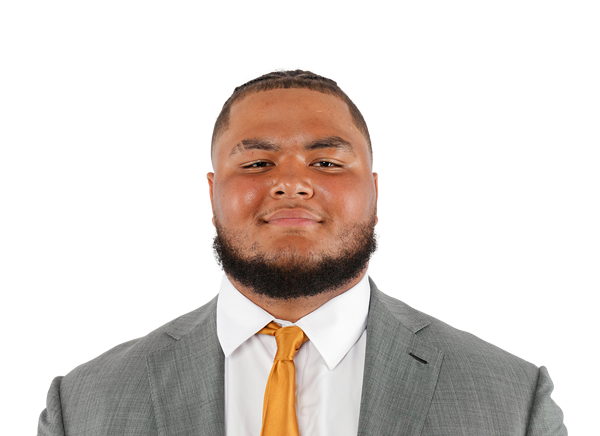 Glenn Seabrooks III#53 | 4 | 0 | 0 | 0 | 0 | 0 | 0 |
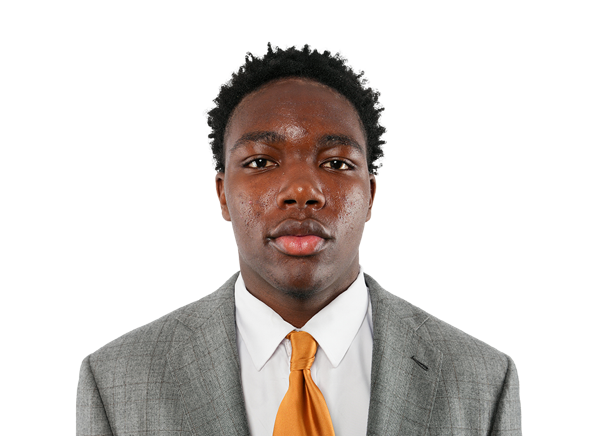 Cayden Daniels#26 | 3 | 2 | 0 | 0 | 2 | 0 | 1 |
 Miles Capers#29 | 3 | 1 | 0 | 1 | 0 | 0 | 0 |
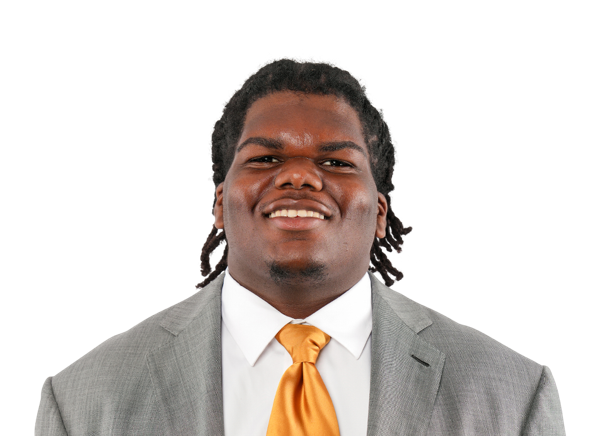 Jaylon Stone#92 | 3 | 0 | 0 | 0 | 0 | 0 | 0 |
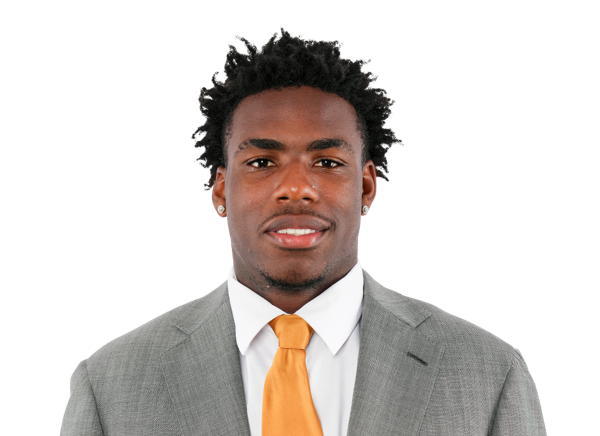 Martel Hight#4 | 2 | 2 | 0 | 0 | 0 | 0 | 0 |
 Mason Carter#32 | 2 | 1 | 0 | 0 | 0 | 0 | 0 |
 Hayden Bray#97 | 1 | 1 | 0 | 1 | 0 | 0 | 0 |
 Dontae Carter#1 | 1 | 1 | 0 | 0 | 0 | 0 | 0 |
 Carson Lawrence#3 | 1 | 1 | 0 | 0 | 0 | 0 | 0 |
 Davin Chandler#21 | 1 | 1 | 0 | 0 | 0 | 0 | 0 |
 Talan Carter#99 | 1 | 1 | 0 | 0 | 0 | 0 | 0 |
NC State| Player | FUM | LOST | REC |
|---|---|---|---|
| Team | 1 | 1 | 0 |
| CJ Bailey#11 | 1 | 1 | 0 |
| Adrian Farrow#47 | 0 | 0 | 1 |
Vanderbilt| Player | FUM | LOST | REC |
|---|---|---|---|
| Jared Curtis#2 | 2 | 1 | 0 |
 Jordan Matthews#6 | 0 | 0 | 1 |
| Cayden Daniels#26 | 0 | 0 | 1 |
NC State| Player | FG | PCT | LONG | XP | PTS |
|---|---|---|---|---|---|
 Kanoah Vinesett#94 | 1/1 | 100.0 | 24 | 4/4 | 7 |
Vanderbilt| Player | FG | PCT | LONG | XP | PTS |
|---|---|---|---|---|---|
 Brock Taylor#88 | 0/0 | 0.0 | 0 | 5/5 | 5 |
NC State| Player | NO | YDS | AVG | TB | In 20 | LONG |
|---|---|---|---|---|---|---|
 Jackson Waller#96 | 3 | 107 | 35.7 | 1 | 0 | 49 |
Vanderbilt| Player | NO | YDS | AVG | TB | In 20 | LONG |
|---|---|---|---|---|---|---|
 Tyler Ebel#37 | 4 | 182 | 45.5 | 0 | 1 | 54 |
NC State| Player | NO | YDS | AVG | LONG | TD |
|---|---|---|---|---|---|
 Jonathan Paylor#14 | 1 | 18 | 18.0 | 18 | 0 |
Vanderbilt| Player | NO | YDS | AVG | LONG | TD |
|---|---|---|---|---|---|
| Evan Hampton#23 | 2 | 39 | 19.5 | 23 | 0 |
 Maurice Veney#19 | 1 | 13 | 13.0 | 13 | 0 |
NC State| Player | NO | YDS | AVG | LONG | TD |
|---|---|---|---|---|---|
| Victor Snow | 1 | 33 | 33.0 | 33 | 0 |
NC State| Player | INT | YDS | TD |
|---|---|---|---|
| Brody Barnhardt#29 | 1 | 0 | 0 |
| Jaren Sensabaugh#14 | 1 | 0 | 0 |
Vanderbilt| Player | INT | YDS | TD |
|---|---|---|---|
| Bryce Cowan#22 | 1 | 0 | 0 |
Drive Summary
NCSU
Touchdown
82
VAN
Punt
10
NCSU
Touchdown
54
VAN
Interception
-5
NCSU
End Of Quarter
-4
VAN
Fumble
13
NCSU
Field Goal
61
VAN
Punt
27
NCSU
Punt
2
VAN
Touchdown
45
NCSU
End Of Half
-1
VAN
Punt
3
NCSU
Interception
30
VAN
Punt
8
NCSU
Touchdown
51
VAN
Touchdown
75
NCSU
Punt
26
VAN
Touchdown
80
NCSU
Touchdown
75
VAN
Touchdown
35
NCSU
Downs
44
VAN
Interception
53
NCSU
Fumble Return Touchdown
-2
NCSU
End Of Quarter
13
Injury Report
No current injury report is available for this matchup.
Head-to-Head
Historical meetings are not available for this matchup.
Game Information
StageWeek 3
Season2026
KickoffSat, Sep 19, 12:45 pm
VenueFirstBank Stadium
LocationNashville, TN
SurfaceArtificial Turf
BroadcastSEC Network
Division Standings
FBS — Atlantic Coast Conference
| Team | W | L | T | Pct | PF | PA | Home | Away | Strk |
|---|---|---|---|---|---|---|---|---|---|
 Miami | 8 | 0 | 0 | 1.000 | 381 | 142 | 4-0 | 4-0 | W8 |
 Pittsburgh | 6 | 3 | 0 | 0.667 | 287 | 178 | 5-1 | 1-2 | W1 |
 SMU | 6 | 2 | 0 | 0.750 | 282 | 178 | 5-0 | 1-2 | L1 |
 Virginia | 4 | 5 | 0 | 0.444 | 233 | 208 | 4-2 | 0-3 | L3 |
 California | 3 | 6 | 0 | 0.333 | 197 | 284 | 2-3 | 1-3 | L3 |
 Duke | 6 | 2 | 0 | 0.750 | 256 | 114 | 4-1 | 2-1 | W2 |
 North Carolina | 4 | 4 | 0 | 0.500 | 206 | 184 | 1-3 | 3-1 | L2 |
 Virginia Tech | 6 | 2 | 0 | 0.750 | 280 | 164 | 3-1 | 3-1 | W2 |
 Boston College | 4 | 4 | 0 | 0.500 | 173 | 212 | 3-1 | 1-3 | L1 |
 Clemson | 5 | 3 | 0 | 0.625 | 186 | 173 | 3-2 | 2-1 | W1 |
 Louisville | 5 | 3 | 0 | 0.625 | 323 | 216 | 4-1 | 1-2 | W3 |
 Georgia Tech | 2 | 6 | 0 | 0.250 | 198 | 246 | 2-3 | 0-3 | L3 |
 Wake Forest | 7 | 1 | 0 | 0.875 | 313 | 143 | 3-1 | 4-0 | W5 |
 Florida State | 3 | 5 | 0 | 0.375 | 245 | 231 | 3-2 | 0-3 | L3 |
 Stanford | 4 | 5 | 0 | 0.444 | 183 | 336 | 4-1 | 0-4 | L1 |
| NC State | 4 | 4 | 0 | 0.500 | 257 | 207 | 4-1 | 0-3 | W1 |
 Syracuse | 4 | 4 | 0 | 0.500 | 251 | 211 | 2-2 | 2-2 | W2 |
FBS — Southeastern Conference
| Team | W | L | T | Pct | PF | PA | Home | Away | Strk |
|---|---|---|---|---|---|---|---|---|---|
 Georgia | 7 | 1 | 0 | 0.875 | 328 | 119 | 5-1 | 2-0 | W1 |
 Alabama | 6 | 2 | 0 | 0.750 | 306 | 170 | 4-1 | 2-1 | W1 |
| Vanderbilt | 3 | 5 | 0 | 0.375 | 182 | 242 | 3-2 | 0-3 | L5 |
 Auburn | 4 | 4 | 0 | 0.500 | 193 | 214 | 3-2 | 1-2 | L2 |
 Florida | 5 | 3 | 0 | 0.625 | 285 | 225 | 3-1 | 2-2 | L1 |
 LSU | 6 | 2 | 0 | 0.750 | 321 | 128 | 5-0 | 1-2 | W2 |
 Mississippi State | 4 | 4 | 0 | 0.500 | 213 | 225 | 2-2 | 2-2 | L4 |
 Missouri | 6 | 2 | 0 | 0.750 | 252 | 147 | 4-0 | 2-2 | W1 |
 Ole Miss | 6 | 2 | 0 | 0.750 | 297 | 192 | 5-0 | 1-2 | W1 |
 South Carolina | 5 | 3 | 0 | 0.625 | 295 | 202 | 3-2 | 2-1 | W3 |
 Tennessee | 6 | 2 | 0 | 0.750 | 258 | 130 | 4-1 | 2-1 | L1 |
 Texas | 6 | 2 | 0 | 0.750 | 246 | 137 | 5-1 | 1-1 | W2 |
 Texas A&M | 4 | 4 | 0 | 0.500 | 226 | 151 | 4-1 | 0-3 | L1 |
 Oklahoma | 4 | 4 | 0 | 0.500 | 176 | 166 | 3-2 | 1-2 | L1 |
 Kentucky | 7 | 1 | 0 | 0.875 | 263 | 198 | 4-1 | 3-0 | W6 |
 Arkansas | 3 | 5 | 0 | 0.375 | 157 | 221 | 2-3 | 1-2 | L1 |
NC State
14th in ACC
VS
Vanderbilt
16th in SEC
Quarterbacks & Specialists
#11
CJ Bailey
#96
Jackson Waller
#10
Will Wilson
Receivers & Backs
#19
Preston Douglas
#5
Davion Dozier
#7
Davion Gause
#8
Keenan Jackson
#34
Noah Moss
#14
Jonathan Paylor
#86
Hunter Provience
#82
Chance Robinson
#1
Jayden Scott
Victor Snow
#2
Joshisa Trader
#13
Tyran Warren
Defensive Line & Linebackers
Popo Aguirre
#31
Bailey Benson
#92
Chase Bond
#42
Ke'Von Carter
#34
Colby Cronk
#25
Sterling Dixon
#5
Harvey Dyson III
#55
Katron Evans
#47
Adrian Farrow
#38
Logan Foust
#35
LaCorian Hodge
#44
Jordan Moreta
#99
AJ Prim
#58
Elijah Satchell
#88
Isaiah Shirley
#53
Josh Warren Jr.
Defensive Backs
#29
Brody Barnhardt
#26
Jordyn Best
#4
King Mack
#7
Brian Nelson II
#2
Ronnie Royal III
#14
Jaren Sensabaugh
#3
Tristan Teasdell
#22
Jackson Vick
#10
Ty White
Other
#94
Kanoah Vinesett
Quarterbacks & Specialists
#2
Jared Curtis
#37
Tyler Ebel
Receivers & Backs
#7
Cole Adams
#28
Sedrick Alexander
#13
Kayleb Barnett
#5
Tristen Brown
#9
Brycen Coleman
#8
Jayvontay Conner
#23
Evan Hampton
#3
Jamezell Lassiter
Junior Sherrill
#19
Maurice Veney
#22
Makhilyn Young
Defensive Line & Linebackers
#97
Hayden Bray
#99
Talan Carter
#22
Bryce Cowan
#11
Bryan Longwell
#94
Bradley Mann
#5
Issa Ouattara
#24
Nick Rinaldi
#53
Glenn Seabrooks III
#92
Jaylon Stone
Defensive Backs
#1
Dontae Carter
#21
Davin Chandler
#26
Cayden Daniels
#8
CJ Heard
#4
Martel Hight
#7
Ricardo Jones
#3
Carson Lawrence
#25
Mason Lewis
#6
Jordan Matthews
Other
#29
Miles Capers
#32
Mason Carter
#17
Edwin Kolenge
#88
Brock Taylor
NC State
14th in ACC
VS
Vanderbilt
16th in SEC
Passing
65.8
Completion Percentage
62.5
154
Completions
158
1.70
Interception Percentage
3.60
4
Interceptions
9
58
Longest Pass
60
1,803
Net Passing Yards
1,893
257.6
Net Passing Yards Per Game
236.6
234
Passing Attempts
253
5.60
Passing Touchdown %
3.60
13
Passing Touchdowns
9
145.4
Passer Rating
130.0
13
Total Sacks
16
94
Sack Yards Lost
96
7.7
Yards Per Pass Attempt
7.5
1,803
Passing Yards
1,893
0
Passing Fumbles Lost
0
7
Team Games Played
8
419.9
Yards Per Game
342.8
32.3
Total Points Per Game
22.8
226
Total Points
182
29
Total Touchdowns
23
257.6
Passing Yards Per Game
236.6
154-234
Comp-Att
158-253
13-94
Sacks-Yards Lost
16-96
Rushing
256
Rushing Attempts
250
1,136
Rushing Yards
849
4.4
Yards Per Rush Attempt
3.4
65
Long Rushing
34
0
20+ Yard Rushing Plays
0
16
Rushing Touchdowns
11
162.3
Rushing Yards Per Game
106.1
0
Rushing Fumbles
0
0
Rushing Fumbles Lost
0
58
Rushing 1st downs
55
7
Team Games Played
8
2,939
Total Yards
2,742
503
Total Offensive Plays
519
32.3
Total Points Per Game
22.8
226
Total Points
182
29
Total Touchdowns
23
Receiving
154
Receptions
158
0
Receiving Targets
0
1,803
Receiving Yards
1,893
1,803
Receiving Yards
1,893
13
Receiving Touchdowns
9
58
Long Reception
60
0
20+ Yard Receiving Plays
0
257.6
Receiving Yards Per Game
236.6
0
Receiving Fumbles
0
0
Receiving Fumbles Lost
0
841
Receiving Yards After Catch
841
83
Receiving First Downs
80
7
Team Games Played
8
11.7
Yards Per Reception
12.0
32.3
Total Points Per Game
22.8
226
Total Points
182
29
Total Touchdowns
23
Miscellaneous
155
Total 1st downs
146
58
Rushing 1st downs
55
83
Passing 1st downs
80
14
1st downs by penalty
11
53
Third Down Conversions
44
102
Third Down Attempts
108
51.96
3rd down %
40.74
7
Fourth Down Conversions
12
12
First Downs Attempts
19
58.33
4th down %
63.16
38
Total Penalties
70
340
Total Penalty Yards
530
13526
Possession Time Seconds
14551
0.00
Red Zone Field Goal Percentage
0.00
0.00
Red Zone Scoring Percentage
0.00
0.00
Red Zone Efficiency Percentage
0.00
0.00
Red Zone Touchdown Percentage
0.00
10
Total Takeaways
11
9
Total Giveaways
14
1
Turnover Ratio
-3
0
Fumbles Lost
0
53-102
3rd down efficiency
44-108
7-12
4th down efficiency
12-19
38-340
Total-Yards
70-530
Defense
194
Solo Tackles
264
234
Assist Tackles
250
428
Total Tackles
514
9
Sacks
16
72
Sack Yards
110
50
Stuffs
49
29
Passes Defended
34
-0.3
Average Interception Yards
2.2
-1
Long Interception
8
0
Miscellaneous Touchdowns
0
0
Kicks Blocked
1
17
Tackles For Loss
27
7
Team Games Played
8
Defensive Interceptions
3
Interceptions
5
-1
Interception Yards
11
0
Interception Touchdowns
0
3--1
INT: Total
5-11
General
7
Fumbles
11
6
Forced Fumbles
3
6
Fumbles Recovered
2
0
Fumbles Touchdowns
1
7
Games Played
8
7-0
Fumbles-Lost
11-0
Returning
7
Kick Returns
14
138
Kick Return Yards
247
19.7
Yards Per Kick Return
17.6
32
Long Kick Return
33
0
Kick Return Touchdowns
0
12
Punt Returns
11
114
Punt Return Yards
149
9.5
Yards Per Punt Return
13.5
33
Long Punt Return
45
0
Punt Return Touchdowns
2
0
Punt Return Fair Catches
0
0
Kick Return Fumbles Lost
0
0
Punt Return Fumbles Lost
0
7
Team Games Played
8
12-114
Punt: Total
11-149
Kicking
7
Field Goal Made
7
7
Field Goal Attempts
9
100.0
Field Goal Percentage
77.8
46
Long Field Goal Made
47
0
Field Goal Attempts 1-19
0
4
Field Goal Attempts 20-29
0
1
Field Goal Attempts 30-39
4
2
Field Goal Attempts 40-49
4
0
Field Goal Attempts 50+
1
27
Extra Points Made
21
27
Extra Point Attempts
21
100.0
Extra Point Percentage
100.0
0
Field Goals Made 1-19
0
4
Field Goals Made 20-29
0
1
Field Goals Made 30-39
4
2
Field Goals Made 40-49
3
0
Field Goals Made 50+
0
48
Total Kicking Points
42
7
Team Games Played
8
33
Touchback Percentage
89
0.0
Average Kickoff Return Yards
0.0
0
Kickoff Return Yards
0
0
Kickoff Returns
0
0-0
Kickoffs: Total
0-0
7-7
FG: Good-Attempts
7-9
Punting
26
Punts
32
1,091
Punt Yards
1,388
58
Long Punt
64
42.0
Gross Average Punt Yards
43.4
42.0
Net Average Punt Yards
43.4
0
Punts Blocked
0
10
Punts Inside 20
11
1
Touchbacks
2
18
Fair Catches
3
3
Punt Returns
15
0
Punt Return Yards
0
0.0
Average Punt Return Yards
0.0
7
Team Games Played
8
26-1,091
Punt: Total Yards
32-1,388
Scoring
16
Rushing Touchdowns
11
13
Receiving Touchdowns
9
0
Return Touchdowns
2
29
Total Touchdowns
23
7
Field Goals
7
27
Kick Extra Points
21
2
Total Two Point Conversions
0
226
Total Points
182
32.3
Total Points Per Game
22.8