

Norfolk State vs Virginia Live Score (11 Sep, 2026)
Score by Quarter
| Team | Q1 | Q2 | Q3 | Q4 | Final |
|---|---|---|---|---|---|
 Norfolk State | 0 | 3 | 0 | 0 | 3 |
 Virginia | 21 | 7 | 14 | 17 | 59 |
Scoring Plays
Q1
7:39
7:39
Jacquon Gibson 6 Yd pass from Beau Pribula (Will Bettridge Kick)
Passing Touchdown
0 – 7
Q1
5:30
5:30
Da'Shawn Martin 27 Yd pass from Beau Pribula (Will Bettridge Kick)
Passing Touchdown
0 – 14
Q1
3:12
3:12
Jacquon Gibson 30 Yd pass from Beau Pribula (Will Bettridge Kick)
Passing Touchdown
0 – 21
Q2
4:05
4:05
Marco Peery 40 Yd Field Goal
Field Goal Good
3 – 21
Q2
1:04
1:04
Peyton Lewis 3 Yd Run (Will Bettridge Kick)
Rushing Touchdown
3 – 28
Q3
10:57
10:57
Ty'Lyric Coleman 1 Yd pass from Eli Holstein (Will Bettridge Kick)
Passing Touchdown
3 – 35
Q3
7:21
7:21
Isaiah Robinson 5 Yd pass from Eli Holstein (Will Bettridge Kick)
Passing Touchdown
3 – 42
Q4
14:54
14:54
Hayden Rollison 12 Yd pass from Cole Geer (Will Bettridge Kick)
Passing Touchdown
3 – 49
Q4
7:23
7:23
Will Bettridge 30 Yd Field Goal
Field Goal Good
3 – 52
Q4
4:17
4:17
Justin Rowe 50 Yd Interception Return (Chris Messmore Kick)
Interception Return Touchdown
3 – 59
Game Leaders
Norfolk StateVirginia
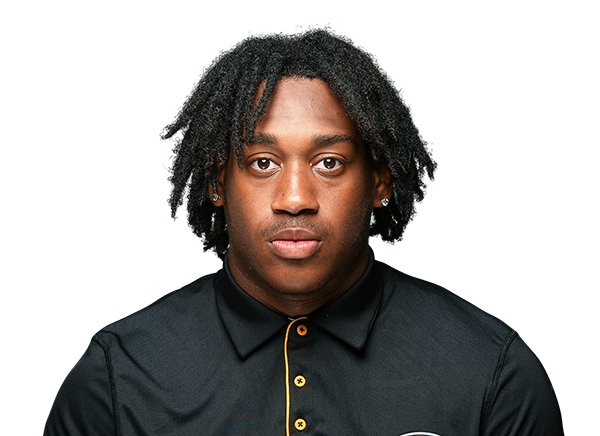 D. Bailey QB
Passing Yards
 B. Pribula QB
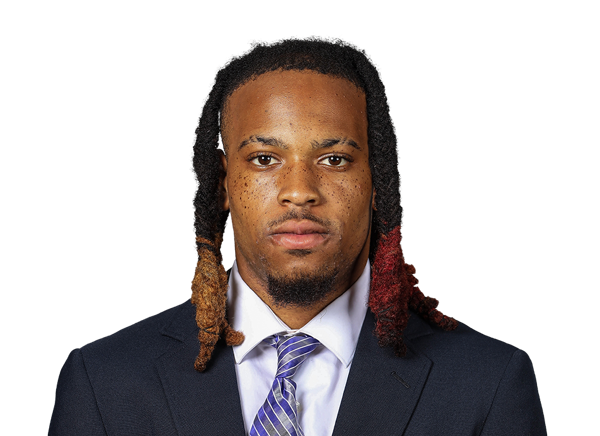 J. Daniels RB
Rushing Yards
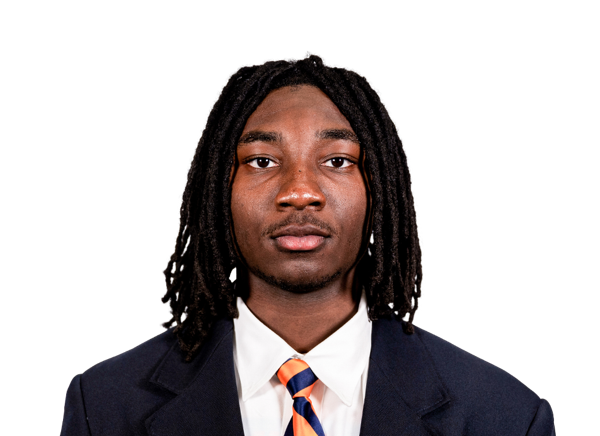 X. Davis RB
 E. Mitchell WR
Receiving Yards
 J. Gibson WR
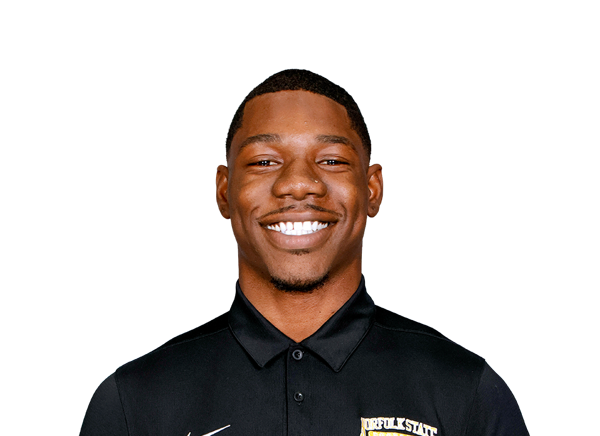 R. Perry LB
Sacks
 N. Anyanwu DE
 B. Thompson LB
Tackles
 J. Henderson CB
Player Box Score
Norfolk State| Player | C/ATT | YDS | AVG | TD | INT | QBR |
|---|---|---|---|---|---|---|
| Deljay Bailey#2 | 15/25 | 142 | 5.7 | 0 | 2 | -- |
 Da'Jean Golmond#6 | 2/6 | 20 | 3.3 | 0 | 0 | -- |
| Ty Jackson#10 | 1/3 | 6 | 2.0 | 0 | 1 | -- |
Virginia| Player | C/ATT | YDS | AVG | TD | INT | QBR |
|---|---|---|---|---|---|---|
| Beau Pribula#7 | 12/14 | 162 | 11.6 | 3 | 1 | 51.0 |
 Cole Geer#6 | 2/4 | 40 | 10.0 | 1 | 0 | 21.5 |
 Eli Holstein#10 | 4/6 | 27 | 4.5 | 2 | 0 | 8.1 |
Norfolk State| Player | CAR | YDS | AVG | TD | LONG |
|---|---|---|---|---|---|
| Jalyn Daniels#3 | 6 | 22 | 3.7 | 0 | 9 |
 Ravon Moore#7 | 8 | 19 | 2.4 | 0 | 4 |
| Da'Jean Golmond#6 | 3 | 9 | 3.0 | 0 | 5 |
| Ty Jackson#10 | 2 | 8 | 4.0 | 0 | 7 |
| Kameron Casnave#28 | 6 | 5 | 0.8 | 0 | 4 |
 Kiron Benjamin#22 | 1 | -3 | -3.0 | 0 | 0 |
| Deljay Bailey#2 | 5 | -5 | -1.0 | 0 | 5 |
Virginia| Player | CAR | YDS | AVG | TD | LONG |
|---|---|---|---|---|---|
| Xay Davis#25 | 11 | 107 | 9.7 | 0 | 44 |
 Noah Vaughn#3 | 8 | 81 | 10.1 | 0 | 21 |
 Jekail Middlebrook#21 | 3 | 15 | 5.0 | 0 | 7 |
 Da'Shawn Martin#18 | 1 | 14 | 14.0 | 0 | 14 |
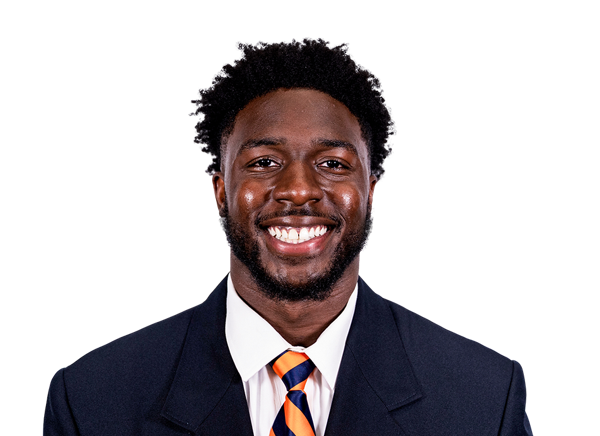 Xavier Brown | 4 | 14 | 3.5 | 0 | 11 |
| Cole Geer#6 | 2 | 9 | 4.5 | 0 | 6 |
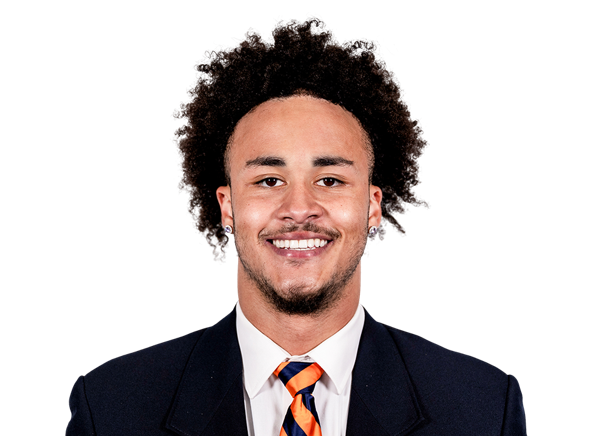 Peyton Lewis#2 | 4 | 7 | 1.8 | 1 | 8 |
| Eli Holstein#10 | 1 | 2 | 2.0 | 0 | 2 |
| Team | 2 | -4 | -2.0 | 0 | 0 |
| Beau Pribula#7 | 2 | -8 | -4.0 | 0 | 2 |
Norfolk State| Player | REC | YDS | AVG | TD | LONG |
|---|---|---|---|---|---|
| Elyjah Mitchell | 5 | 43 | 8.6 | 0 | 12 |
 Paul Billups II#1 | 2 | 37 | 18.5 | 0 | 32 |
| Brevin Caldwell#11 | 2 | 25 | 12.5 | 0 | 18 |
| Ravon Moore#7 | 2 | 18 | 9.0 | 0 | 14 |
| Kiron Benjamin#22 | 1 | 11 | 11.0 | 0 | 11 |
| Jalyn Daniels#3 | 2 | 10 | 5.0 | 0 | 7 |
| Bam Knox#5 | 1 | 9 | 9.0 | 0 | 9 |
| Rocco Ciocca#80 | 2 | 9 | 4.5 | 0 | 7 |
| Shane Kelley#32 | 1 | 6 | 6.0 | 0 | 6 |
Virginia| Player | REC | YDS | AVG | TD | LONG |
|---|---|---|---|---|---|
| Jacquon Gibson#4 | 2 | 36 | 18.0 | 2 | 30 |
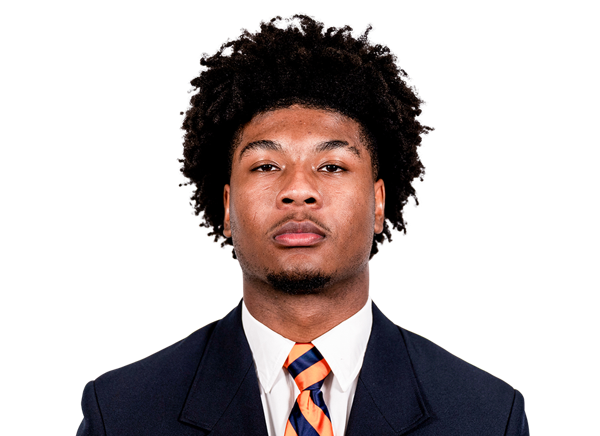 Kameron Courtney#5 | 3 | 35 | 11.7 | 0 | 29 |
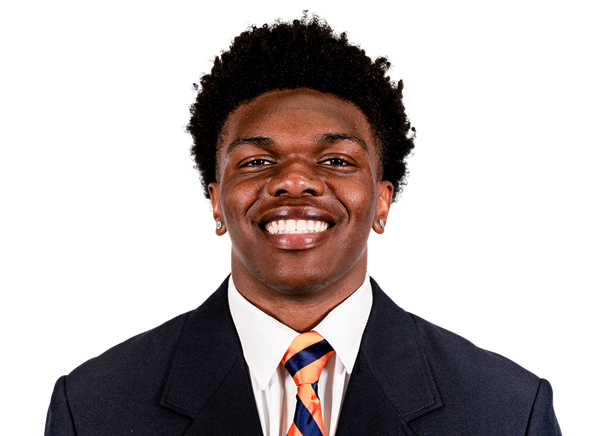 Isaiah Robinson#84 | 2 | 34 | 17.0 | 1 | 29 |
 Willem Thurber#83 | 1 | 28 | 28.0 | 0 | 28 |
| Da'Shawn Martin#18 | 1 | 27 | 27.0 | 1 | 27 |
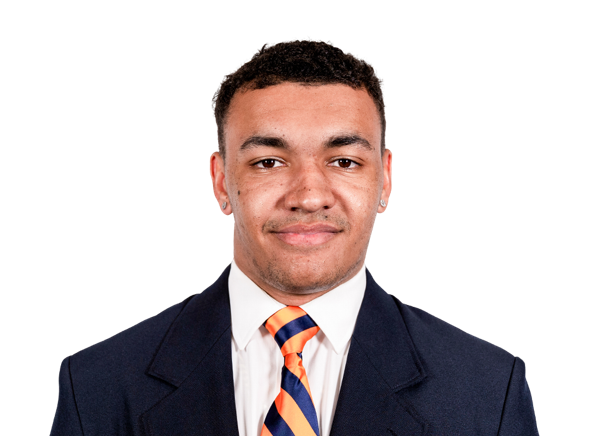 TeKai Kirby#81 | 1 | 16 | 16.0 | 0 | 16 |
 Ty'Lyric Coleman#8 | 3 | 14 | 4.7 | 1 | 7 |
 Hayden Rollison#94 | 1 | 12 | 12.0 | 1 | 12 |
| Xavier Brown | 1 | 11 | 11.0 | 0 | 11 |
| Noah Vaughn#3 | 1 | 6 | 6.0 | 0 | 6 |
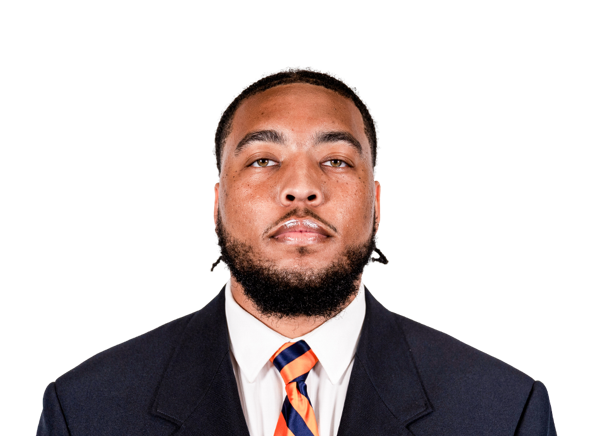 Dakota Twitty#9 | 1 | 5 | 5.0 | 0 | 5 |
| Jekail Middlebrook#21 | 1 | 5 | 5.0 | 0 | 5 |
Norfolk State| Player | TOT | SOLO | SACKS | TFL | PD | QB HUR | TD |
|---|---|---|---|---|---|---|---|
| Brendan Thompson#13 | 9 | 4 | 0 | 0.5 | 0 | 0 | 0 |
 Jordan Saunders#1 | 8 | 1 | 0 | 0 | 0 | 0 | 0 |
| Rontravious Perry#15 | 5 | 4 | 1 | 3 | 0 | 0 | 0 |
 Nasir Bashir#2 | 5 | 2 | 0 | 0 | 0 | 0 | 0 |
 BJ Blake | 4 | 4 | 0 | 0 | 0 | 0 | 0 |
| Javier Waldron#29 | 3 | 3 | 0 | 0 | 0 | 0 | 0 |
| Jaco Pegha#96 | 3 | 2 | 0 | 0.5 | 0 | 0 | 0 |
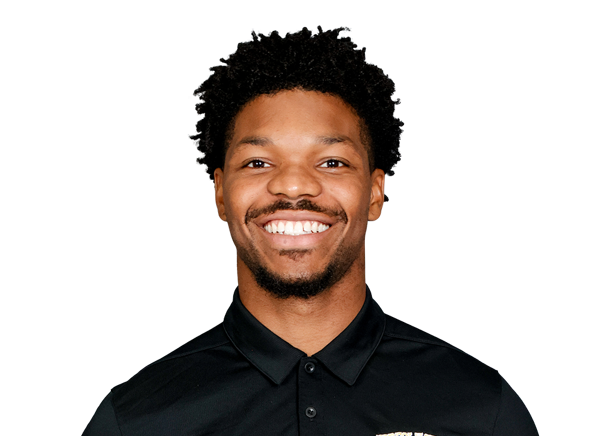 Stephon Hall#5 | 3 | 1 | 0 | 0 | 0 | 0 | 0 |
 Josiah Davis#4 | 3 | 1 | 0 | 1 | 0 | 1 | 0 |
| Kirk Robinson#35 | 3 | 1 | 0 | 0 | 0 | 0 | 0 |
 I'Ziah Emery#20 | 3 | 0 | 0 | 0 | 0 | 0 | 0 |
 Javontay Martin#9 | 2 | 2 | 0 | 0 | 0 | 0 | 0 |
 Jaylen Williams#24 | 2 | 1 | 0 | 0 | 0 | 0 | 0 |
| Caleb Turner#11 | 2 | 1 | 0 | 0 | 0 | 0 | 0 |
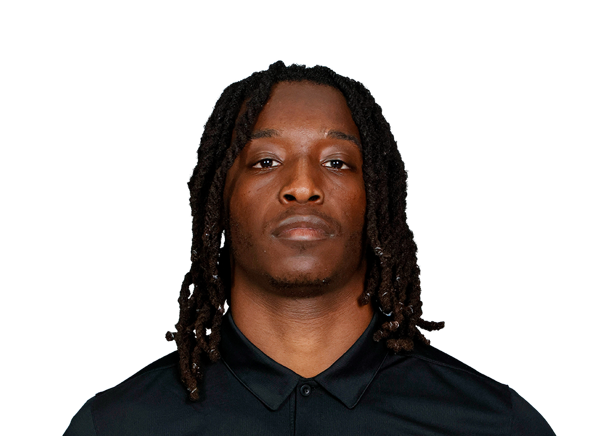 Daizon Allen#10 | 1 | 1 | 0 | 0 | 0 | 0 | 0 |
| Deljay Bailey#2 | 1 | 1 | 0 | 0 | 0 | 0 | 0 |
| Benjamin Hayes#84 | 1 | 1 | 0 | 0 | 0 | 0 | 0 |
| Benjamin Heffron#49 | 1 | 1 | 0 | 0 | 0 | 0 | 0 |
 Mayoy McGodfred#39 | 1 | 1 | 0 | 0 | 0 | 0 | 0 |
 Malik Moses#8 | 1 | 0 | 0 | 0 | 0 | 0 | 0 |
 Jeremiah Henry#12 | 1 | 0 | 0 | 0 | 0 | 0 | 0 |
 Quintin Goins#98 | 1 | 0 | 0 | 0 | 1 | 0 | 0 |
 Princeton Toxey#19 | 1 | 0 | 0 | 0 | 0 | 0 | 0 |
| Tormon Laprade#3 | 1 | 0 | 0 | 0 | 1 | 0 | 0 |
 Logan Candis#65 | 1 | 0 | 0 | 0 | 0 | 0 | 0 |
| Eugene Allen IV#52 | 1 | 0 | 0 | 0 | 0 | 0 | 0 |
| Jihad Brown#23 | 1 | 0 | 0 | 0 | 0 | 0 | 0 |
| Edward Mills#33 | 1 | 0 | 0 | 0 | 0 | 0 | 0 |
| Peyton Surtain#36 | 1 | 0 | 0 | 0 | 0 | 0 | 0 |
| Caleb Sain#44 | 1 | 0 | 0 | 0 | 0 | 0 | 0 |
| Jason Galloway Jr.#48 | 1 | 0 | 0 | 0 | 0 | 0 | 0 |
Virginia| Player | TOT | SOLO | SACKS | TFL | PD | QB HUR | TD |
|---|---|---|---|---|---|---|---|
| Jacobie Henderson#10 | 8 | 5 | 0 | 0 | 1 | 0 | 0 |
 Kam Robinson#5 | 5 | 2 | 0 | 0 | 0 | 0 | 0 |
 Darrion Henry-Young#44 | 5 | 0 | 0 | 0 | 0 | 0 | 0 |
 Christian Ellis#8 | 4 | 1 | 0 | 0 | 0 | 0 | 0 |
 Jewett Hayes#85 | 4 | 1 | 0 | 0 | 0 | 0 | 0 |
 Myles Brown#13 | 4 | 0 | 0 | 1 | 0 | 0 | 0 |
 Justin Rowe#45 | 4 | 0 | 0 | 0.5 | 0 | 0 | 1 |
 Maddox Marcellus#11 | 3 | 2 | 0 | 0 | 0 | 0 | 0 |
 Fisher Camac#14 | 3 | 1 | 0.5 | 0.5 | 0 | 2 | 0 |
 Caleb Hardy#26 | 3 | 1 | 0 | 0.5 | 0 | 0 | 0 |
 Ethan Minter#30 | 3 | 1 | 0 | 0 | 1 | 0 | 0 |
 Anthony Britton#55 | 3 | 0 | 0 | 0 | 0 | 0 | 0 |
 Patrick Campbell#31 | 2 | 2 | 0 | 0 | 0 | 0 | 0 |
 Brandyn Hillman#6 | 2 | 2 | 0 | 0 | 0 | 0 | 0 |
 Keke Adams#21 | 2 | 2 | 0 | 0 | 0 | 0 | 0 |
| Nnanna Anyanwu#33 | 2 | 1 | 1 | 1.5 | 0 | 0 | 0 |
 Justin Townsend#36 | 2 | 1 | 0 | 1.5 | 0 | 1 | 0 |
 Kevin Chadwick Jr.#34 | 2 | 0 | 0 | 0 | 0 | 0 | 0 |
 Billy Koudelka#93 | 2 | 0 | 0 | 0.5 | 0 | 0 | 0 |
 Jam Jackson#9 | 1 | 1 | 0 | 0 | 0 | 0 | 0 |
 Ja'Maric Morris | 1 | 1 | 0 | 0 | 0 | 0 | 0 |
| Isaiah Harris#22 | 1 | 1 | 0 | 0 | 0 | 0 | 0 |
 Kervins Choute#88 | 1 | 0 | 0 | 0.5 | 0 | 0 | 0 |
 Matthew Fobbs-White#16 | 1 | 0 | 0.5 | 0.5 | 0 | 1 | 0 |
 Omillio Agard#20 | 1 | 0 | 0 | 0.5 | 0 | 0 | 0 |
 Jaylen Jones#23 | 1 | 0 | 0 | 0 | 0 | 0 | 0 |
 Landon Danley#32 | 1 | 0 | 0 | 0 | 0 | 0 | 0 |
 Gabe Sneed#47 | 1 | 0 | 0 | 0 | 0 | 0 | 0 |
 Corey Costner#4 | 1 | 0 | 0 | 0 | 0 | 0 | 0 |
 Dallas Brannon#28 | 1 | 0 | 0 | 0 | 0 | 0 | 0 |
 Josiah Persinger#7 | 1 | 0 | 0 | 0.5 | 0 | 0 | 0 |
 Evan Ward#19 | 1 | 0 | 0 | 0 | 0 | 0 | 0 |
 Montino Williams#1 | 1 | 0 | 0 | 0 | 1 | 0 | 0 |
 Jason Hammond#91 | 0 | 0 | 0 | 0 | 1 | 0 | 0 |
 Jonathan Allen#92 | 0 | 0 | 0 | 0 | 1 | 0 | 0 |
Norfolk State| Player | FG | PCT | LONG | XP | PTS |
|---|---|---|---|---|---|
 Marco Peery#97 | 1/2 | 50.0 | 40 | 0/0 | 3 |
Virginia| Player | FG | PCT | LONG | XP | PTS |
|---|---|---|---|---|---|
 Will Bettridge#41 | 1/1 | 100.0 | 30 | 7/7 | 10 |
| Chris Messmore#43 | 0/0 | 0.0 | 0 | 1/1 | 1 |
Norfolk State| Player | NO | YDS | AVG | TB | In 20 | LONG |
|---|---|---|---|---|---|---|
| Marco Peery#97 | 6 | 235 | 39.2 | 0 | 1 | 50 |
Virginia| Player | NO | YDS | AVG | TB | In 20 | LONG |
|---|---|---|---|---|---|---|
 Daniel Sparks#38 | 2 | 108 | 54.0 | 0 | 2 | 61 |
Norfolk State| Player | NO | YDS | AVG | LONG | TD |
|---|---|---|---|---|---|
 Jason Wonodi#12 | 3 | 43 | 14.3 | 18 | 0 |
Virginia| Player | NO | YDS | AVG | LONG | TD |
|---|---|---|---|---|---|
| Jacquon Gibson#4 | 2 | 63 | 31.5 | 37 | 0 |
Virginia| Player | NO | YDS | AVG | LONG | TD |
|---|---|---|---|---|---|
 Josiah Abdullah#13 | 2 | 20 | 10.0 | 13 | 0 |
Norfolk State| Player | INT | YDS | TD |
|---|---|---|---|
| Josiah Davis#4 | 1 | 0 | 0 |
Virginia| Player | INT | YDS | TD |
|---|---|---|---|
| Brandyn Hillman#6 | 2 | 50 | 0 |
| Justin Rowe#45 | 1 | 50 | 1 |
Drive Summary
NORF
Interception
46
UVA
Touchdown
37
NORF
Interception
-10
UVA
Touchdown
22
NORF
Punt
4
UVA
Touchdown
66
NORF
Punt
14
UVA
Punt
27
NORF
Missed FG
76
UVA
Interception
18
NORF
Field Goal
15
UVA
Touchdown
80
NORF
End of Half
9
UVA
Touchdown
59
NORF
Downs
7
UVA
Touchdown
32
NORF
Punt
1
UVA
Punt
-1
NORF
Punt
3
UVA
Touchdown
30
NORF
Punt
20
UVA
Field Goal
55
NORF
Interception Touchdown
19
NORF
Punt
3
UVA
End of Game
47
Injury Report
No current injury report is available for this matchup.
Head-to-Head
Historical meetings are not available for this matchup.
Game Information
StageWeek 2
Season2026
KickoffFri, Sep 11, 7:00 pm
VenueScott Stadium
LocationCharlottesville, VA
SurfaceArtificial Turf
BroadcastACCNX
Attendance46,918
Division Standings
FCS — Mid-Eastern Athletic Conference
| Team | W | L | T | Pct | PF | PA | Home | Away | Strk |
|---|---|---|---|---|---|---|---|---|---|
 South Carolina State | 0 | 0 | 0 | .000 | 0 | 0 | — | — | — |
 Delaware State | 0 | 1 | 0 | 0.000 | 17 | 59 | 0-0 | 0-1 | L1 |
 Morgan State | 0 | 1 | 0 | 0.000 | 7 | 70 | 0-0 | 0-1 | L1 |
 North Carolina Central | 0 | 1 | 0 | 0.000 | 9 | 42 | 0-0 | 0-1 | L1 |
 Howard | 0 | 2 | 0 | 0.000 | 7 | 113 | 0-0 | 0-2 | L2 |
| Norfolk State | 0 | 2 | 0 | 0.000 | 13 | 90 | 0-0 | 0-2 | L2 |
FBS — Atlantic Coast Conference
| Team | W | L | T | Pct | PF | PA | Home | Away | Strk |
|---|---|---|---|---|---|---|---|---|---|
 Miami | 8 | 0 | 0 | 1.000 | 381 | 142 | 4-0 | 4-0 | W8 |
 SMU | 6 | 2 | 0 | 0.750 | 282 | 178 | 5-0 | 1-2 | L1 |
| Virginia | 4 | 5 | 0 | 0.444 | 233 | 208 | 4-2 | 0-3 | L3 |
 California | 3 | 6 | 0 | 0.333 | 197 | 284 | 2-3 | 1-3 | L3 |
 Duke | 6 | 2 | 0 | 0.750 | 256 | 114 | 4-1 | 2-1 | W2 |
 North Carolina | 4 | 4 | 0 | 0.500 | 206 | 184 | 1-3 | 3-1 | L2 |
 Pittsburgh | 6 | 3 | 0 | 0.667 | 287 | 178 | 5-1 | 1-2 | W1 |
 Virginia Tech | 6 | 2 | 0 | 0.750 | 280 | 164 | 3-1 | 3-1 | W2 |
 Wake Forest | 7 | 1 | 0 | 0.875 | 313 | 143 | 3-1 | 4-0 | W5 |
 Boston College | 4 | 4 | 0 | 0.500 | 173 | 212 | 3-1 | 1-3 | L1 |
 Clemson | 5 | 3 | 0 | 0.625 | 186 | 173 | 3-2 | 2-1 | W1 |
 Louisville | 5 | 3 | 0 | 0.625 | 323 | 216 | 4-1 | 1-2 | W3 |
 Georgia Tech | 2 | 6 | 0 | 0.250 | 198 | 246 | 2-3 | 0-3 | L3 |
 Florida State | 3 | 5 | 0 | 0.375 | 245 | 231 | 3-2 | 0-3 | L3 |
 NC State | 4 | 4 | 0 | 0.500 | 257 | 207 | 4-1 | 0-3 | W1 |
 Stanford | 4 | 5 | 0 | 0.444 | 183 | 336 | 4-1 | 0-4 | L1 |
 Syracuse | 4 | 4 | 0 | 0.500 | 251 | 211 | 2-2 | 2-2 | W2 |
Norfolk State
5th in MEAC
VS
Virginia
11th in ACC
Quarterbacks & Specialists
#2
Deljay Bailey
#6
Da'Jean Golmond
#49
Benjamin Heffron
#10
Ty Jackson
Receivers & Backs
#22
Kiron Benjamin
#1
Paul Billups II
#11
Brevin Caldwell
#28
Kameron Casnave
#80
Rocco Ciocca
#3
Jalyn Daniels
#84
Benjamin Hayes
#32
Shane Kelley
#5
Bam Knox
Elyjah Mitchell
#7
Ravon Moore
#12
Jason Wonodi
Defensive Line & Linebackers
#52
Eugene Allen IV
BJ Blake
#65
Logan Candis
#20
I'Ziah Emery
#48
Jason Galloway Jr.
#98
Quintin Goins
#12
Jeremiah Henry
#9
Javontay Martin
#8
Malik Moses
#96
Jaco Pegha
#15
Rontravious Perry
#44
Caleb Sain
#13
Brendan Thompson
#19
Princeton Toxey
#24
Jaylen Williams
Defensive Backs
#10
Daizon Allen
#2
Nasir Bashir
#23
Jihad Brown
#4
Josiah Davis
#5
Stephon Hall
#3
Tormon Laprade
#39
Mayoy McGodfred
#33
Edward Mills
#35
Kirk Robinson
#1
Jordan Saunders
#36
Peyton Surtain
#11
Caleb Turner
#29
Javier Waldron
Other
#97
Marco Peery
Quarterbacks & Specialists
#6
Cole Geer
#10
Eli Holstein
#7
Beau Pribula
#38
Daniel Sparks
Receivers & Backs
#13
Josiah Abdullah
Xavier Brown
#8
Ty'Lyric Coleman
#5
Kameron Courtney
#25
Xay Davis
#4
Jacquon Gibson
#81
TeKai Kirby
#2
Peyton Lewis
#18
Da'Shawn Martin
#21
Jekail Middlebrook
#84
Isaiah Robinson
#94
Hayden Rollison
#83
Willem Thurber
#9
Dakota Twitty
#3
Noah Vaughn
Defensive Line & Linebackers
#92
Jonathan Allen
#33
Nnanna Anyanwu
#28
Dallas Brannon
#55
Anthony Britton
#13
Myles Brown
#14
Fisher Camac
#88
Kervins Choute
#32
Landon Danley
#16
Matthew Fobbs-White
#91
Jason Hammond
#26
Caleb Hardy
#85
Jewett Hayes
#44
Darrion Henry-Young
#93
Billy Koudelka
#11
Maddox Marcellus
#5
Kam Robinson
#45
Justin Rowe
#47
Gabe Sneed
#36
Justin Townsend
#19
Evan Ward
Defensive Backs
#21
Keke Adams
#20
Omillio Agard
#31
Patrick Campbell
#34
Kevin Chadwick Jr.
#4
Corey Costner
#8
Christian Ellis
#22
Isaiah Harris
#10
Jacobie Henderson
#6
Brandyn Hillman
#9
Jam Jackson
#23
Jaylen Jones
#30
Ethan Minter
Ja'Maric Morris
#7
Josiah Persinger
#1
Montino Williams
Other
#41
Will Bettridge
#43
Chris Messmore
Norfolk State
4th in MEAC
VS
Virginia
10th in ACC
Passing
60.1
Completion Percentage
63.8
146
Completions
134
3.70
Interception Percentage
1.00
9
Interceptions
2
59
Longest Pass
74
1,573
Net Passing Yards
1,594
196.6
Net Passing Yards Per Game
199.3
243
Passing Attempts
210
4.50
Passing Touchdown %
8.10
11
Passing Touchdowns
17
122.2
Passer Rating
152.4
14
Total Sacks
26
91
Sack Yards Lost
183
6.5
Yards Per Pass Attempt
7.6
1,573
Passing Yards
1,594
0
Passing Fumbles Lost
0
8
Team Games Played
8
398.5
Yards Per Game
360.9
31.8
Total Points Per Game
28.3
254
Total Points
226
33
Total Touchdowns
29
196.6
Passing Yards Per Game
199.3
146-243
Comp-Att
134-210
14-91
Sacks-Yards Lost
26-183
Rushing
302
Rushing Attempts
333
1,615
Rushing Yards
1,293
5.3
Yards Per Rush Attempt
3.9
95
Long Rushing
47
0
20+ Yard Rushing Plays
0
15
Rushing Touchdowns
11
201.9
Rushing Yards Per Game
161.6
0
Rushing Fumbles
0
0
Rushing Fumbles Lost
0
76
Rushing 1st downs
80
8
Team Games Played
8
3,188
Total Yards
2,887
559
Total Offensive Plays
569
31.8
Total Points Per Game
28.3
254
Total Points
226
33
Total Touchdowns
29
Receiving
146
Receptions
134
0
Receiving Targets
0
1,573
Receiving Yards
1,594
1,573
Receiving Yards
1,594
11
Receiving Touchdowns
17
59
Long Reception
74
0
20+ Yard Receiving Plays
0
196.6
Receiving Yards Per Game
199.3
0
Receiving Fumbles
0
0
Receiving Fumbles Lost
0
138
Receiving Yards After Catch
825
70
Receiving First Downs
72
8
Team Games Played
8
10.8
Yards Per Reception
11.9
31.8
Total Points Per Game
28.3
254
Total Points
226
33
Total Touchdowns
29
Miscellaneous
163
Total 1st downs
168
76
Rushing 1st downs
80
71
Passing 1st downs
72
16
1st downs by penalty
16
39
Third Down Conversions
35
107
Third Down Attempts
108
36.45
3rd down %
32.41
6
Fourth Down Conversions
16
17
First Downs Attempts
24
35.29
4th down %
66.67
66
Total Penalties
39
667
Total Penalty Yards
375
15254
Possession Time Seconds
15385
0.00
Red Zone Field Goal Percentage
0.00
0.00
Red Zone Scoring Percentage
0.00
0.00
Red Zone Efficiency Percentage
0.00
0.00
Red Zone Touchdown Percentage
0.00
16
Total Takeaways
4
14
Total Giveaways
5
2
Turnover Ratio
-1
0
Fumbles Lost
0
39-107
3rd down efficiency
35-108
6-17
4th down efficiency
16-24
66-667
Total-Yards
39-375
Defense
262
Solo Tackles
224
214
Assist Tackles
330
476
Total Tackles
554
18
Sacks
15
113
Sack Yards
106
62
Stuffs
59
29
Passes Defended
33
13.8
Average Interception Yards
12.5
40
Long Interception
50
0
Miscellaneous Touchdowns
0
1
Kicks Blocked
0
35
Tackles For Loss
31
8
Team Games Played
8
Defensive Interceptions
11
Interceptions
8
152
Interception Yards
100
2
Interception Touchdowns
1
11-152
INT: Total
8-100
General
10
Fumbles
5
4
Forced Fumbles
2
7
Fumbles Recovered
2
0
Fumbles Touchdowns
0
8
Games Played
8
10-0
Fumbles-Lost
5-0
Returning
18
Kick Returns
6
270
Kick Return Yards
160
15.0
Yards Per Kick Return
26.7
34
Long Kick Return
37
0
Kick Return Touchdowns
0
17
Punt Returns
8
420
Punt Return Yards
51
24.7
Yards Per Punt Return
6.4
76
Long Punt Return
13
5
Punt Return Touchdowns
0
0
Punt Return Fair Catches
0
0
Kick Return Fumbles Lost
0
0
Punt Return Fumbles Lost
0
8
Team Games Played
8
17-420
Punt: Total
8-51
Kicking
8
Field Goal Made
8
12
Field Goal Attempts
11
66.7
Field Goal Percentage
72.7
48
Long Field Goal Made
47
0
Field Goal Attempts 1-19
0
3
Field Goal Attempts 20-29
1
4
Field Goal Attempts 30-39
5
3
Field Goal Attempts 40-49
5
2
Field Goal Attempts 50+
0
30
Extra Points Made
28
32
Extra Point Attempts
28
93.8
Extra Point Percentage
100.0
0
Field Goals Made 1-19
0
3
Field Goals Made 20-29
1
2
Field Goals Made 30-39
3
3
Field Goals Made 40-49
4
0
Field Goals Made 50+
0
54
Total Kicking Points
52
8
Team Games Played
8
23
Touchback Percentage
72
0.0
Average Kickoff Return Yards
0.0
0
Kickoff Return Yards
0
0
Kickoff Returns
0
0-0
Kickoffs: Total
0-0
8-12
FG: Good-Attempts
8-11
Punting
31
Punts
36
1,158
Punt Yards
1,840
51
Long Punt
73
37.4
Gross Average Punt Yards
51.1
37.4
Net Average Punt Yards
51.1
0
Punts Blocked
0
12
Punts Inside 20
15
1
Touchbacks
2
7
Fair Catches
8
11
Punt Returns
14
0
Punt Return Yards
0
0.0
Average Punt Return Yards
0.0
8
Team Games Played
8
31-1,158
Punt: Total Yards
36-1,840
Scoring
15
Rushing Touchdowns
11
11
Receiving Touchdowns
17
5
Return Touchdowns
0
31
Total Touchdowns
28
8
Field Goals
8
30
Kick Extra Points
28
1
Total Two Point Conversions
0
254
Total Points
226
31.8
Total Points Per Game
28.3