

North Dakota State vs Air Force Live Score (13 Sep, 2026)
Score by Quarter
| Team | Q1 | Q2 | Q3 | Q4 | Final |
|---|---|---|---|---|---|
 North Dakota State |
7 | 21 | 7 | 3 | 38 |
 Air Force |
0 | 13 | 0 | 19 | 32 |
Scoring Plays
Q1
9:54
9:54
M. Mitchell run for 31 yds, for a TD (D. Klein KICK)
Rushing Touchdown
7 – 0
Q2
14:08
14:08
N. Hayes run for 17 yds, for a TD (D. Klein KICK)
Rushing Touchdown
14 – 0
Q2
8:14
8:14
M. Hayes pass to A. Hrynciw for 29 yds, for a TD (C. Cremascoli KICK)
Pass Reception
14 – 7
Q2
5:20
5:20
N. Hayes pass to M. Collins for 44 yds, for a TD (D. Klein KICK)
Passing Touchdown
21 – 7
Q2
1:48
1:48
N. Hayes pass intercepted, B. Fletcher return for 95 yds, for a TD (C. Cremascoli PAT BLOCKED)
Interception Return Touchdown
21 – 13
Q2
0:29
0:29
M. Mitchell run for 1 yd, for a TD (D. Klein KICK)
Rushing Touchdown
28 – 13
Q3
12:02
12:02
N. Hayes pass to L. Conklin for 41 yds, for a TD (D. Klein KICK)
Passing Touchdown
35 – 13
Q4
10:59
10:59
L. Szarka run for 2 yds, for a TD (Two-Point Conversion failed)
Rushing Touchdown
35 – 19
Q4
4:26
4:26
K. Hodges run for 2 yds, for a TD
Rushing Touchdown
35 – 25
Q4
1:58
1:58
D. Klein 56 yd FG GOOD
Field Goal Good
38 – 25
Q4
0:50
0:50
E. Medders pass to M. Long for 20 yds, for a TD (C. Cremascoli KICK)
Passing Touchdown
38 – 32
Game Leaders
North Dakota StateAir Force
 N. Hayes QB
Passing Yards
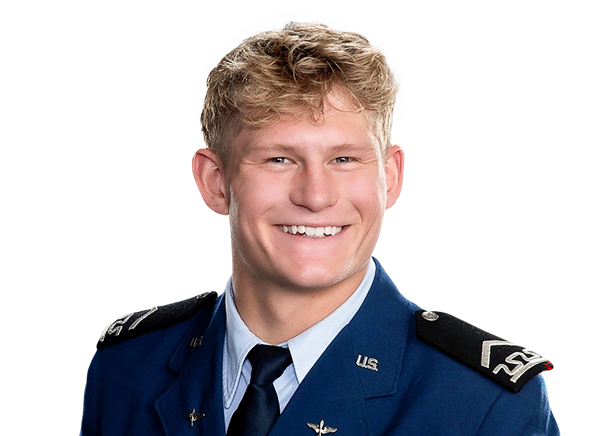 L. Szarka QB
 M. Mitchell RB
Rushing Yards
L. Szarka QB L. Conklin WR
Receiving Yards
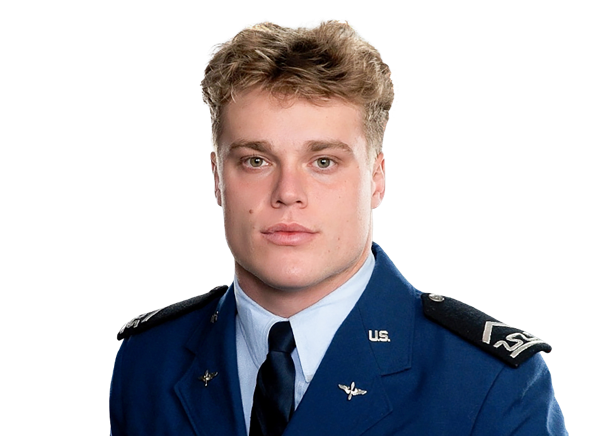 M. Long WR
 P. Haugo LB
Sacks
—
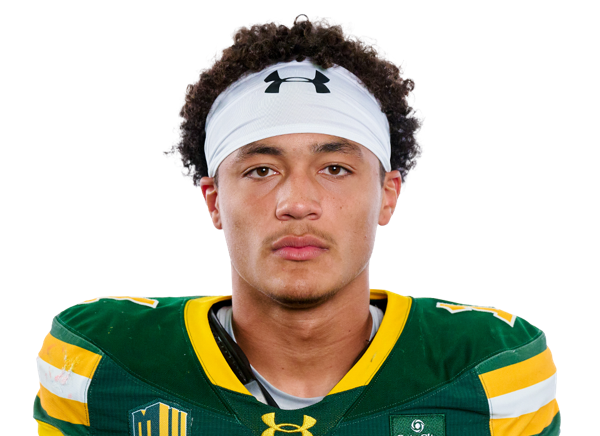 D. Woolen LB
Tackles
 B. Fletcher LB
Player Box Score
North Dakota State| Player | C/ATT | YDS | AVG | TD | INT |
|---|---|---|---|---|---|
| Nathan Hayes#2 | 15/23 | 228 | 9.9 | 2 | 1 |
Air Force| Player | C/ATT | YDS | AVG | TD | INT |
|---|---|---|---|---|---|
| Liam Szarka#9 | 5/10 | 103 | 10.3 | 0 | 1 |
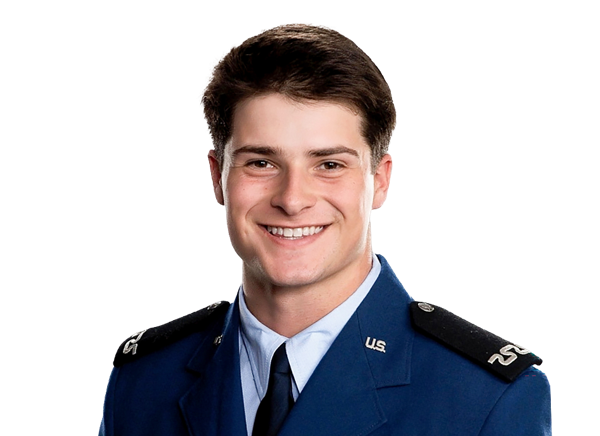 Evan Medders#5 | 3/4 | 47 | 11.8 | 1 | 0 |
 Mason Hayes#18 | 1/1 | 29 | 29.0 | 1 | 0 |
North Dakota State| Player | CAR | YDS | AVG | TD | LONG |
|---|---|---|---|---|---|
| Myles Mitchell#5 | 15 | 61 | 4.1 | 2 | 31 |
 DJ Scott#7 | 12 | 34 | 2.8 | 0 | 8 |
 Nyeoti Punni#4 | 3 | 19 | 6.3 | 0 | 15 |
 Jackson Williams#18 | 2 | 18 | 9.0 | 0 | 10 |
| Nathan Hayes#2 | 3 | 17 | 5.7 | 1 | 17 |
 Team | 2 | -3 | -1.5 | 0 | 3 |
Air Force| Player | CAR | YDS | AVG | TD | LONG |
|---|---|---|---|---|---|
| Liam Szarka#9 | 21 | 88 | 4.2 | 1 | 12 |
 Owen Allen#2 | 13 | 53 | 4.1 | 0 | 11 |
| Evan Medders#5 | 6 | 31 | 5.2 | 0 | 11 |
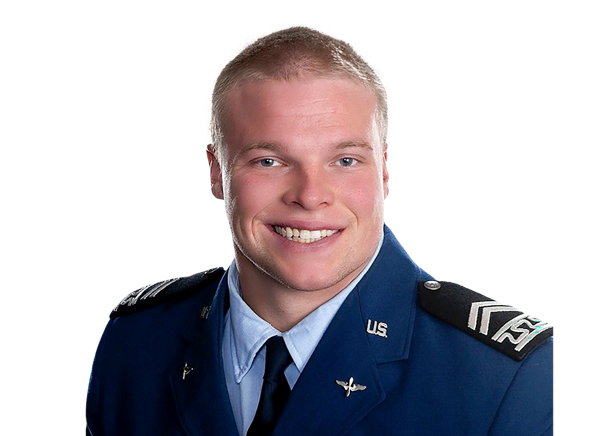 Kemper Hodges#4 | 6 | 24 | 4.0 | 1 | 9 |
 Rocco Conti#44 | 4 | 9 | 2.3 | 0 | 7 |
| Matt Long#3 | 1 | 2 | 2.0 | 0 | 2 |
North Dakota State| Player | REC | YDS | AVG | TD | LONG |
|---|---|---|---|---|---|
| Logan Conklin#84 | 2 | 57 | 28.5 | 1 | 41 |
| Jackson Williams#18 | 2 | 53 | 26.5 | 0 | 51 |
 Mekhi Collins#15 | 1 | 44 | 44.0 | 1 | 44 |
 Reis Kessel#81 | 4 | 42 | 10.5 | 0 | 23 |
| Myles Mitchell#5 | 2 | 11 | 5.5 | 0 | 6 |
| DJ Scott#7 | 1 | 8 | 8.0 | 0 | 8 |
| Nyeoti Punni#4 | 2 | 8 | 4.0 | 0 | 6 |
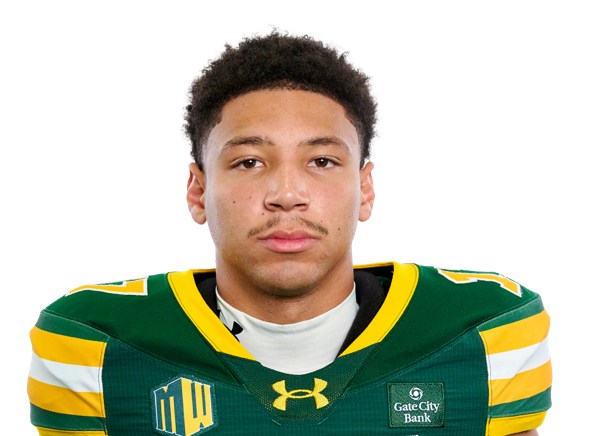 Isiah St. Romain#17 | 1 | 5 | 5.0 | 0 | 5 |
Air Force| Player | REC | YDS | AVG | TD | LONG |
|---|---|---|---|---|---|
| Matt Long#3 | 2 | 55 | 27.5 | 1 | 35 |
 Adam Hrynciw#10 | 2 | 42 | 21.0 | 1 | 29 |
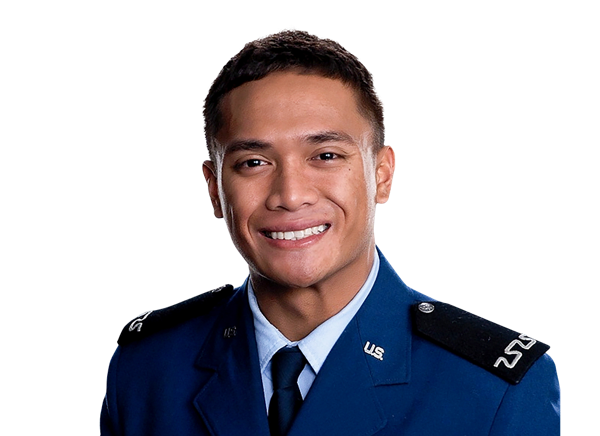 Sylas Maiava-Alaimalo#29 | 2 | 34 | 17.0 | 0 | 26 |
 Simon Kibbee#80 | 2 | 27 | 13.5 | 0 | 14 |
| Rocco Conti#44 | 1 | 21 | 21.0 | 0 | 21 |
North Dakota State| Player | TOT | SOLO | SACKS | TFL | PD | QB HUR | TD |
|---|---|---|---|---|---|---|---|
| Donovan Woolen#1 | 11 | 7 | 0 | 0 | 1 | 1 | 0 |
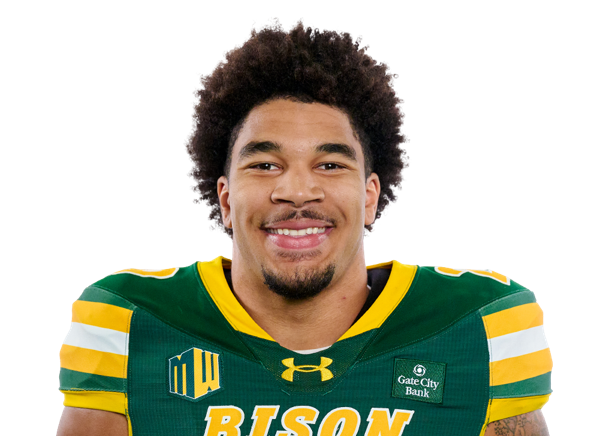 Darius Givance#29 | 7 | 5 | 0 | 0 | 0 | 0 | 0 |
 Taylen Eady#14 | 7 | 4 | 0 | 0 | 0 | 0 | 0 |
| Peder Haugo#41 | 6 | 3 | 1 | 1 | 0 | 0 | 0 |
 Gavin Sell#3 | 6 | 3 | 0 | 0 | 0 | 0 | 0 |
 Logan Larson#94 | 5 | 4 | 0 | 0 | 0 | 1 | 0 |
 Keenan Wilson#8 | 5 | 3 | 0 | 0 | 0 | 0 | 0 |
 Najee Nelson#4 | 3 | 3 | 0 | 0 | 0 | 0 | 0 |
 Jaylen Archibald#30 | 2 | 2 | 0 | 0 | 0 | 0 | 0 |
 Keith Williams#52 | 2 | 1 | 0 | 0 | 0 | 0 | 0 |
 Matthew Stenbroten#11 | 2 | 1 | 0 | 0 | 0 | 1 | 0 |
 Alijah Wayne#54 | 2 | 1 | 0 | 0 | 0 | 0 | 0 |
 DJ Voltz#12 | 1 | 1 | 0 | 0 | 0 | 0 | 0 |
 Alex Elliott#42 | 1 | 0 | 0 | 0 | 0 | 0 | 0 |
 Hudson Artz#22 | 1 | 0 | 0 | 0 | 0 | 0 | 0 |
 Noah Taylor#21 | 1 | 0 | 0 | 0 | 0 | 0 | 0 |
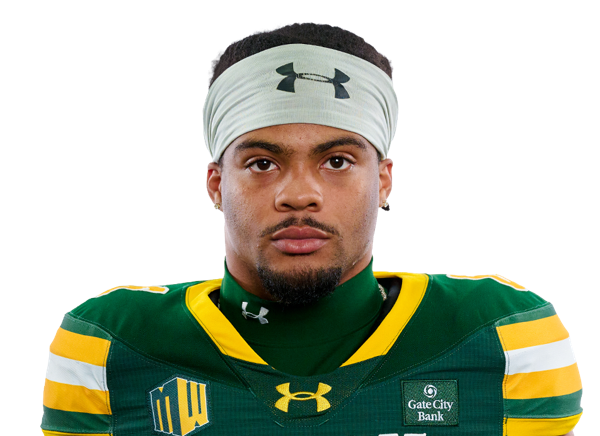 Jaylin Crumby#6 | 1 | 0 | 0 | 0 | 0 | 0 | 0 |
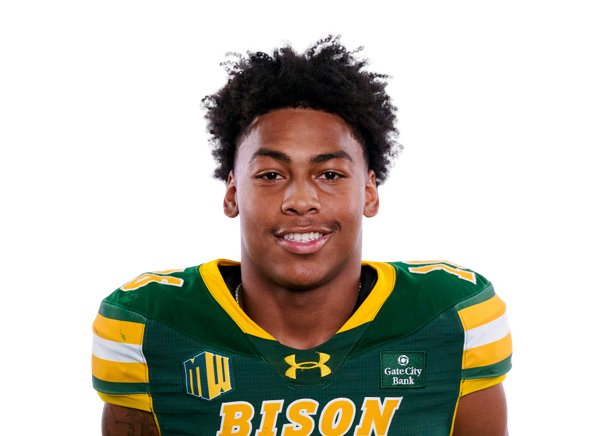 Marion Moore#16 | 1 | 0 | 0 | 0 | 2 | 0 | 0 |
 Blake Schiltz#48 | 1 | 0 | 0 | 0 | 0 | 0 | 0 |
 Anthony Okes#93 | 1 | 0 | 0 | 0 | 0 | 0 | 0 |
Air Force| Player | TOT | SOLO | SACKS | TFL | PD | QB HUR | TD |
|---|---|---|---|---|---|---|---|
| Blake Fletcher#6 | 14 | 8 | 0 | 0 | 0 | 0 | 1 |
 Dallas Daley#8 | 11 | 5 | 0 | 1 | 1 | 1 | 0 |
 Max Mustell#36 | 5 | 3 | 0 | 1 | 0 | 0 | 0 |
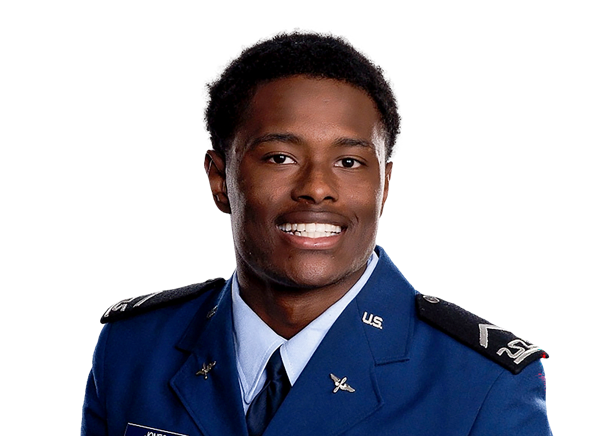 Roger Jones Jr.#5 | 4 | 2 | 0 | 0 | 0 | 0 | 0 |
 Antonio Menard#48 | 4 | 2 | 0 | 0 | 0 | 0 | 0 |
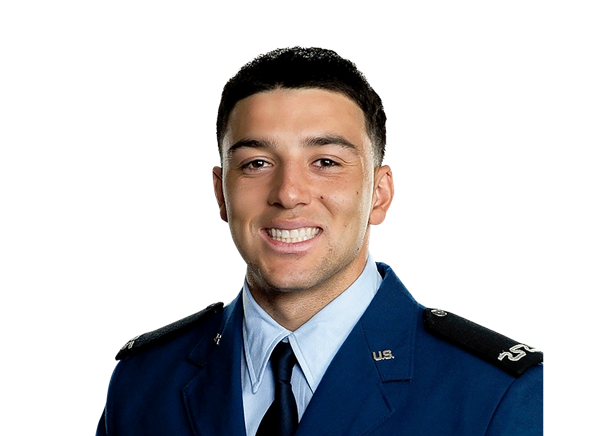 Alexander Perez#26 | 4 | 2 | 0 | 0 | 1 | 0 | 0 |
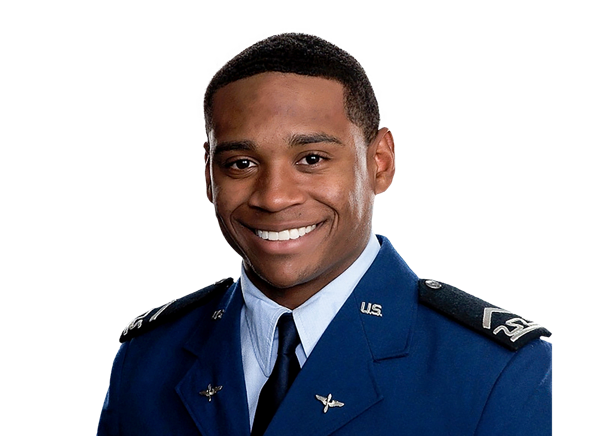 Korey Johnson#2 | 3 | 2 | 0 | 0 | 0 | 0 | 0 |
 Ehimen Oyamendan#22 | 3 | 1 | 0 | 0 | 0 | 0 | 0 |
 Jayden Oquendo#99 | 3 | 0 | 0 | 0 | 0 | 0 | 0 |
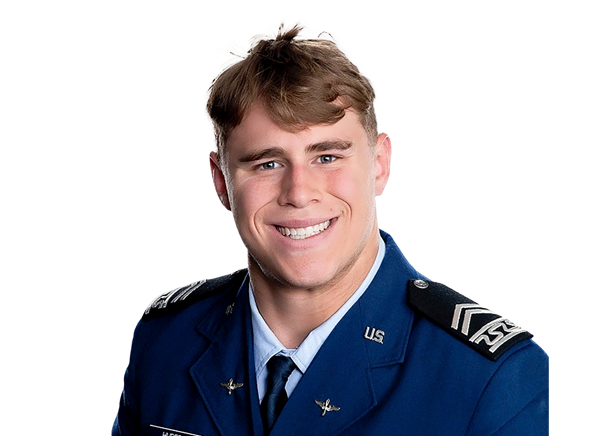 Isaac Hubert#30 | 2 | 1 | 0 | 0.5 | 0 | 0 | 0 |
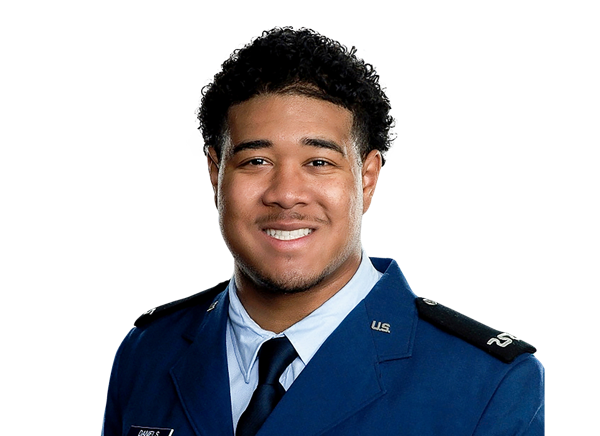 Noah Daniels#95 | 2 | 1 | 0 | 0 | 0 | 0 | 0 |
 Chaz Barnett#59 | 2 | 0 | 0 | 0.5 | 0 | 0 | 0 |
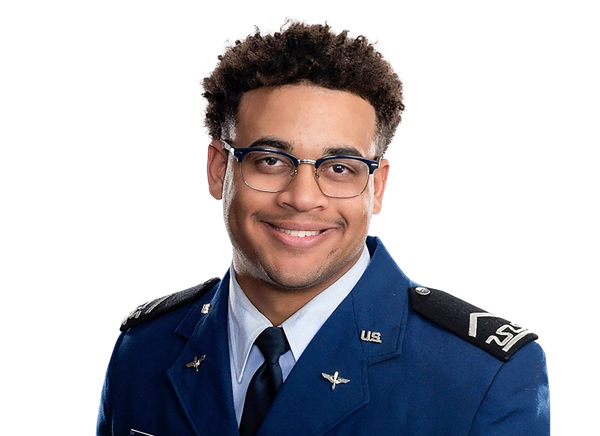 Jaylin Reese#45 | 1 | 1 | 0 | 0 | 0 | 1 | 0 |
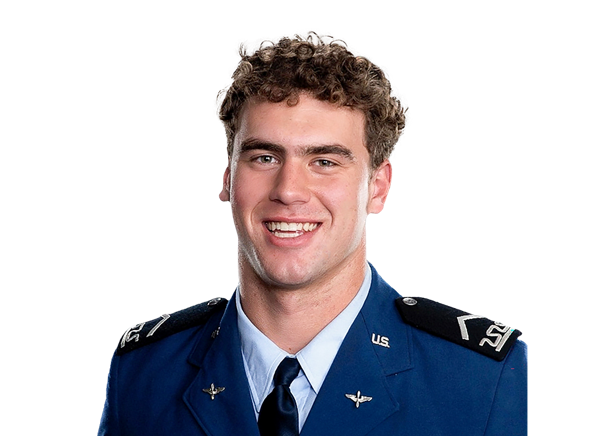 Gage LaDue#28 | 1 | 1 | 0 | 0 | 0 | 0 | 0 |
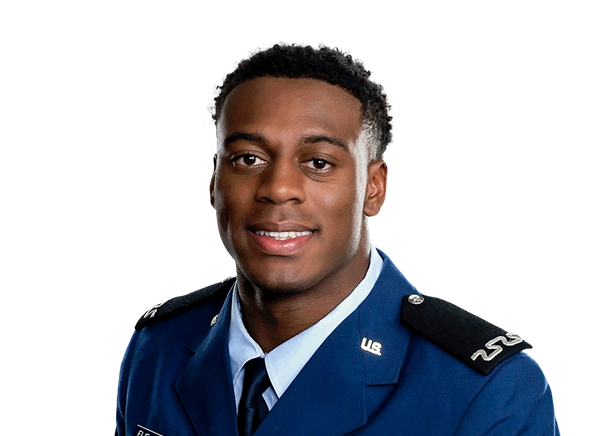 Jordan Elie-Stuart#24 | 1 | 1 | 0 | 0 | 1 | 0 | 0 |
 Brody Bujnoch#33 | 1 | 0 | 0 | 0 | 0 | 0 | 0 |
 Vinnie Canosa#51 | 1 | 0 | 0 | 0 | 0 | 0 | 0 |
North Dakota State| Player | FG | PCT | LONG | XP | PTS |
|---|---|---|---|---|---|
 Drew Klein#37 | 1/1 | 100.0 | 56 | 5/5 | 8 |
Air Force| Player | FG | PCT | LONG | XP | PTS |
|---|---|---|---|---|---|
 Carter Cremascoli#90 | 0/1 | 0.0 | 0 | 2/3 | 2 |
North Dakota State| Player | NO | YDS | AVG | TB | In 20 | LONG |
|---|---|---|---|---|---|---|
 Aaron Bickerton#39 | 3 | 156 | 52.0 | 1 | 0 | 61 |
Air Force| Player | NO | YDS | AVG | TB | In 20 | LONG |
|---|---|---|---|---|---|---|
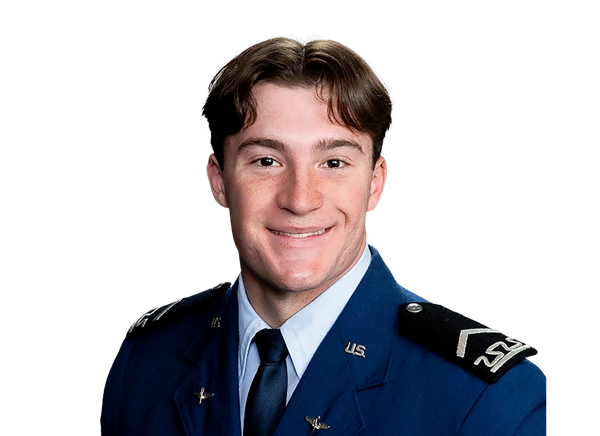 Will Duncan#94 | 3 | 167 | 55.7 | 1 | 0 | 67 |
North Dakota State| Player | NO | YDS | AVG | LONG | TD |
|---|---|---|---|---|---|
| Jackson Williams#18 | 1 | 40 | 40.0 | 40 | 0 |
North Dakota State| Player | INT | YDS | TD |
|---|---|---|---|
| Gavin Sell#3 | 1 | 25 | 0 |
Air Force| Player | INT | YDS | TD |
|---|---|---|---|
| Blake Fletcher#6 | 1 | 85 | 1 |
Drive Summary
NDSU
Touchdown
75
AFA
Punt
8
NDSU
Touchdown
80
AFA
Punt
7
NDSU
Punt
3
AFA
Touchdown
72
NDSU
Touchdown
75
AFA
Interception
12
NDSU
Interception Touchdown
12
NDSU
Touchdown
65
AFA
End Of Half
1
AFA
Punt
-6
NDSU
Touchdown
39
AFA
Missed FG
64
NDSU
Punt
4
AFA
Touchdown
73
NDSU
Punt
14
AFA
Touchdown
80
NDSU
Field Goal
13
AFA
Touchdown
75
NDSU
End Of Quarter
-3
Injury Report
No current injury report is available for this matchup.
Head-to-Head
Historical meetings are not available for this matchup.
Game Information
StageWeek 2
Season2026
KickoffSat, Sep 12, 10:00 pm
VenueFalcon Stadium
LocationUSAF Academy, CO
SurfaceArtificial Turf
BroadcastFS1
Division Standings
FBS — Mountain West Conference
| Team | W | L | T | Pct | PF | PA | Home | Away | Strk |
|---|---|---|---|---|---|---|---|---|---|
| North Dakota State | 7 | 2 | 0 | 0.778 | 253 | 107 | 5-0 | 2-2 | W1 |
 UNLV | 6 | 4 | 0 | 0.600 | 256 | 248 | 3-2 | 3-2 | W1 |
 New Mexico | 8 | 2 | 0 | 0.800 | 328 | 119 | 4-1 | 4-1 | L1 |
 San José State | 5 | 6 | 0 | 0.455 | 212 | 244 | 2-3 | 3-3 | L1 |
 Nevada | 4 | 6 | 0 | 0.400 | 215 | 219 | 2-3 | 2-3 | W1 |
 UTEP | 1 | 8 | 0 | 0.111 | 127 | 309 | 1-4 | 0-4 | L7 |
 Wyoming | 6 | 3 | 0 | 0.667 | 197 | 195 | 4-0 | 2-3 | W4 |
 Northern Illinois | 0 | 10 | 0 | 0.000 | 156 | 359 | 0-4 | 0-6 | L10 |
| Air Force | 8 | 2 | 0 | 0.800 | 282 | 196 | 5-1 | 3-1 | W3 |
 Hawai'i | 3 | 6 | 0 | 0.333 | 183 | 210 | 1-3 | 2-3 | W2 |
North Dakota State
2nd in Mountain West
VS
Air Force
2nd in Mountain West
Quarterbacks & Specialists
#39
Aaron Bickerton
#2
Nathan Hayes
Receivers & Backs
#15
Mekhi Collins
#84
Logan Conklin
#81
Reis Kessel
#5
Myles Mitchell
#4
Nyeoti Punni
#7
DJ Scott
#17
Isiah St. Romain
#18
Jackson Williams
Defensive Line & Linebackers
#42
Alex Elliott
#41
Peder Haugo
#94
Logan Larson
#93
Anthony Okes
#48
Blake Schiltz
#3
Gavin Sell
#11
Matthew Stenbroten
#21
Noah Taylor
#54
Alijah Wayne
#52
Keith Williams
#8
Keenan Wilson
#1
Donovan Woolen
Defensive Backs
#30
Jaylen Archibald
#22
Hudson Artz
#6
Jaylin Crumby
#14
Taylen Eady
#29
Darius Givance
#16
Marion Moore
#4
Najee Nelson
#12
DJ Voltz
Other
#37
Drew Klein
Quarterbacks & Specialists
#94
Will Duncan
#4
Kemper Hodges
#5
Evan Medders
#9
Liam Szarka
Receivers & Backs
#2
Owen Allen
#44
Rocco Conti
#18
Mason Hayes
#10
Adam Hrynciw
#80
Simon Kibbee
#28
Gage LaDue
#3
Matt Long
#29
Sylas Maiava-Alaimalo
Defensive Line & Linebackers
#59
Chaz Barnett
#33
Brody Bujnoch
#51
Vinnie Canosa
#8
Dallas Daley
#95
Noah Daniels
#6
Blake Fletcher
#30
Isaac Hubert
#48
Antonio Menard
#99
Jayden Oquendo
#45
Jaylin Reese
Defensive Backs
#24
Jordan Elie-Stuart
#2
Korey Johnson
#5
Roger Jones Jr.
#36
Max Mustell
#22
Ehimen Oyamendan
#26
Alexander Perez
Other
#90
Carter Cremascoli
North Dakota State
3rd in Mountain West
VS
Air Force
4th in Mountain West
Passing
63.3
Completion Percentage
47.6
162
Completions
39
3.10
Interception Percentage
4.90
8
Interceptions
4
51
Longest Pass
35
1,846
Net Passing Yards
557
184.6
Net Passing Yards Per Game
55.7
256
Passing Attempts
82
5.50
Passing Touchdown %
6.10
14
Passing Touchdowns
5
135.6
Passer Rating
115.0
11
Total Sacks
7
66
Sack Yards Lost
37
7.2
Yards Per Pass Attempt
6.8
1,846
Passing Yards
557
0
Passing Fumbles Lost
0
10
Team Games Played
10
334.9
Yards Per Game
399.7
27.4
Total Points Per Game
28.2
274
Total Points
282
34
Total Touchdowns
36
184.6
Passing Yards Per Game
55.7
162-256
Comp-Att
39-82
11-66
Sacks-Yards Lost
7-37
Rushing
388
Rushing Attempts
641
1,503
Rushing Yards
3,440
3.9
Yards Per Rush Attempt
5.4
42
Long Rushing
81
0
20+ Yard Rushing Plays
0
14
Rushing Touchdowns
30
150.3
Rushing Yards Per Game
344.0
0
Rushing Fumbles
0
0
Rushing Fumbles Lost
0
79
Rushing 1st downs
188
10
Team Games Played
10
3,349
Total Yards
3,997
655
Total Offensive Plays
730
27.4
Total Points Per Game
28.2
274
Total Points
282
34
Total Touchdowns
36
Receiving
162
Receptions
39
0
Receiving Targets
0
1,846
Receiving Yards
557
1,846
Receiving Yards
557
14
Receiving Touchdowns
5
51
Long Reception
35
0
20+ Yard Receiving Plays
0
184.6
Receiving Yards Per Game
55.7
0
Receiving Fumbles
0
0
Receiving Fumbles Lost
0
753
Receiving Yards After Catch
169
84
Receiving First Downs
28
10
Team Games Played
10
11.4
Yards Per Reception
14.3
27.4
Total Points Per Game
28.2
274
Total Points
282
34
Total Touchdowns
36
Miscellaneous
181
Total 1st downs
228
79
Rushing 1st downs
188
84
Passing 1st downs
28
18
1st downs by penalty
12
52
Third Down Conversions
74
134
Third Down Attempts
147
38.81
3rd down %
50.34
13
Fourth Down Conversions
22
21
First Downs Attempts
31
61.90
4th down %
70.97
67
Total Penalties
43
578
Total Penalty Yards
384
19192
Possession Time Seconds
21779
0.00
Red Zone Field Goal Percentage
0.00
0.00
Red Zone Scoring Percentage
0.00
0.00
Red Zone Efficiency Percentage
0.00
0.00
Red Zone Touchdown Percentage
0.00
15
Total Takeaways
6
9
Total Giveaways
8
6
Turnover Ratio
-2
0
Fumbles Lost
0
52-134
3rd down efficiency
74-147
13-21
4th down efficiency
22-31
67-578
Total-Yards
43-384
Defense
316
Solo Tackles
244
260
Assist Tackles
248
576
Total Tackles
492
25
Sacks
13
139
Sack Yards
85
83
Stuffs
56
25
Passes Defended
27
16.4
Average Interception Yards
19.3
49
Long Interception
85
0
Miscellaneous Touchdowns
0
1
Kicks Blocked
0
45
Tackles For Loss
26
10
Team Games Played
10
Defensive Interceptions
16
Interceptions
6
262
Interception Yards
116
2
Interception Touchdowns
1
16-262
INT: Total
6-116
General
6
Fumbles
4
6
Forced Fumbles
4
7
Fumbles Recovered
2
3
Fumbles Touchdowns
0
10
Games Played
10
6-0
Fumbles-Lost
4-0
Returning
18
Kick Returns
2
365
Kick Return Yards
39
20.3
Yards Per Kick Return
19.5
35
Long Kick Return
21
0
Kick Return Touchdowns
0
16
Punt Returns
1
166
Punt Return Yards
0
10.4
Yards Per Punt Return
0.0
40
Long Punt Return
0
0
Punt Return Touchdowns
0
0
Punt Return Fair Catches
0
0
Kick Return Fumbles Lost
0
0
Punt Return Fumbles Lost
0
10
Team Games Played
10
16-166
Punt: Total
1-0
Kicking
12
Field Goal Made
11
15
Field Goal Attempts
12
80.0
Field Goal Percentage
91.7
56
Long Field Goal Made
52
0
Field Goal Attempts 1-19
0
2
Field Goal Attempts 20-29
4
6
Field Goal Attempts 30-39
5
4
Field Goal Attempts 40-49
2
3
Field Goal Attempts 50+
1
30
Extra Points Made
31
32
Extra Point Attempts
32
93.8
Extra Point Percentage
96.9
0
Field Goals Made 1-19
0
2
Field Goals Made 20-29
3
6
Field Goals Made 30-39
5
3
Field Goals Made 40-49
2
1
Field Goals Made 50+
1
66
Total Kicking Points
64
10
Team Games Played
10
75
Touchback Percentage
96
0.0
Average Kickoff Return Yards
0.0
0
Kickoff Return Yards
0
0
Kickoff Returns
0
0-0
Kickoffs: Total
0-0
12-15
FG: Good-Attempts
11-12
Punting
42
Punts
23
1,902
Punt Yards
1,085
68
Long Punt
68
45.3
Gross Average Punt Yards
47.2
45.3
Net Average Punt Yards
47.2
0
Punts Blocked
0
15
Punts Inside 20
10
5
Touchbacks
3
7
Fair Catches
4
19
Punt Returns
7
0
Punt Return Yards
0
0.0
Average Punt Return Yards
0.0
10
Team Games Played
10
42-1,902
Punt: Total Yards
23-1,085
Scoring
14
Rushing Touchdowns
30
14
Receiving Touchdowns
5
0
Return Touchdowns
0
31
Total Touchdowns
35
12
Field Goals
11
30
Kick Extra Points
31
1
Total Two Point Conversions
1
274
Total Points
282
27.4
Total Points Per Game
28.2