

Northern Illinois vs Iowa Live Score (5 Sep, 2026)
Score by Quarter
| Team | Q1 | Q2 | Q3 | Q4 | Final |
|---|---|---|---|---|---|
 Northern Illinois |
0 | 0 | 0 | 0 | 0 |
 Iowa |
20 | 13 | 7 | 0 | 40 |
Scoring Plays
Q1
9:52
9:52
Tony Diaz 6 Yd pass from Hank Brown (Caden Buhr PAT failed)
Passing Touchdown
0 – 6
Q1
6:46
6:46
Kamari Moulton 50 Yd Run (Caden Buhr Kick)
Rushing Touchdown
0 – 13
Q1
4:10
4:10
Kamari Moulton 37 Yd Run (Caden Buhr Kick)
Rushing Touchdown
0 – 20
Q2
7:40
7:40
Xavier Williams 8 Yd pass from Jeremy Hecklinski (Caden Buhr Kick)
Passing Touchdown
0 – 27
Q2
3:34
3:34
Caden Buhr 45 Yd Field Goal
Field Goal Good
0 – 30
Q2
0:02
0:02
Caden Buhr 34 Yd Field Goal
Field Goal Good
0 – 33
Q3
2:20
2:20
Evan James 77 Yd Punt Return (Caden Buhr Kick)
Punt Return Touchdown
0 – 40
Game Leaders
Northern IllinoisIowa
 T. Dickens QB
Passing Yards
 H. Brown QB
 T. Johnson Jr. RB
Rushing Yards
 K. Moulton RB
 K. McInerney WR
Receiving Yards
T. Diaz WR J. Nelson LB
Tackles
 C. Buffington LB
—
Sacks
 J. Anderson DE
Player Box Score
Northern Illinois| Player | C/ATT | YDS | AVG | TD | INT |
|---|---|---|---|---|---|
| Taron Dickens#5 | 9/14 | 96 | 6.9 | 0 | 1 |
 Jalen Macon#14 | 4/10 | 17 | 1.7 | 0 | 0 |
Iowa| Player | C/ATT | YDS | AVG | TD | INT |
|---|---|---|---|---|---|
| Hank Brown#9 | 12/20 | 129 | 6.5 | 1 | 0 |
 Jeremy Hecklinski#10 | 7/16 | 76 | 4.8 | 1 | 1 |
 Jimmy Sullivan#3 | 2/4 | 13 | 3.3 | 0 | 0 |
Northern Illinois| Player | CAR | YDS | AVG | TD | LONG |
|---|---|---|---|---|---|
| Telly Johnson Jr.#45 | 8 | 16 | 2.0 | 0 | 5 |
| Jaidaun Cranford#20 | 2 | 9 | 4.5 | 0 | 6 |
 Elijah Porter#24 | 3 | 6 | 2.0 | 0 | 4 |
 Triston White#8 | 2 | 2 | 1.0 | 0 | 1 |
 Cam Thompson#7 | 1 | 0 | 0.0 | 0 | 0 |
| Team | 1 | -3 | -3.0 | 0 | 0 |
| Jalen Macon#14 | 8 | -4 | -0.5 | 0 | 6 |
| Taron Dickens#5 | 6 | -19 | -3.2 | 0 | 2 |
Iowa| Player | CAR | YDS | AVG | TD | LONG |
|---|---|---|---|---|---|
| Kamari Moulton#28 | 11 | 183 | 16.6 | 2 | 50 |
 Braeden Jackson#22 | 3 | 30 | 10.0 | 0 | 27 |
| Jeremy Hecklinski#10 | 1 | 16 | 16.0 | 0 | 16 |
| Jimmy Sullivan#3 | 1 | 15 | 15.0 | 0 | 15 |
| Hank Brown#9 | 2 | 12 | 6.0 | 0 | 10 |
| Tony Diaz#14 | 1 | 10 | 10.0 | 0 | 10 |
 Xavier Williams#26 | 6 | 8 | 1.3 | 0 | 6 |
 Nathan McNeil#5 | 7 | 8 | 1.1 | 0 | 5 |
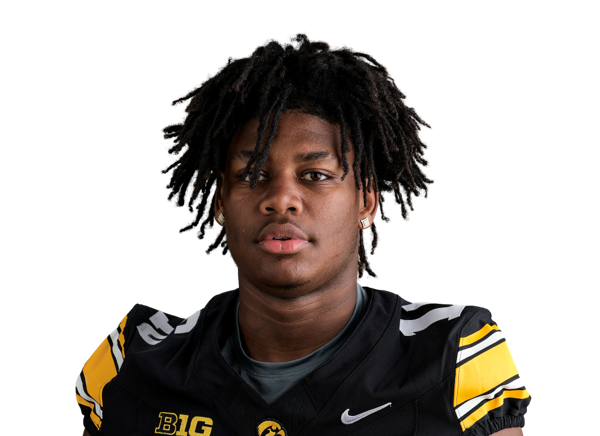 O'Lontae Dean#15 | 1 | 5 | 5.0 | 0 | 5 |
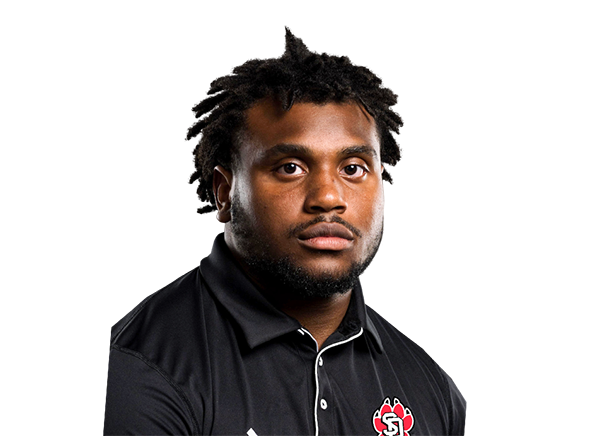 L.J. Phillips Jr.#21 | 4 | 5 | 1.3 | 0 | 3 |
 Brevin Doll#23 | 1 | -3 | -3.0 | 0 | 0 |
Northern Illinois| Player | REC | YDS | AVG | TD | LONG |
|---|---|---|---|---|---|
| Kelan McInerney#19 | 3 | 55 | 18.3 | 0 | 22 |
 La'Don Bryant | 4 | 42 | 10.5 | 0 | 20 |
 Glen Weber#84 | 2 | 10 | 5.0 | 0 | 6 |
 DeAree Rogers#1 | 1 | 3 | 3.0 | 0 | 3 |
| Telly Johnson Jr.#45 | 2 | 3 | 1.5 | 0 | 2 |
| Cam Thompson#7 | 1 | 0 | 0.0 | 0 | 0 |
Iowa| Player | REC | YDS | AVG | TD | LONG |
|---|---|---|---|---|---|
| Tony Diaz#14 | 7 | 84 | 12.0 | 1 | 24 |
 DJ Vonnahme#81 | 4 | 42 | 10.5 | 0 | 16 |
 Reece Vander Zee#2 | 2 | 32 | 16.0 | 0 | 16 |
 Jarriett Buie | 2 | 22 | 11.0 | 0 | 13 |
 Addison Ostrenga#87 | 3 | 20 | 6.7 | 0 | 11 |
| Xavier Williams#26 | 2 | 12 | 6.0 | 1 | 8 |
 Zach Ortwerth#48 | 1 | 6 | 6.0 | 0 | 6 |
Northern Illinois| Player | TOT | SOLO | SACKS | TFL | PD | QB HUR | TD |
|---|---|---|---|---|---|---|---|
| Jashawn Nelson#6 | 10 | 7 | 0 | 1 | 1 | 0 | 0 |
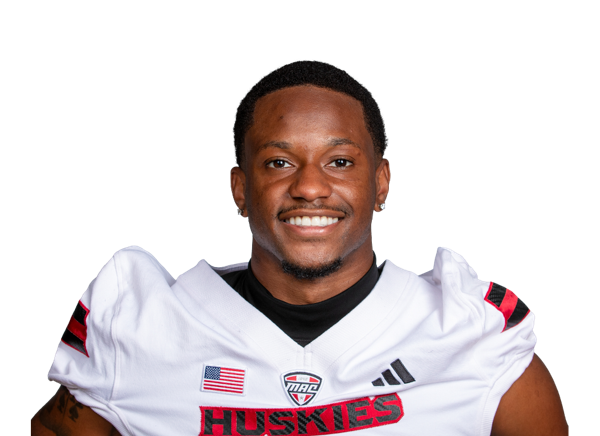 Malik Armstrong#14 | 6 | 5 | 0 | 0 | 0 | 0 | 0 |
| Jack Murray#44 | 6 | 3 | 0 | 0.5 | 1 | 0 | 0 |
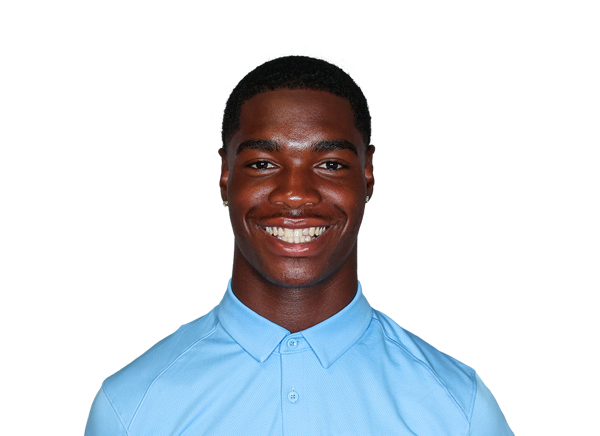 Kyon Conyers#16 | 6 | 1 | 0 | 0 | 1 | 0 | 0 |
 Romelo Walker#29 | 5 | 3 | 0 | 0 | 0 | 0 | 0 |
| Cooper Mau#8 | 4 | 0 | 0 | 0 | 0 | 0 | 0 |
 Jay'shon Thomas#18 | 3 | 2 | 0 | 0 | 0 | 0 | 0 |
| Matthew Scarlett#50 | 3 | 2 | 0 | 0 | 0 | 0 | 0 |
| Yassine Falke#5 | 3 | 2 | 0 | 1 | 0 | 0 | 0 |
 Avery Jones#2 | 3 | 1 | 0 | 0 | 0 | 0 | 0 |
| Brady Kerperin#25 | 3 | 1 | 0 | 0 | 0 | 0 | 0 |
 Liam Lindo#3 | 2 | 2 | 0 | 0 | 0 | 0 | 0 |
 Marshall Washington#20 | 2 | 2 | 0 | 0 | 0 | 0 | 0 |
 Fawzy Omotoso#93 | 2 | 1 | 0 | 0 | 0 | 0 | 0 |
| Jacob McGhee#92 | 2 | 1 | 0 | 1.5 | 0 | 0 | 0 |
 Amari Washington#11 | 2 | 0 | 0 | 0 | 0 | 0 | 0 |
 Trey Porter#27 | 1 | 1 | 0 | 0 | 0 | 0 | 0 |
| Kole Sneed#90 | 1 | 1 | 0 | 0 | 0 | 0 | 0 |
 James Bradley#19 | 1 | 1 | 0 | 0 | 0 | 0 | 0 |
 George Dimopoulos#9 | 1 | 1 | 0 | 0 | 0 | 0 | 0 |
 Dev'ion Reynolds#9 | 1 | 1 | 0 | 0 | 0 | 0 | 0 |
| Elijah Porter#24 | 1 | 1 | 0 | 0 | 0 | 0 | 0 |
 Andruw Ellis#30 | 1 | 1 | 0 | 0 | 0 | 0 | 0 |
 Broderick Windham#15 | 1 | 1 | 0 | 0 | 0 | 0 | 0 |
 Aaron Warren#12 | 1 | 1 | 0 | 0 | 1 | 0 | 0 |
 Micah Cook#87 | 1 | 0 | 0 | 0 | 0 | 0 | 0 |
Iowa| Player | TOT | SOLO | SACKS | TFL | PD | QB HUR | TD |
|---|---|---|---|---|---|---|---|
| Cam Buffington#33 | 6 | 4 | 0 | 1 | 0 | 0 | 0 |
| Julian Manson#4 | 4 | 2 | 1 | 1 | 0 | 0 | 0 |
 Zach Lutmer#6 | 4 | 2 | 0 | 0 | 1 | 0 | 0 |
 Landyn Van Kekerix#23 | 4 | 1 | 0.5 | 0.5 | 0 | 0 | 0 |
 Bryce Hawthorne#96 | 4 | 1 | 0.5 | 0.5 | 0 | 0 | 0 |
 Ty Hudkins#20 | 3 | 1 | 0 | 0 | 0 | 0 | 0 |
 Brice Stevenson#92 | 2 | 2 | 0 | 0 | 0 | 0 | 0 |
| Darion Jones#1 | 2 | 2 | 0 | 0 | 0 | 0 | 0 |
| Joseph Anderson#84 | 2 | 1 | 1.5 | 1.5 | 0 | 0 | 0 |
 Jayden Montgomery#36 | 2 | 1 | 0 | 0 | 0 | 0 | 0 |
 Devan Kennedy#91 | 2 | 1 | 0 | 0 | 0 | 0 | 0 |
 Nolan DeLong#31 | 2 | 1 | 0 | 0 | 0 | 0 | 0 |
 Burke Gautcher#10 | 2 | 1 | 0 | 0 | 0 | 0 | 0 |
 Jacob Wallace#11 | 2 | 1 | 0 | 0 | 0 | 0 | 0 |
 Kahmari Brown#43 | 2 | 1 | 0.5 | 0.5 | 0 | 0 | 0 |
 Anthony Hawkins#5 | 2 | 0 | 0 | 0 | 0 | 0 | 0 |
 Chima Chineke#40 | 1 | 1 | 1 | 1 | 0 | 0 | 0 |
 Deshaun Lee#8 | 1 | 1 | 0 | 0 | 1 | 0 | 0 |
 Alex Mota#14 | 1 | 1 | 0 | 0 | 0 | 0 | 0 |
 Derek Weisskopf#22 | 1 | 1 | 0 | 0 | 0 | 0 | 0 |
 Iose Epenesa#97 | 1 | 1 | 0 | 0 | 0 | 0 | 0 |
 Rashad Godfrey Jr.#7 | 1 | 1 | 0 | 0 | 0 | 0 | 0 |
 Carson Cooney#15 | 1 | 1 | 0 | 0 | 0 | 0 | 0 |
| Billy Weivoda#12 | 1 | 1 | 0 | 0 | 0 | 0 | 0 |
 Preston Ries#46 | 1 | 0 | 0.5 | 0.5 | 0 | 0 | 0 |
 Luke Gaffney#51 | 1 | 0 | 0 | 0 | 0 | 0 | 0 |
 Will Hubert#57 | 1 | 0 | 0 | 0 | 0 | 0 | 0 |
 Drew Campbell#13 | 1 | 0 | 0.5 | 0.5 | 0 | 0 | 0 |
 Emmanuel Olagbaju#88 | 1 | 0 | 0 | 0 | 0 | 0 | 0 |
| Marcello Vitti#21 | 1 | 0 | 0 | 0 | 0 | 0 | 0 |
 Xavier Styles#18 | 1 | 0 | 0 | 0 | 1 | 0 | 0 |
| Evan James#8 | 0 | 0 | 0 | 0 | 0 | 0 | 1 |
Northern Illinois| Player | FUM | LOST | REC |
|---|---|---|---|
| Taron Dickens#5 | 1 | 1 | 0 |
Iowa| Player | FUM | LOST | REC |
|---|---|---|---|
| Ty Hudkins#20 | 0 | 0 | 1 |
Iowa| Player | FG | PCT | LONG | XP | PTS |
|---|---|---|---|---|---|
 Caden Buhr#92 | 2/3 | 67.0 | 45 | 4/5 | 10 |
Northern Illinois| Player | NO | YDS | AVG | TB | In 20 | LONG |
|---|---|---|---|---|---|---|
 Jake Ference#36 | 11 | 460 | 41.8 | 0 | 0 | 49 |
Iowa| Player | NO | YDS | AVG | TB | In 20 | LONG |
|---|---|---|---|---|---|---|
| Boston Everitt#49 | 3 | 131 | 43.7 | 1 | 2 | 49 |
Northern Illinois| Player | NO | YDS | AVG | LONG | TD |
|---|---|---|---|---|---|
| Dev'ion Reynolds#9 | 2 | 22 | 11.0 | 16 | 0 |
| Cam Thompson#7 | 1 | 13 | 13.0 | 13 | 0 |
Iowa| Player | NO | YDS | AVG | LONG | TD |
|---|---|---|---|---|---|
| Evan James#8 | 3 | 108 | 36.0 | 77 | 1 |
| Reece Vander Zee#2 | 2 | 16 | 8.0 | 15 | 0 |
Northern Illinois| Player | INT | YDS | TD |
|---|---|---|---|
| Yassine Falke#5 | 1 | 0 | 0 |
Iowa| Player | INT | YDS | TD |
|---|---|---|---|
| Deshaun Lee#8 | 1 | 17 | 0 |
Drive Summary
IOWA
Touchdown
75
NIU
Punt
2
IOWA
Touchdown
66
NIU
Punt
6
IOWA
Touchdown
70
NIU
Punt
4
IOWA
Missed FG
37
NIU
Interception
4
IOWA
Punt
2
NIU
Punt
-10
IOWA
Touchdown
46
NIU
Punt
6
IOWA
Field Goal
31
NIU
Punt
5
IOWA
Field Goal
41
NIU
End Of Half
-3
NIU
Punt
-10
IOWA
Downs
15
NIU
Punt
-1
IOWA
Interception
54
NIU
Punt Touchdown
9
NIU
Fumble
39
IOWA
Punt
0
NIU
Punt
5
IOWA
Punt
5
NIU
Punt
9
IOWA
Downs
46
NIU
End Of Quarter
50
Injury Report
No current injury report is available for this matchup.
Head-to-Head
Historical meetings are not available for this matchup.
Game Information
StageWeek 1
Season2026
KickoffSat, Sep 5, 4:15 pm
VenueKinnick Stadium
LocationIowa City, IA
SurfaceArtificial Turf
BroadcastBTN
Attendance69,250
Division Standings
FBS — Mountain West Conference
| Team | W | L | T | Pct | PF | PA | Home | Away | Strk |
|---|---|---|---|---|---|---|---|---|---|
 North Dakota State | 7 | 2 | 0 | 0.778 | 253 | 107 | 5-0 | 2-2 | W1 |
 Air Force | 9 | 2 | 0 | 0.818 | 334 | 199 | 6-1 | 3-1 | W4 |
 San José State | 5 | 6 | 0 | 0.455 | 212 | 244 | 2-3 | 3-3 | L1 |
 Nevada | 4 | 6 | 0 | 0.400 | 215 | 219 | 2-3 | 2-3 | W1 |
 New Mexico | 9 | 2 | 0 | 0.818 | 352 | 136 | 4-1 | 5-1 | W1 |
 Hawai'i | 3 | 6 | 0 | 0.333 | 183 | 210 | 1-3 | 2-3 | W2 |
| Northern Illinois | 0 | 10 | 0 | 0.000 | 156 | 359 | 0-4 | 0-6 | L10 |
 UNLV | 6 | 4 | 0 | 0.600 | 256 | 248 | 3-2 | 3-2 | W1 |
 UTEP | 1 | 9 | 0 | 0.100 | 130 | 361 | 1-4 | 0-5 | L8 |
 Wyoming | 6 | 4 | 0 | 0.600 | 214 | 219 | 4-1 | 2-3 | L1 |
FBS — Big Ten Conference
| Team | W | L | T | Pct | PF | PA | Home | Away | Strk |
|---|---|---|---|---|---|---|---|---|---|
 USC | 7 | 3 | 0 | 0.700 | 305 | 245 | 5-1 | 2-2 | L1 |
 Illinois | 6 | 4 | 0 | 0.600 | 270 | 229 | 4-2 | 2-2 | L1 |
 Indiana | 9 | 1 | 0 | 0.900 | 319 | 125 | 6-1 | 3-0 | W3 |
| Iowa | 8 | 2 | 0 | 0.800 | 278 | 117 | 5-1 | 3-1 | W3 |
 Maryland | 4 | 6 | 0 | 0.400 | 273 | 303 | 2-4 | 2-2 | W2 |
 Michigan | 5 | 5 | 0 | 0.500 | 183 | 177 | 4-3 | 1-2 | L2 |
 Michigan State | 3 | 8 | 0 | 0.273 | 195 | 278 | 2-5 | 1-3 | L2 |
 Minnesota | 5 | 5 | 0 | 0.500 | 236 | 240 | 4-2 | 1-3 | L3 |
 Nebraska | 6 | 4 | 0 | 0.600 | 303 | 149 | 4-2 | 2-2 | W1 |
 Northwestern | 6 | 4 | 0 | 0.600 | 298 | 202 | 5-1 | 1-3 | L3 |
 Ohio State | 7 | 3 | 0 | 0.700 | 349 | 184 | 5-1 | 2-2 | W1 |
 Oregon | 8 | 3 | 0 | 0.727 | 383 | 213 | 5-1 | 3-2 | W4 |
 Penn State | 6 | 4 | 0 | 0.600 | 302 | 188 | 4-2 | 2-2 | W3 |
 Purdue | 3 | 7 | 0 | 0.300 | 272 | 319 | 2-4 | 1-3 | L4 |
 UCLA | 10 | 0 | 0 | 1.000 | 324 | 141 | 6-0 | 4-0 | W10 |
 Washington | 6 | 4 | 0 | 0.600 | 258 | 211 | 3-3 | 3-1 | W1 |
 Wisconsin | 6 | 4 | 0 | 0.600 | 241 | 171 | 5-0 | 1-4 | L1 |
 Rutgers | 2 | 8 | 0 | 0.200 | 232 | 323 | 1-5 | 1-3 | L4 |
Northern Illinois
10th in Mountain West
VS
Iowa
5th in Big Ten
Quarterbacks & Specialists
#5
Taron Dickens
#36
Jake Ference
#14
Jalen Macon
Receivers & Backs
La'Don Bryant
#20
Jaiduan Cranford
#9
George Dimopoulos
#45
Telly Johnson Jr.
#19
Kelan McInerney
#24
Elijah Porter
#1
DeAree Rogers
#7
Cam Thompson
#84
Glen Weber
#8
Triston White
Defensive Line & Linebackers
#19
James Bradley
#87
Micah Cook
#25
Brady Kerperin
#8
Cooper Mau
#92
Jacob McGhee
#44
Jack Murray
#6
Jashawn Nelson
#93
Fawzy Omotoso
#27
Trey Porter
#50
Matthew Scarlett
#90
Kole Sneed
#18
Jay'shon Thomas
#11
Amari Washington
#15
Broderick Windham
Defensive Backs
#14
Malik Armstrong
#16
Kyon Conyers
#30
Andruw Ellis
#5
Yassine Falke
#2
Avery Jones
#3
Liam Lindo
#9
Dev'ion Reynolds
#29
Romelo Walker
#12
Aaron Warren
#20
Marshall Washington
Quarterbacks & Specialists
#9
Hank Brown
#49
Boston Everitt
#10
Jeremy Hecklinski
#3
Jimmy Sullivan
Receivers & Backs
Jarriett Buie
#15
O'Lontae Dean
#14
Tony Diaz
#23
Brevin Doll
#22
Braeden Jackson
#8
Evan James
#5
Nathan McNeil
#28
Kamari Moulton
#48
Zach Ortwerth
#87
Addison Ostrenga
#21
L.J. Phillips Jr.
#2
Reece Vander Zee
#81
DJ Vonnahme
#26
Xavier Williams
Defensive Line & Linebackers
#84
Joseph Anderson
#43
Kahmari Brown
#33
Cam Buffington
#13
Drew Campbell
#40
Chima Chineke
#15
Carson Cooney
#31
Nolan DeLong
#97
Iose Epenesa
#51
Luke Gaffney
#10
Burke Gautcher
#96
Bryce Hawthorne
#57
Will Hubert
#91
Devan Kennedy
#4
Julian Manson
#36
Jayden Montgomery
#88
Emmanuel Olagbaju
#46
Preston Ries
#92
Brice Stevenson
#23
Landyn Van Kekerix
#22
Derek Weisskopf
#12
Billy Weivoda
Defensive Backs
#7
Rashad Godfrey Jr.
#5
Anthony Hawkins
#20
Ty Hudkins
#1
Darion Jones
#8
Deshaun Lee
#6
Zach Lutmer
#14
Alex Mota
#18
Xavier Styles
#21
Marcello Vitti
#11
Jacob Wallace
Other
#92
Caden Buhr
Northern Illinois
9th in Mountain West
VS
Iowa
3rd in Big Ten
Passing
63.2
Completion Percentage
64.8
213
Completions
188
2.70
Interception Percentage
2.10
9
Interceptions
6
61
Longest Pass
57
2,117
Net Passing Yards
1,989
211.7
Net Passing Yards Per Game
198.9
337
Passing Attempts
290
3.00
Passing Touchdown %
4.80
10
Passing Touchdowns
14
120.5
Passer Rating
134.5
33
Total Sacks
10
228
Sack Yards Lost
70
6.3
Yards Per Pass Attempt
6.9
2,117
Passing Yards
1,989
0
Passing Fumbles Lost
0
10
Team Games Played
10
326.7
Yards Per Game
379.9
15.6
Total Points Per Game
27.8
156
Total Points
278
20
Total Touchdowns
34
211.7
Passing Yards Per Game
198.9
213-337
Comp-Att
188-290
33-228
Sacks-Yards Lost
10-70
Rushing
303
Rushing Attempts
340
1,150
Rushing Yards
1,810
3.8
Yards Per Rush Attempt
5.3
33
Long Rushing
62
0
20+ Yard Rushing Plays
0
9
Rushing Touchdowns
17
115.0
Rushing Yards Per Game
181.0
0
Rushing Fumbles
0
0
Rushing Fumbles Lost
0
73
Rushing 1st downs
85
10
Team Games Played
10
3,267
Total Yards
3,799
673
Total Offensive Plays
640
15.6
Total Points Per Game
27.8
156
Total Points
278
20
Total Touchdowns
34
Receiving
213
Receptions
188
0
Receiving Targets
0
2,117
Receiving Yards
1,989
2,117
Receiving Yards
1,989
10
Receiving Touchdowns
14
61
Long Reception
57
0
20+ Yard Receiving Plays
0
211.7
Receiving Yards Per Game
198.9
0
Receiving Fumbles
0
0
Receiving Fumbles Lost
0
999
Receiving Yards After Catch
1117
95
Receiving First Downs
100
10
Team Games Played
10
9.9
Yards Per Reception
10.6
15.6
Total Points Per Game
27.8
156
Total Points
278
20
Total Touchdowns
34
Miscellaneous
183
Total 1st downs
201
73
Rushing 1st downs
85
95
Passing 1st downs
100
14
1st downs by penalty
15
43
Third Down Conversions
57
132
Third Down Attempts
130
32.58
3rd down %
43.85
10
Fourth Down Conversions
3
24
First Downs Attempts
7
41.67
4th down %
42.86
60
Total Penalties
53
593
Total Penalty Yards
435
17685
Possession Time Seconds
17997
0.00
Red Zone Field Goal Percentage
0.00
0.00
Red Zone Scoring Percentage
0.00
0.00
Red Zone Efficiency Percentage
0.00
0.00
Red Zone Touchdown Percentage
0.00
12
Total Takeaways
12
18
Total Giveaways
10
-6
Turnover Ratio
2
0
Fumbles Lost
0
43-132
3rd down efficiency
57-130
10-24
4th down efficiency
3-7
60-593
Total-Yards
53-435
Defense
336
Solo Tackles
343
340
Assist Tackles
290
676
Total Tackles
633
11
Sacks
30
68
Sack Yards
174
57
Stuffs
85
18
Passes Defended
36
14.1
Average Interception Yards
7.1
41
Long Interception
28
0
Miscellaneous Touchdowns
0
1
Kicks Blocked
0
26
Tackles For Loss
45
10
Team Games Played
10
Defensive Interceptions
9
Interceptions
7
127
Interception Yards
50
1
Interception Touchdowns
0
9-127
INT: Total
7-50
General
13
Fumbles
13
2
Forced Fumbles
5
3
Fumbles Recovered
6
0
Fumbles Touchdowns
0
10
Games Played
10
13-0
Fumbles-Lost
13-0
Returning
13
Kick Returns
7
192
Kick Return Yards
294
14.8
Yards Per Kick Return
42.0
24
Long Kick Return
99
0
Kick Return Touchdowns
2
11
Punt Returns
27
77
Punt Return Yards
312
7.0
Yards Per Punt Return
11.6
26
Long Punt Return
77
0
Punt Return Touchdowns
1
0
Punt Return Fair Catches
0
0
Kick Return Fumbles Lost
0
0
Punt Return Fumbles Lost
0
10
Team Games Played
10
11-77
Punt: Total
27-312
Kicking
6
Field Goal Made
14
11
Field Goal Attempts
19
54.5
Field Goal Percentage
73.7
46
Long Field Goal Made
54
0
Field Goal Attempts 1-19
0
2
Field Goal Attempts 20-29
3
2
Field Goal Attempts 30-39
4
5
Field Goal Attempts 40-49
5
2
Field Goal Attempts 50+
7
16
Extra Points Made
30
17
Extra Point Attempts
32
94.1
Extra Point Percentage
93.8
0
Field Goals Made 1-19
0
2
Field Goals Made 20-29
3
1
Field Goals Made 30-39
3
3
Field Goals Made 40-49
5
0
Field Goals Made 50+
3
34
Total Kicking Points
72
10
Team Games Played
10
59
Touchback Percentage
48
0.0
Average Kickoff Return Yards
0.0
0
Kickoff Return Yards
0
0
Kickoff Returns
0
0-0
Kickoffs: Total
0-0
6-11
FG: Good-Attempts
14-19
Punting
45
Punts
41
1,863
Punt Yards
1,719
55
Long Punt
60
41.4
Gross Average Punt Yards
41.9
41.4
Net Average Punt Yards
41.9
0
Punts Blocked
0
14
Punts Inside 20
24
3
Touchbacks
4
15
Fair Catches
15
12
Punt Returns
8
0
Punt Return Yards
0
0.0
Average Punt Return Yards
0.0
10
Team Games Played
10
45-1,863
Punt: Total Yards
41-1,719
Scoring
9
Rushing Touchdowns
17
10
Receiving Touchdowns
14
0
Return Touchdowns
3
19
Total Touchdowns
34
6
Field Goals
14
16
Kick Extra Points
30
1
Total Two Point Conversions
1
156
Total Points
278
15.6
Total Points Per Game
27.8