

Northwestern vs Indiana Live Score (26 Sep, 2026)
Score by Quarter
| Team | Q1 | Q2 | Q3 | Q4 | Final |
|---|---|---|---|---|---|
 Northwestern |
0 | 0 | 7 | 16 | 23 |
 Indiana |
2 | 10 | 3 | 14 | 29 |
Scoring Plays
Q1
7:20
7:20
Team Safety
Safety
0 – 2
Q2
13:06
13:06
Nico Radicic 43 Yd Field Goal
Field Goal Good
0 – 5
Q2
5:04
5:04
Nick Marsh 8 Yd pass from Josh Hoover (Nico Radicic Kick)
Passing Touchdown
0 – 12
Q3
6:34
6:34
Griffin Wilde 4 Yd pass from Aidan Chiles (Jackson Kleather Kick)
Passing Touchdown
7 – 12
Q3
2:06
2:06
Nico Radicic 22 Yd Field Goal
Field Goal Good
7 – 15
Q4
14:54
14:54
Griffin Wilde 8 Yd pass from Aidan Chiles (Two-Point Run Conversion Failed)
Passing Touchdown
13 – 15
Q4
9:39
9:39
Lee Beebe Jr. 4 Yd Run (Nico Radicic Kick)
Rushing Touchdown
13 – 22
Q4
5:10
5:10
Aidan Chiles 7 Yd Run (Jackson Kleather Kick)
Rushing Touchdown
20 – 22
Q4
1:56
1:56
Josh Hoover 1 Yd Run (Nico Radicic Kick)
Rushing Touchdown
20 – 29
Q4
0:58
0:58
Jackson Kleather 42 Yd Field Goal
Field Goal Good
23 – 29
Game Leaders
NorthwesternIndiana
 A. Chiles QB
Passing Yards
 J. Hoover QB
 G. Sawchuk RB
Rushing Yards
 L. Beebe Jr. RB
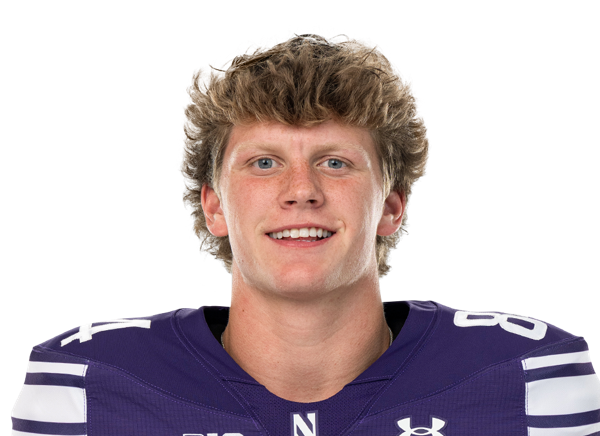 L. Dehnicke TE
Receiving Yards
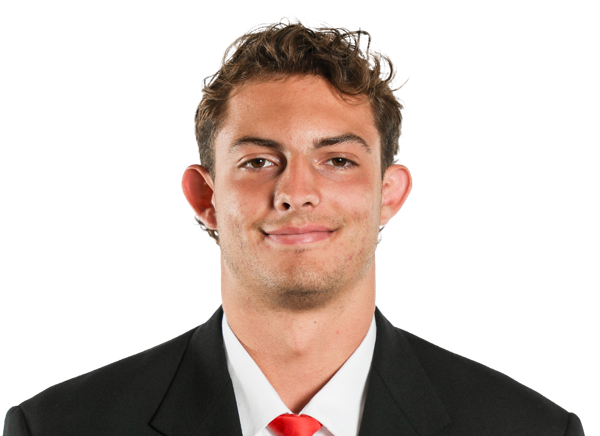 C. Becker WR
 J. Johnson DL
Sacks
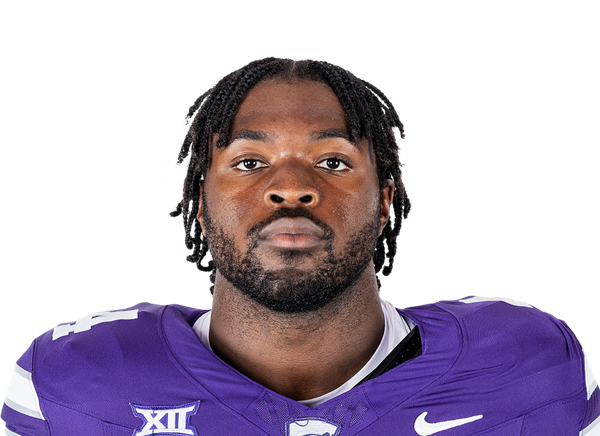 T. Osunsanmi DL
 R. Fitzgerald DB
Tackles
 P. Zachman DB
Player Box Score
Northwestern| Player | C/ATT | YDS | AVG | TD | INT | QBR |
|---|---|---|---|---|---|---|
| Aidan Chiles | 22/29 | 293 | 10.1 | 2 | 0 | 89.1 |
 Team | 0/1 | 0 | 0.0 | 0 | 0 | -- |
Indiana| Player | C/ATT | YDS | AVG | TD | INT | QBR |
|---|---|---|---|---|---|---|
| Josh Hoover#10 | 19/29 | 201 | 6.9 | 1 | 0 | 84.4 |
Northwestern| Player | CAR | YDS | AVG | TD | LONG |
|---|---|---|---|---|---|
| Gavin Sawchuk#27 | 5 | 26 | 5.2 | 0 | 11 |
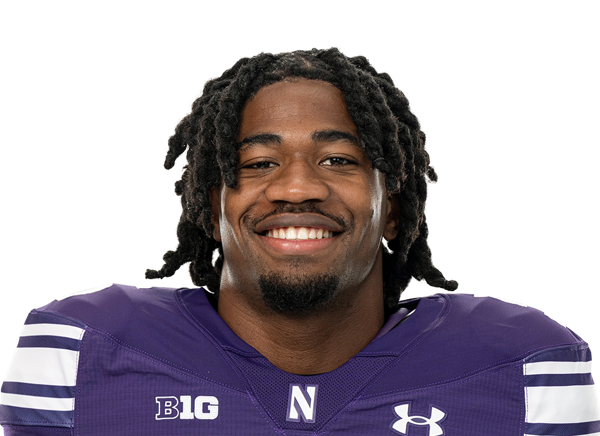 Caleb Komolafe#5 | 6 | 7 | 1.2 | 0 | 2 |
| Aidan Chiles | 13 | 0 | 0.0 | 1 | 15 |
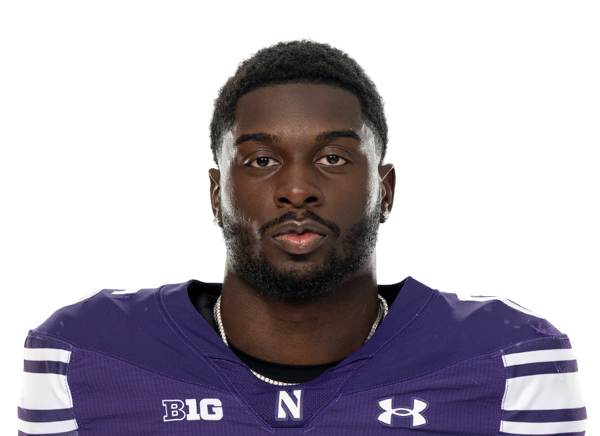 Joseph Himon II#6 | 2 | 0 | 0.0 | 0 | 3 |
| Team | 1 | -1 | -1.0 | 0 | 0 |
Indiana| Player | CAR | YDS | AVG | TD | LONG |
|---|---|---|---|---|---|
| Lee Beebe Jr.#29 | 24 | 203 | 8.5 | 1 | 70 |
 Turbo Richard#1 | 9 | 68 | 7.6 | 0 | 33 |
| Josh Hoover#10 | 6 | 1 | 0.2 | 1 | 16 |
| Team | 1 | -1 | -1.0 | 0 | 0 |
Northwestern| Player | REC | YDS | AVG | TD | LONG |
|---|---|---|---|---|---|
| Luke Dehnicke#84 | 7 | 140 | 20.0 | 0 | 41 |
 Griffin Wilde#17 | 6 | 56 | 9.3 | 2 | 18 |
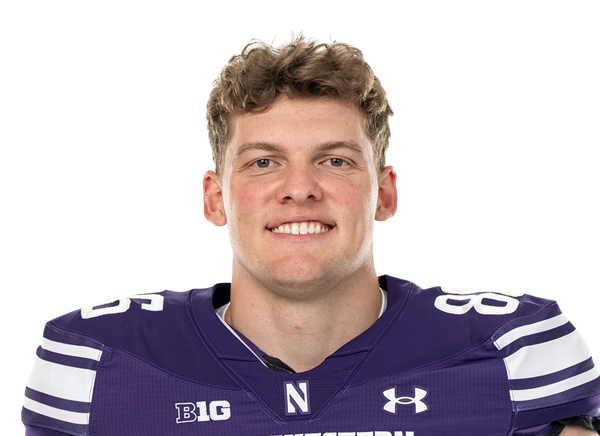 Alex Honig#86 | 3 | 54 | 18.0 | 0 | 21 |
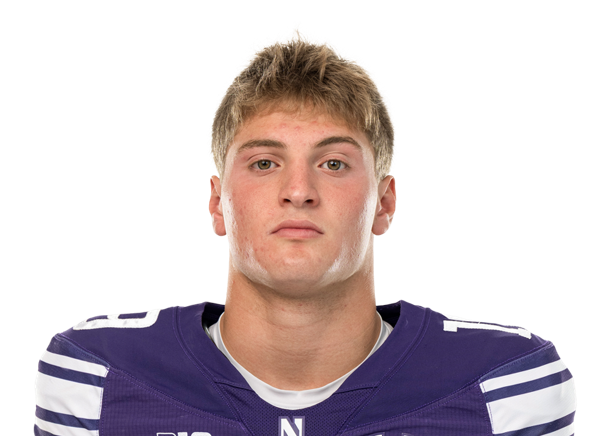 Drew Wagner#19 | 3 | 19 | 6.3 | 0 | 8 |
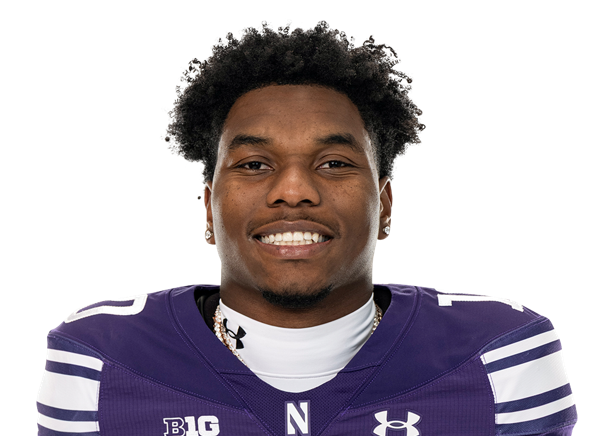 Ricky Ahumaraeze#10 | 1 | 17 | 17.0 | 0 | 17 |
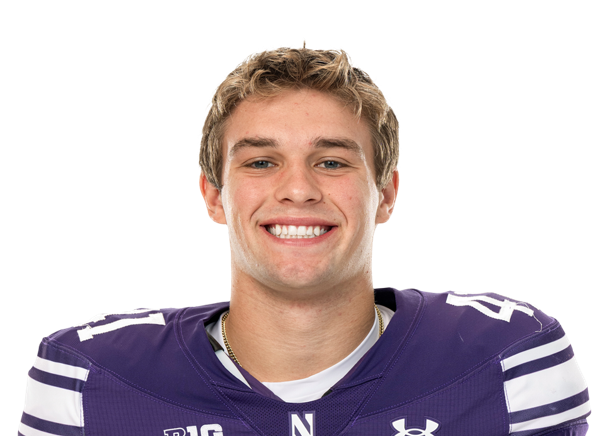 Robby Preckel#41 | 1 | 4 | 4.0 | 0 | 4 |
| Caleb Komolafe#5 | 1 | 3 | 3.0 | 0 | 3 |
Indiana| Player | REC | YDS | AVG | TD | LONG |
|---|---|---|---|---|---|
| Charlie Becker#80 | 7 | 98 | 14.0 | 0 | 23 |
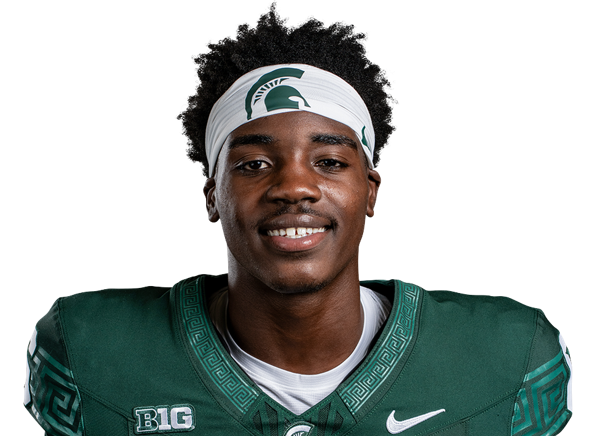 Nick Marsh#11 | 5 | 52 | 10.4 | 1 | 17 |
 Davion Chandler#4 | 2 | 20 | 10.0 | 0 | 14 |
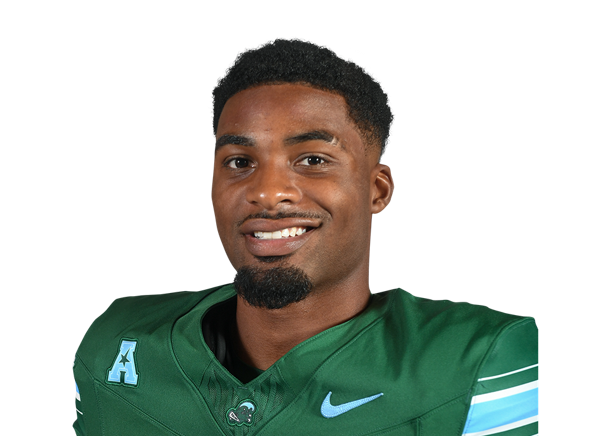 Shazz Preston#7 | 2 | 18 | 9.0 | 0 | 9 |
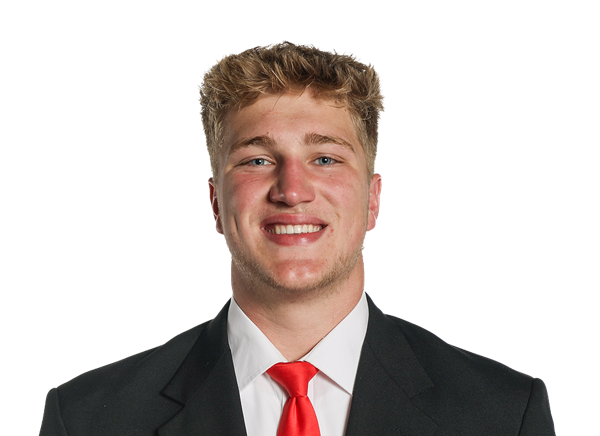 Andrew Barker#85 | 1 | 6 | 6.0 | 0 | 6 |
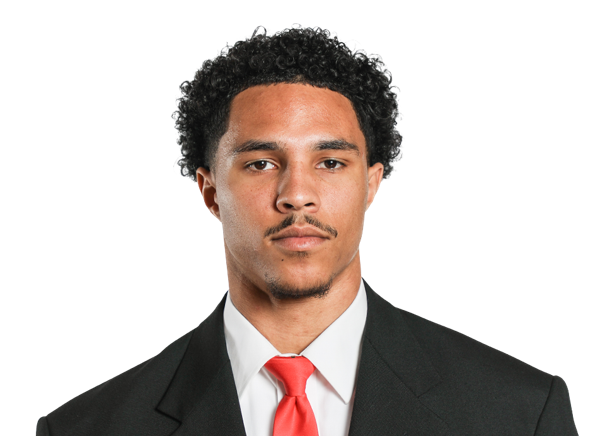 Tyler Morris#8 | 1 | 5 | 5.0 | 0 | 5 |
| Lee Beebe Jr.#29 | 1 | 2 | 2.0 | 0 | 2 |
Northwestern| Player | TOT | SOLO | SACKS | TFL | PD | QB HUR | TD |
|---|---|---|---|---|---|---|---|
| Robert Fitzgerald#6 | 13 | 6 | 0 | 0 | 0 | 0 | 0 |
 Kobie McKinzie#2 | 9 | 3 | 0 | 0 | 1 | 0 | 0 |
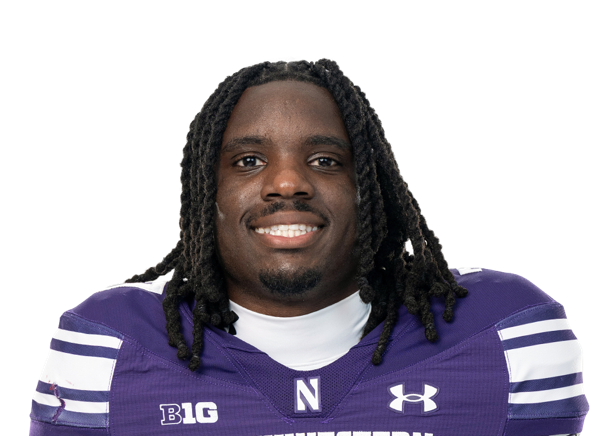 Ore Adeyi#7 | 8 | 6 | 0 | 0 | 1 | 0 | 0 |
 Damon Walters#21 | 8 | 4 | 0 | 0 | 0 | 0 | 0 |
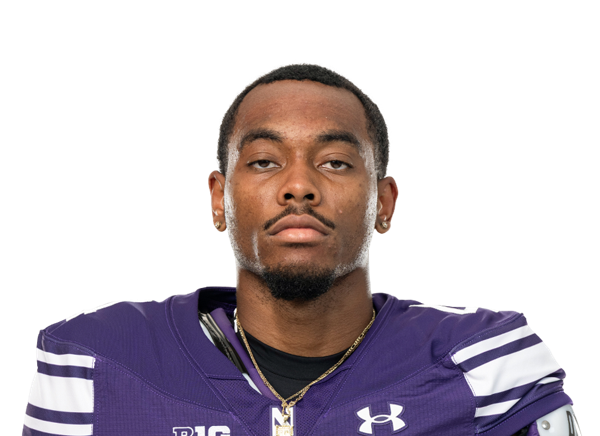 Montae Pate#4 | 7 | 6 | 0 | 0 | 0 | 0 | 0 |
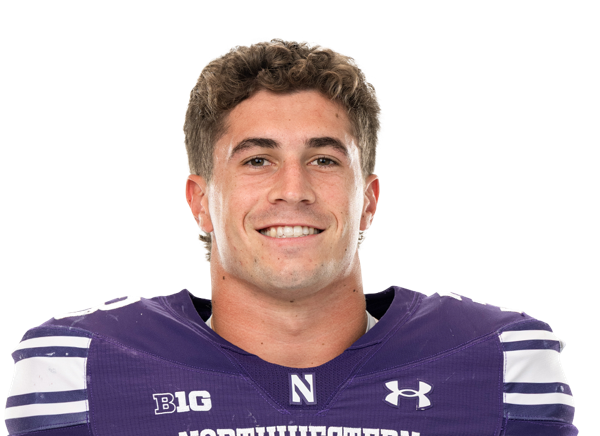 Braydon Brus#33 | 5 | 4 | 1 | 2 | 0 | 0 | 0 |
 Michael Kilbane#47 | 5 | 2 | 0 | 0 | 0 | 1 | 0 |
| Jamaal Johnson#24 | 3 | 2 | 1 | 1 | 1 | 0 | 0 |
 Tyler Gant#54 | 3 | 1 | 0 | 0 | 0 | 0 | 0 |
 Brenden Deasfernandes#3 | 2 | 1 | 0 | 0 | 0 | 1 | 0 |
 Matthew Smith#32 | 2 | 1 | 0 | 0 | 0 | 0 | 0 |
 Mason Mayne#95 | 2 | 0 | 0 | 0.5 | 0 | 0 | 0 |
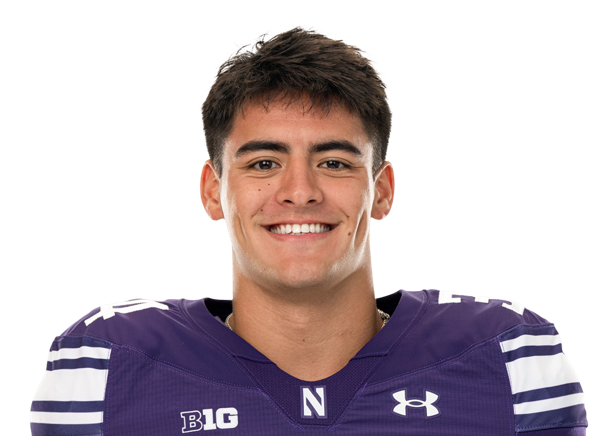 Payton Roth#34 | 1 | 1 | 0 | 0 | 0 | 0 | 0 |
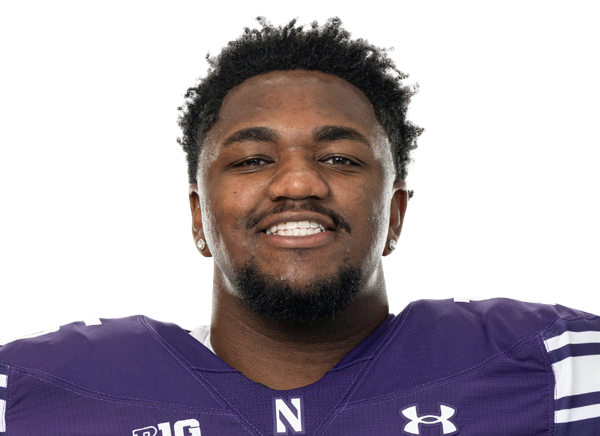 Brendan Flakes#15 | 1 | 0 | 0 | 0 | 0 | 0 | 0 |
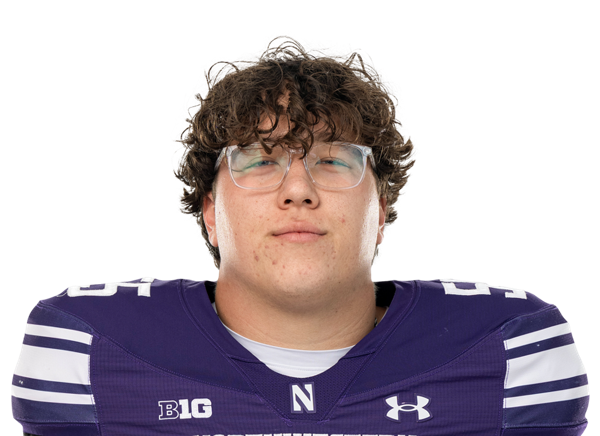 Dylan Roberts#55 | 1 | 0 | 0 | 0 | 0 | 0 | 0 |
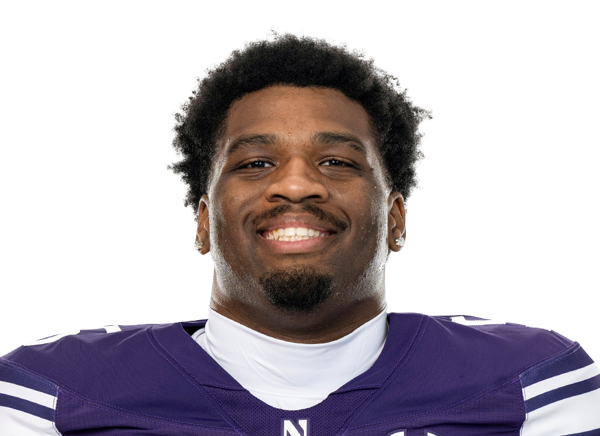 Dominic Kirks#5 | 1 | 0 | 0 | 0 | 0 | 0 | 0 |
 Jon Jon Stevens Jr.#29 | 1 | 0 | 0 | 0 | 0 | 0 | 0 |
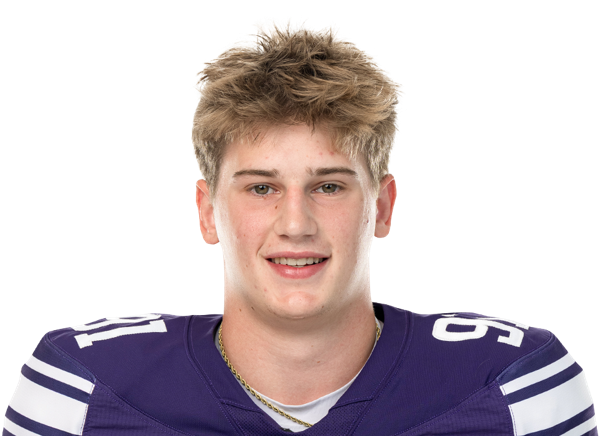 Caden O'Rourke#91 | 1 | 0 | 0 | 0.5 | 0 | 0 | 0 |
Indiana| Player | TOT | SOLO | SACKS | TFL | PD | QB HUR | TD |
|---|---|---|---|---|---|---|---|
| Preston Zachman#6 | 9 | 7 | 0 | 0 | 0 | 0 | 0 |
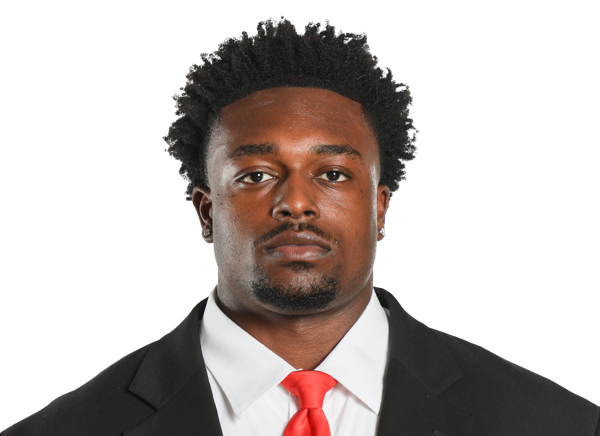 Rolijah Hardy#5 | 8 | 6 | 0 | 0 | 0 | 0 | 0 |
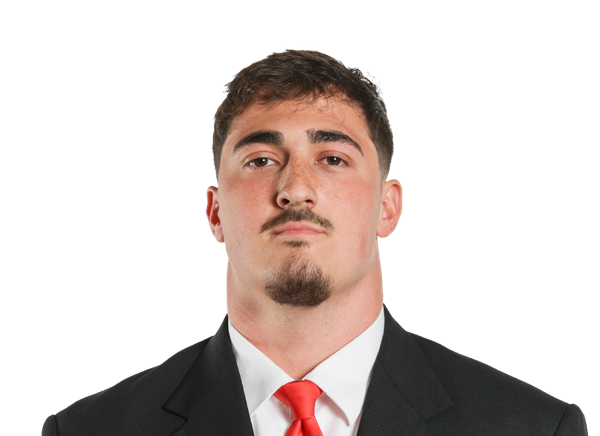 Isaiah Jones#46 | 7 | 4 | 0 | 0 | 0 | 0 | 0 |
 Stephen Daley#9 | 7 | 3 | 1 | 1 | 0 | 2 | 0 |
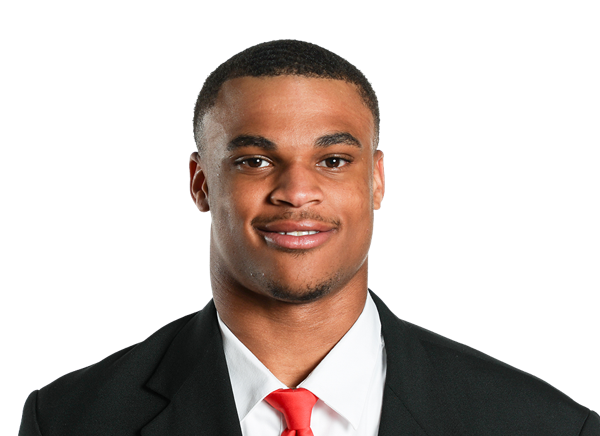 Amare Ferrell#1 | 6 | 4 | 0 | 0 | 0 | 0 | 0 |
| Tobi Osunsanmi#12 | 5 | 3 | 1 | 2 | 0 | 0 | 0 |
 Byron Baldwin Jr.#2 | 3 | 2 | 1 | 1 | 0 | 0 | 0 |
 Jeff Utzinger#34 | 2 | 2 | 0 | 0 | 0 | 0 | 0 |
 Daniel Ndukwe#17 | 2 | 1 | 0 | 1.5 | 0 | 1 | 0 |
 Tyrique Tucker#95 | 2 | 0 | 0 | 0.5 | 0 | 1 | 0 |
 Quan Sanks#13 | 2 | 0 | 0 | 0 | 0 | 0 | 0 |
 Mario Landino#97 | 1 | 1 | 1 | 1 | 0 | 1 | 0 |
 Josh Burnham#8 | 1 | 0 | 0 | 0 | 0 | 0 | 0 |
 Kellan Wyatt#18 | 1 | 0 | 0 | 0 | 0 | 0 | 0 |
 Jamari Sharpe#22 | 1 | 0 | 0 | 0 | 0 | 0 | 0 |
 Joe Hjelle#90 | 1 | 0 | 0 | 0 | 0 | 0 | 0 |
| Blake Smythe#91 | 1 | 0 | 0 | 0 | 0 | 0 | 0 |
Northwestern| Player | FUM | LOST | REC |
|---|---|---|---|
| Aidan Chiles | 2 | 0 | 0 |
| Team | 1 | 0 | 0 |
Indiana| Player | FUM | LOST | REC |
|---|---|---|---|
| Lee Beebe Jr.#29 | 1 | 0 | 0 |
Northwestern| Player | FG | PCT | LONG | XP | PTS |
|---|---|---|---|---|---|
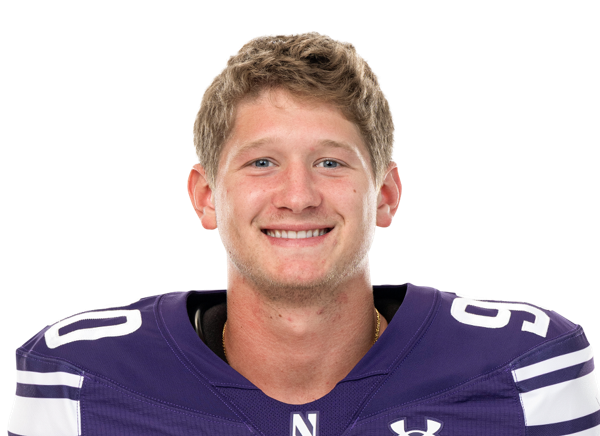 Jackson Kleather#90 | 1/1 | 100.0 | 42 | 2/2 | 5 |
Indiana| Player | FG | PCT | LONG | XP | PTS |
|---|---|---|---|---|---|
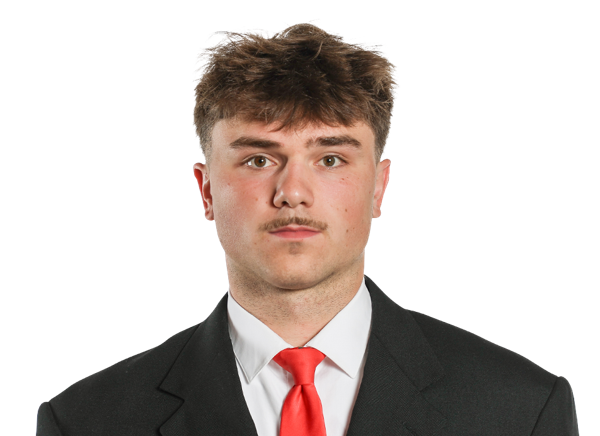 Nico Radicic#15 | 2/2 | 100.0 | 43 | 3/3 | 9 |
Northwestern| Player | NO | YDS | AVG | TB | In 20 | LONG |
|---|---|---|---|---|---|---|
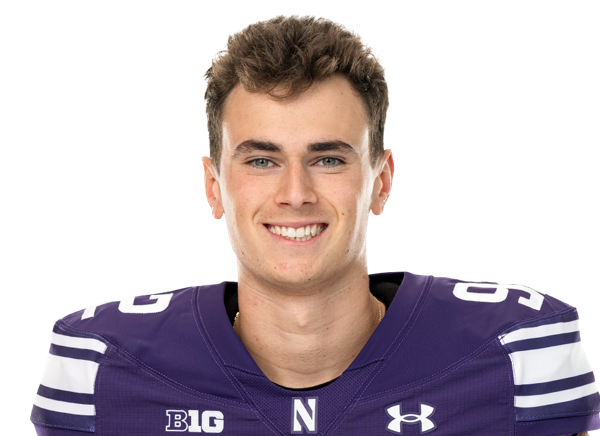 Nikola Dugandzic#92 | 4 | 180 | 45.0 | 0 | 2 | 72 |
Indiana| Player | NO | YDS | AVG | TB | In 20 | LONG |
|---|---|---|---|---|---|---|
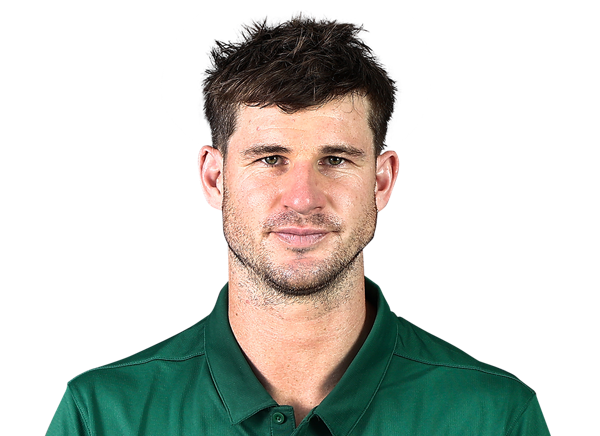 Billy Gowers#19 | 2 | 79 | 39.5 | 0 | 1 | 45 |
Northwestern| Player | NO | YDS | AVG | LONG | TD |
|---|---|---|---|---|---|
| Joseph Himon II#6 | 2 | 37 | 18.5 | 21 | 0 |
Indiana| Player | NO | YDS | AVG | LONG | TD |
|---|---|---|---|---|---|
| Turbo Richard#1 | 2 | 35 | 17.5 | 22 | 0 |
| Lee Beebe Jr.#29 | 1 | 0 | 0.0 | 0 | 0 |
Drive Summary
IU
Downs
67
NU
Safety
-1
IU
Punt
28
NU
Punt
-4
IU
Field Goal
51
NU
Punt
34
IU
Touchdown
90
NU
Punt
31
IU
End of Half
2
NU
Punt
-1
IU
Punt
-7
NU
Touchdown
75
IU
Field Goal
90
NU
Touchdown
75
IU
Touchdown
75
NU
Touchdown
78
IU
Touchdown
75
NU
Field Goal
51
IU
End of Half
12
Injury Report
No current injury report is available for this matchup.
Head-to-Head
Historical meetings are not available for this matchup.
Game Information
StageWeek 4
Season2026
KickoffFri, Sep 25, 8:00 pm
VenueMemorial Stadium (Bloomington, IN)
LocationBloomington, IN
SurfaceArtificial Turf
BroadcastFOX
Attendance54,593
Division Standings
FBS — Big Ten Conference
| Team | W | L | T | Pct | PF | PA | Home | Away | Strk |
|---|---|---|---|---|---|---|---|---|---|
 UCLA | 10 | 0 | 0 | 1.000 | 324 | 141 | 6-0 | 4-0 | W10 |
| Indiana | 9 | 1 | 0 | 0.900 | 319 | 125 | 6-1 | 3-0 | W3 |
 Iowa | 8 | 2 | 0 | 0.800 | 278 | 117 | 5-1 | 3-1 | W3 |
 Nebraska | 6 | 4 | 0 | 0.600 | 303 | 149 | 4-2 | 2-2 | W1 |
 Minnesota | 5 | 5 | 0 | 0.500 | 236 | 240 | 4-2 | 1-3 | L3 |
 Ohio State | 7 | 3 | 0 | 0.700 | 349 | 184 | 5-1 | 2-2 | W1 |
 Oregon | 7 | 3 | 0 | 0.700 | 338 | 206 | 5-1 | 2-2 | W3 |
 Wisconsin | 6 | 4 | 0 | 0.600 | 241 | 171 | 5-0 | 1-4 | L1 |
 USC | 7 | 3 | 0 | 0.700 | 305 | 245 | 5-1 | 2-2 | L1 |
 Michigan | 5 | 5 | 0 | 0.500 | 183 | 177 | 4-3 | 1-2 | L2 |
 Penn State | 6 | 4 | 0 | 0.600 | 302 | 188 | 4-2 | 2-2 | W3 |
 Washington | 6 | 4 | 0 | 0.600 | 258 | 211 | 3-3 | 3-1 | W1 |
| Northwestern | 6 | 4 | 0 | 0.600 | 298 | 202 | 5-1 | 1-3 | L3 |
 Illinois | 6 | 4 | 0 | 0.600 | 270 | 229 | 4-2 | 2-2 | L1 |
 Maryland | 4 | 6 | 0 | 0.400 | 273 | 303 | 2-4 | 2-2 | W2 |
 Michigan State | 3 | 7 | 0 | 0.300 | 188 | 233 | 2-4 | 1-3 | L1 |
 Purdue | 3 | 7 | 0 | 0.300 | 272 | 319 | 2-4 | 1-3 | L4 |
 Rutgers | 2 | 8 | 0 | 0.200 | 232 | 323 | 1-5 | 1-3 | L4 |
Northwestern
11th in Big Ten
VS
Indiana
2nd in Big Ten
Quarterbacks & Specialists
Aidan Chiles
#92
Nikola Dugandzic
Receivers & Backs
#10
Ricky Ahumaraeze
#84
Luke Dehnicke
#6
Joseph Himon II
#86
Alex Honig
#5
Caleb Komolafe
#41
Robby Preckel
#27
Gavin Sawchuk
#19
Drew Wagner
#17
Griffin Wilde
Defensive Line & Linebackers
#33
Braydon Brus
#15
Brendan Flakes
#54
Tyler Gant
#24
Jamaal Johnson
#47
Michael Kilbane
#5
Dominic Kirks
#95
Mason Mayne
#2
Kobie McKinzie
#91
Caden O'Rourke
#55
Dylan Roberts
#34
Payton Roth
#32
Matthew Smith
Defensive Backs
#7
Ore Adeyi
#3
Brenden Deasfernandes
#6
Robert Fitzgerald
#4
Montae Pate
#29
Jon Jon Stevens Jr.
#21
Damon Walters
Other
#90
Jackson Kleather
Quarterbacks & Specialists
#19
Billy Gowers
#10
Josh Hoover
Receivers & Backs
#85
Andrew Barker
#80
Charlie Becker
#29
Lee Beebe Jr.
#4
Davion Chandler
#11
Nick Marsh
#8
Tyler Morris
#7
Shazz Preston
#1
Turbo Richard
Defensive Line & Linebackers
#8
Josh Burnham
#9
Stephen Daley
#5
Rolijah Hardy
#90
Joe Hjelle
#46
Isaiah Jones
#97
Mario Landino
#17
Daniel Ndukwe
#12
Tobi Osunsanmi
#91
Blake Smythe
#95
Tyrique Tucker
#34
Jeff Utzinger
#18
Kellan Wyatt
Defensive Backs
#2
Byron Baldwin Jr.
#1
Amare Ferrell
#13
Quan Sanks
#22
Jamari Sharpe
#6
Preston Zachman
Other
#15
Nico Radicic
Northwestern
9th in Big Ten
VS
Indiana
2nd in Big Ten
Passing
67.3
Completion Percentage
60.1
181
Completions
155
0.40
Interception Percentage
1.20
1
Interceptions
3
71
Longest Pass
79
2,304
Net Passing Yards
2,405
230.4
Net Passing Yards Per Game
240.5
269
Passing Attempts
258
5.60
Passing Touchdown %
9.30
15
Passing Touchdowns
24
157.1
Passer Rating
166.5
29
Total Sacks
15
178
Sack Yards Lost
88
8.6
Yards Per Pass Attempt
9.3
2,304
Passing Yards
2,405
0
Passing Fumbles Lost
0
10
Team Games Played
10
406.9
Yards Per Game
422.7
29.8
Total Points Per Game
31.9
298
Total Points
319
35
Total Touchdowns
39
230.4
Passing Yards Per Game
240.5
181-269
Comp-Att
155-258
29-178
Sacks-Yards Lost
15-88
Rushing
380
Rushing Attempts
350
1,765
Rushing Yards
1,822
4.6
Yards Per Rush Attempt
5.2
80
Long Rushing
70
0
20+ Yard Rushing Plays
0
19
Rushing Touchdowns
14
176.5
Rushing Yards Per Game
182.2
0
Rushing Fumbles
0
0
Rushing Fumbles Lost
0
96
Rushing 1st downs
80
10
Team Games Played
10
4,069
Total Yards
4,227
678
Total Offensive Plays
623
29.8
Total Points Per Game
31.9
298
Total Points
319
35
Total Touchdowns
39
Receiving
181
Receptions
155
0
Receiving Targets
0
2,304
Receiving Yards
2,405
2,304
Receiving Yards
2,405
15
Receiving Touchdowns
24
71
Long Reception
79
0
20+ Yard Receiving Plays
0
230.4
Receiving Yards Per Game
240.5
0
Receiving Fumbles
0
0
Receiving Fumbles Lost
0
956
Receiving Yards After Catch
848
105
Receiving First Downs
102
10
Team Games Played
10
12.7
Yards Per Reception
15.5
29.8
Total Points Per Game
31.9
298
Total Points
319
35
Total Touchdowns
39
Miscellaneous
217
Total 1st downs
196
96
Rushing 1st downs
80
105
Passing 1st downs
102
16
1st downs by penalty
14
53
Third Down Conversions
50
128
Third Down Attempts
120
41.41
3rd down %
41.67
7
Fourth Down Conversions
6
13
First Downs Attempts
12
53.85
4th down %
50.00
64
Total Penalties
46
474
Total Penalty Yards
373
18636
Possession Time Seconds
17492
0.00
Red Zone Field Goal Percentage
0.00
0.00
Red Zone Scoring Percentage
0.00
0.00
Red Zone Efficiency Percentage
0.00
0.00
Red Zone Touchdown Percentage
0.00
11
Total Takeaways
9
4
Total Giveaways
7
7
Turnover Ratio
2
0
Fumbles Lost
0
53-128
3rd down efficiency
50-120
7-13
4th down efficiency
6-12
64-474
Total-Yards
46-373
Defense
348
Solo Tackles
332
312
Assist Tackles
308
660
Total Tackles
640
15
Sacks
32
134
Sack Yards
221
65
Stuffs
97
42
Passes Defended
30
6.8
Average Interception Yards
15.6
22
Long Interception
34
0
Miscellaneous Touchdowns
0
1
Kicks Blocked
1
34
Tackles For Loss
64
10
Team Games Played
10
Defensive Interceptions
10
Interceptions
10
68
Interception Yards
156
1
Interception Touchdowns
1
10-68
INT: Total
10-156
General
12
Fumbles
13
8
Forced Fumbles
8
10
Fumbles Recovered
6
0
Fumbles Touchdowns
0
10
Games Played
10
12-0
Fumbles-Lost
13-0
Returning
14
Kick Returns
14
288
Kick Return Yards
270
20.6
Yards Per Kick Return
19.3
37
Long Kick Return
67
0
Kick Return Touchdowns
0
12
Punt Returns
7
90
Punt Return Yards
80
7.5
Yards Per Punt Return
11.4
30
Long Punt Return
36
0
Punt Return Touchdowns
0
0
Punt Return Fair Catches
0
0
Kick Return Fumbles Lost
0
0
Punt Return Fumbles Lost
0
10
Team Games Played
10
12-90
Punt: Total
7-80
Kicking
18
Field Goal Made
15
22
Field Goal Attempts
23
81.8
Field Goal Percentage
65.2
52
Long Field Goal Made
60
0
Field Goal Attempts 1-19
0
1
Field Goal Attempts 20-29
6
9
Field Goal Attempts 30-39
6
9
Field Goal Attempts 40-49
6
3
Field Goal Attempts 50+
5
32
Extra Points Made
36
32
Extra Point Attempts
38
100.0
Extra Point Percentage
94.7
0
Field Goals Made 1-19
0
1
Field Goals Made 20-29
5
9
Field Goals Made 30-39
4
6
Field Goals Made 40-49
5
2
Field Goals Made 50+
1
86
Total Kicking Points
81
10
Team Games Played
10
33
Touchback Percentage
84
0.0
Average Kickoff Return Yards
0.0
0
Kickoff Return Yards
0
0
Kickoff Returns
0
0-0
Kickoffs: Total
0-0
18-22
FG: Good-Attempts
15-23
Punting
35
Punts
35
1,341
Punt Yards
1,398
72
Long Punt
59
38.3
Gross Average Punt Yards
39.9
38.3
Net Average Punt Yards
39.9
0
Punts Blocked
0
13
Punts Inside 20
14
2
Touchbacks
1
15
Fair Catches
12
8
Punt Returns
10
0
Punt Return Yards
0
0.0
Average Punt Return Yards
0.0
10
Team Games Played
10
35-1,341
Punt: Total Yards
35-1,398
Scoring
19
Rushing Touchdowns
14
15
Receiving Touchdowns
24
0
Return Touchdowns
0
34
Total Touchdowns
38
18
Field Goals
15
32
Kick Extra Points
36
1
Total Two Point Conversions
1
298
Total Points
319
29.8
Total Points Per Game
31.9