

Ohio State vs Texas Live Score (12 Sep, 2026)
Score by Quarter
| Team | Q1 | Q2 | Q3 | Q4 | Final |
|---|---|---|---|---|---|
 Ohio State |
10 | 10 | 3 | 0 | 23 |
 Texas |
0 | 3 | 0 | 21 | 24 |
Scoring Plays
Q1
12:04
12:04
Connor Hawkins 26 Yd Field Goal
Field Goal Good
3 – 0
Q1
5:39
5:39
Ja'Kobi Jackson 8 Yd Run (Connor Hawkins Kick)
Rushing Touchdown
10 – 0
Q2
5:42
5:42
Gianni Spetic 37 Yd Field Goal
Field Goal Good
10 – 3
Q2
1:41
1:41
Connor Hawkins 30 Yd Field Goal
Field Goal Good
13 – 3
Q2
0:10
0:10
Jeremiah Smith 19 Yd pass from Julian Sayin (Connor Hawkins Kick)
Passing Touchdown
20 – 3
Q3
8:09
8:09
Connor Hawkins 48 Yd Field Goal
Field Goal Good
23 – 3
Q4
14:19
14:19
Ryan Wingo 3 Yd pass from Arch Manning (Gianni Spetic Kick)
Passing Touchdown
23 – 10
Q4
7:14
7:14
Hollywood Smothers 1 Yd Run (Gianni Spetic Kick)
Rushing Touchdown
23 – 17
Q4
0:25
0:25
Hollywood Smothers 1 Yd Run (Gianni Spetic Kick)
Rushing Touchdown
23 – 24
Game Leaders
Ohio StateTexas
 J. Sayin QB
Passing Yards
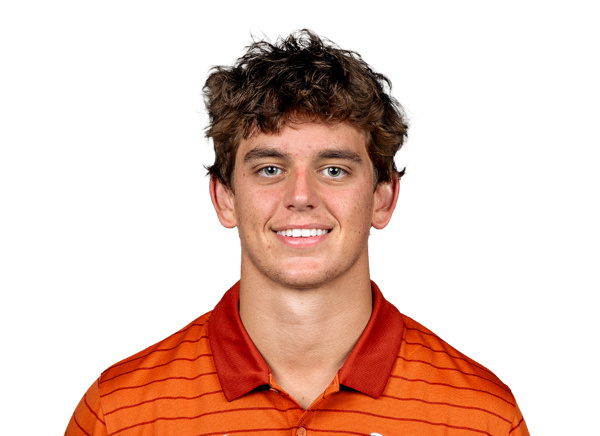 A. Manning QB
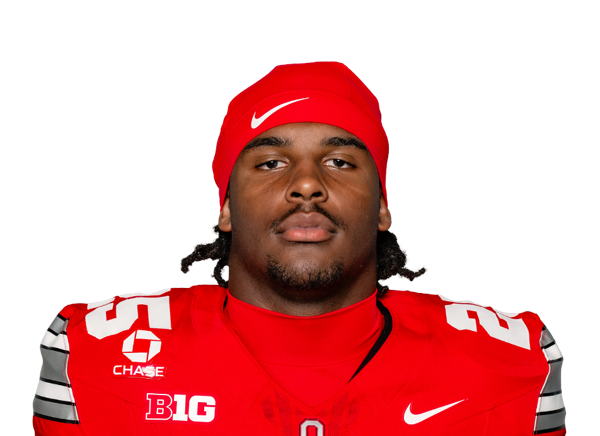 B. Jackson RB
Rushing Yards
 H. Smothers RB
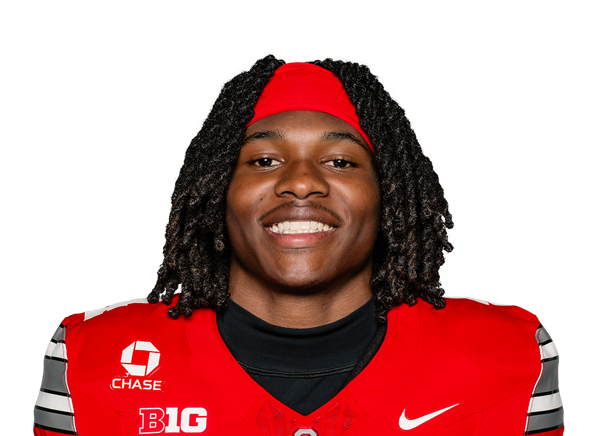 J. Smith WR
Receiving Yards
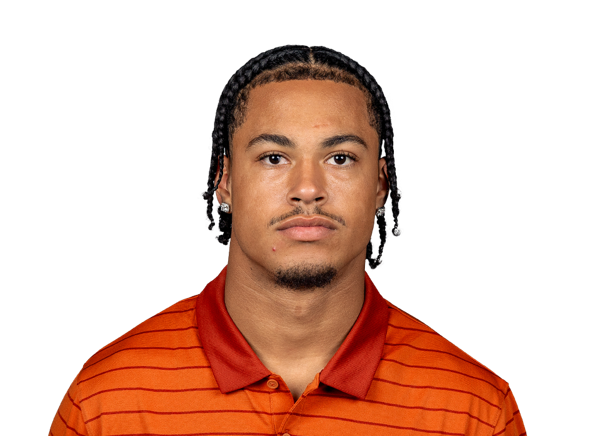 E. Mosley V WR
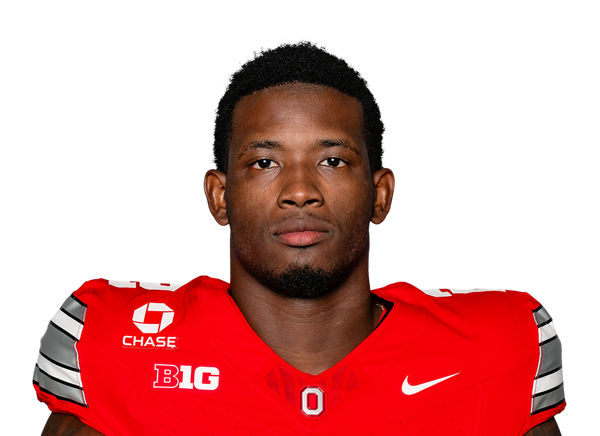 K. Jackson Jr. DE
Sacks
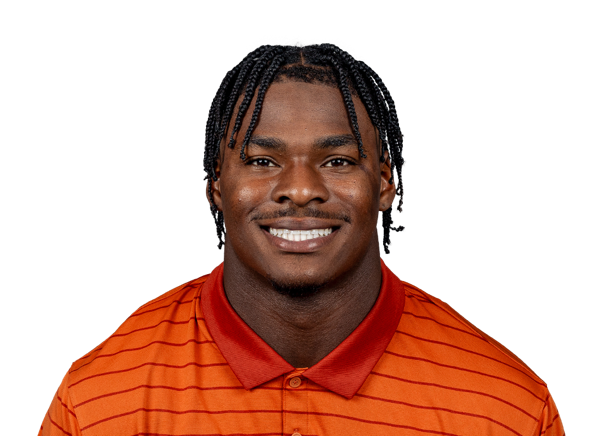 C. Simmons EDGE
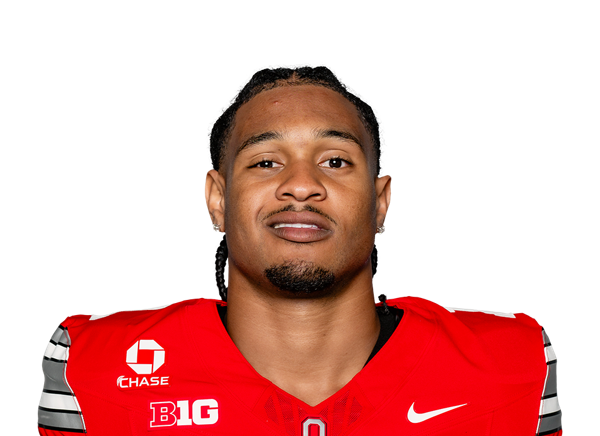 E. Little Jr. S
Tackles
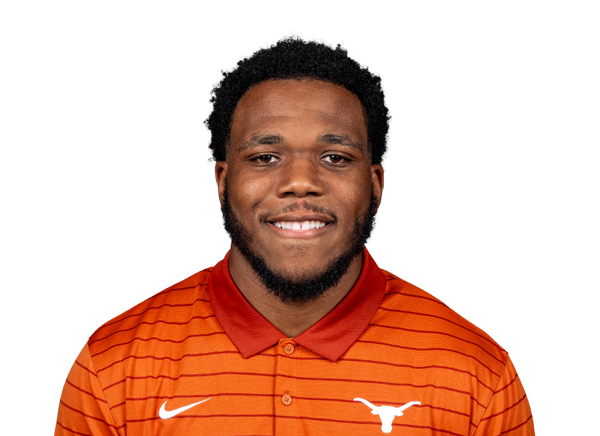 J. Cryer LB
Player Box Score
Ohio State| Player | C/ATT | YDS | AVG | TD | INT | QBR |
|---|---|---|---|---|---|---|
| Julian Sayin#10 | 17/32 | 278 | 8.7 | 1 | 1 | 88.3 |
Texas| Player | C/ATT | YDS | AVG | TD | INT | QBR |
|---|---|---|---|---|---|---|
| Arch Manning#16 | 23/37 | 195 | 5.3 | 1 | 1 | 83.0 |
Ohio State| Player | CAR | YDS | AVG | TD | LONG |
|---|---|---|---|---|---|
| Bo Jackson#25 | 19 | 74 | 3.9 | 0 | 11 |
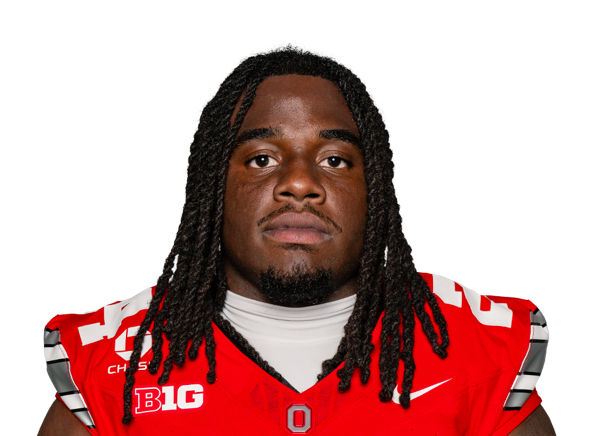 Ja'Kobi Jackson#24 | 5 | 20 | 4.0 | 1 | 8 |
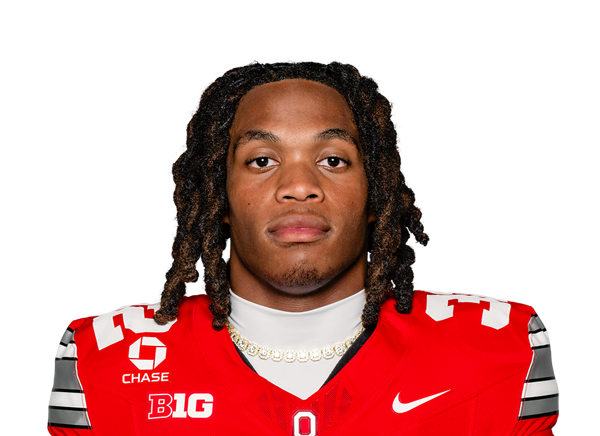 Isaiah West#32 | 2 | 7 | 3.5 | 0 | 5 |
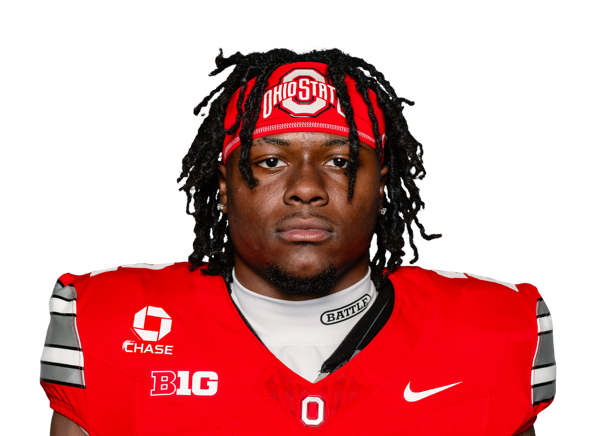 Legend Bey#2 | 1 | 0 | 0.0 | 0 | 0 |
| Julian Sayin#10 | 4 | -7 | -1.8 | 0 | 5 |
Texas| Player | CAR | YDS | AVG | TD | LONG |
|---|---|---|---|---|---|
| Hollywood Smothers#2 | 21 | 74 | 3.5 | 2 | 11 |
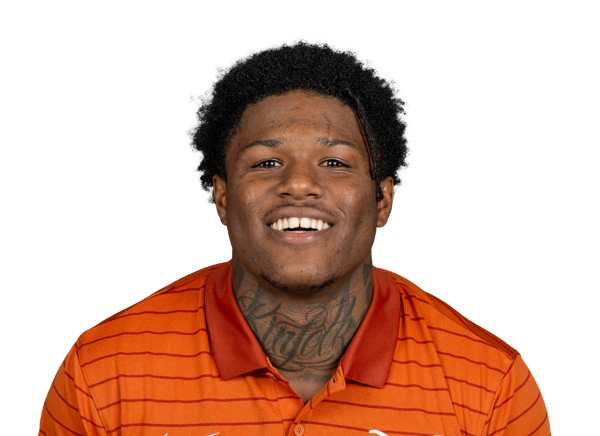 Raleek Brown | 10 | 54 | 5.4 | 0 | 12 |
| Arch Manning#16 | 8 | 24 | 3.0 | 0 | 10 |
 Team | 1 | -1 | -1.0 | 0 | 0 |
 Ryan Wingo#1 | 1 | -10 | -10.0 | 0 | 0 |
Ohio State| Player | REC | YDS | AVG | TD | LONG |
|---|---|---|---|---|---|
| Jeremiah Smith#4 | 8 | 164 | 20.5 | 1 | 43 |
| Bo Jackson#25 | 4 | 37 | 9.3 | 0 | 13 |
 Mason Williams#86 | 2 | 29 | 14.5 | 0 | 23 |
 Nate Roberts#83 | 1 | 24 | 24.0 | 0 | 24 |
 Brandon Inniss | 1 | 19 | 19.0 | 0 | 19 |
 Devin McCuin#3 | 1 | 5 | 5.0 | 0 | 5 |
Texas| Player | REC | YDS | AVG | TD | LONG |
|---|---|---|---|---|---|
| Emmett Mosley V#3 | 5 | 65 | 13.0 | 0 | 19 |
 Emaree Winston#85 | 3 | 39 | 13.0 | 0 | 22 |
 Cam Coleman#8 | 3 | 35 | 11.7 | 0 | 16 |
| Hollywood Smothers#2 | 3 | 29 | 9.7 | 0 | 14 |
| Ryan Wingo#1 | 4 | 22 | 5.5 | 1 | 16 |
 Spencer Shannon#83 | 1 | 4 | 4.0 | 0 | 4 |
| Raleek Brown | 4 | 1 | 0.3 | 0 | 9 |
Ohio State| Player | TOT | SOLO | SACKS | TFL | PD | QB HUR | TD |
|---|---|---|---|---|---|---|---|
| Earl Little Jr.#1 | 11 | 6 | 0 | 0 | 1 | 0 | 0 |
 Payton Pierce#26 | 9 | 6 | 0 | 0 | 0 | 0 | 0 |
 Devin Sanchez#6 | 8 | 8 | 0 | 1 | 0 | 0 | 0 |
 Jay Timmons#25 | 6 | 4 | 0 | 1 | 0 | 0 | 0 |
| Kenyatta Jackson Jr.#2 | 5 | 3 | 1 | 1 | 0 | 0 | 0 |
 Jaylen McClain#8 | 5 | 3 | 0 | 0 | 0 | 0 | 0 |
 Christian Alliegro#14 | 5 | 3 | 0 | 0 | 0 | 1 | 0 |
 Jermaine Mathews Jr.#7 | 5 | 3 | 0 | 1.5 | 0 | 0 | 0 |
 John Walker#55 | 4 | 2 | 0 | 0 | 0 | 0 | 0 |
 Riley Pettijohn#5 | 3 | 2 | 1 | 1.5 | 0 | 0 | 0 |
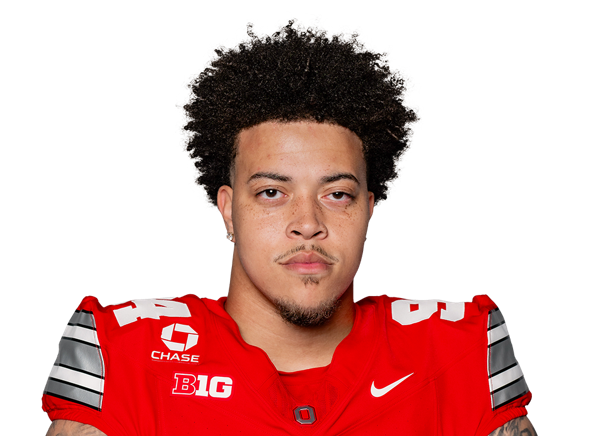 Jason Moore#94 | 3 | 1 | 0 | 0 | 0 | 1 | 0 |
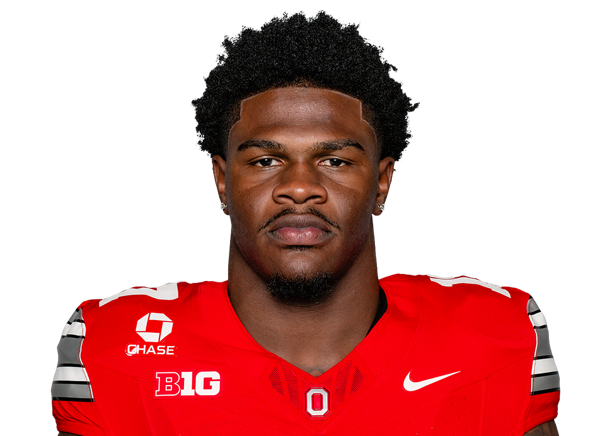 Tarvos Alford#17 | 2 | 2 | 0 | 0 | 0 | 0 | 0 |
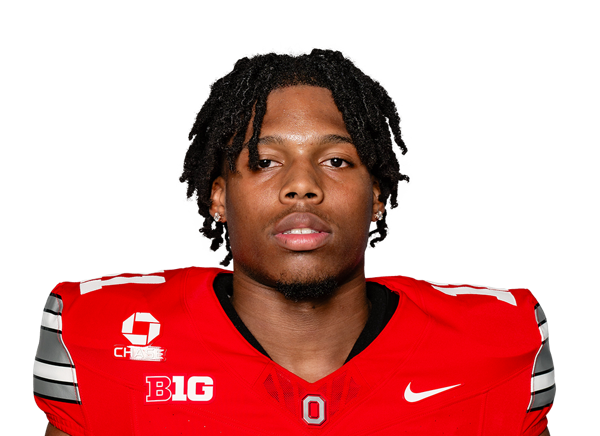 Terry Moore#11 | 1 | 1 | 0 | 0 | 0 | 0 | 0 |
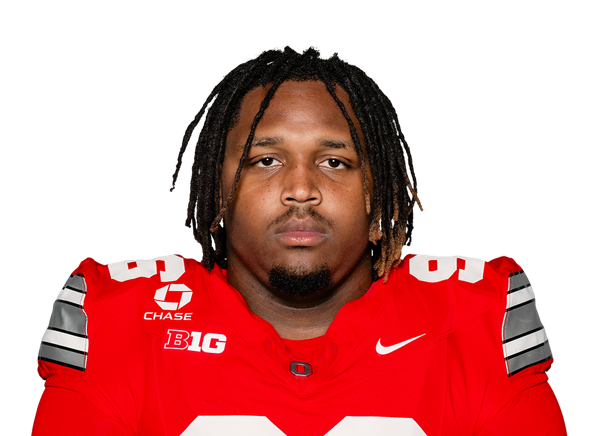 Eddrick Houston#96 | 1 | 1 | 0 | 0 | 0 | 0 | 0 |
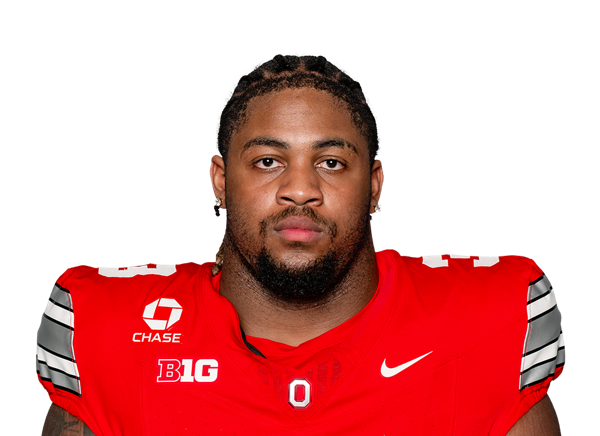 James Smith#3 | 1 | 0 | 0 | 0 | 0 | 0 | 0 |
 Will Smith Jr.#53 | 1 | 0 | 0 | 0 | 0 | 0 | 0 |
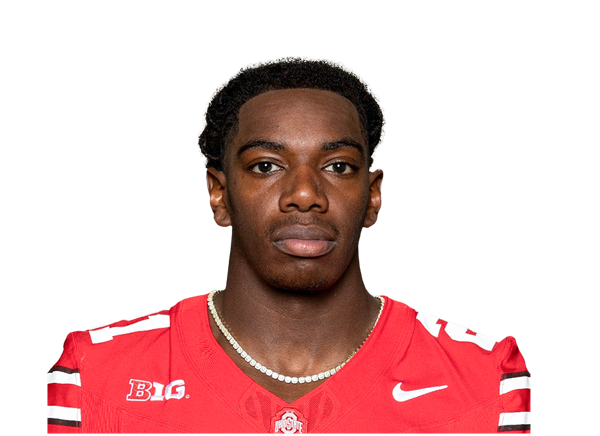 Brenten Jones#21 | 1 | 0 | 0 | 0 | 0 | 0 | 0 |
 Qua Russaw#4 | 1 | 0 | 0 | 0 | 0 | 0 | 0 |
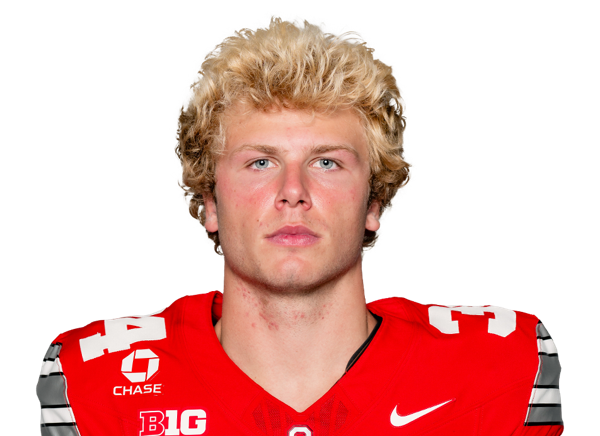 Brennen Schramm#34 | 1 | 0 | 0 | 0 | 0 | 0 | 0 |
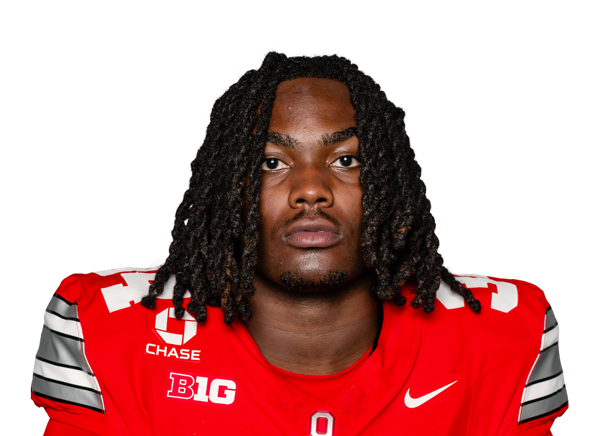 Khary Wilder#34 | 0 | 0 | 0 | 0 | 0 | 2 | 0 |
Texas| Player | TOT | SOLO | SACKS | TFL | PD | QB HUR | TD |
|---|---|---|---|---|---|---|---|
| Justin Cryer#28 | 9 | 2 | 0 | 1 | 1 | 2 | 0 |
 Rasheem Biles#3 | 8 | 6 | 0 | 0 | 0 | 0 | 0 |
 Jelani McDonald#4 | 7 | 0 | 0 | 0 | 0 | 0 | 0 |
 Kade Phillips#8 | 6 | 4 | 0 | 0 | 0 | 0 | 0 |
 Zina Umeozulu#19 | 5 | 1 | 0 | 0.5 | 0 | 0 | 0 |
 Derek Williams Jr.#2 | 4 | 1 | 0 | 0 | 0 | 0 | 0 |
 Warren Roberson#24 | 3 | 2 | 0 | 0 | 0 | 0 | 0 |
 Kobe Black#6 | 3 | 2 | 0 | 0 | 0 | 0 | 0 |
 Lance Jackson#40 | 3 | 1 | 1 | 1 | 0 | 0 | 0 |
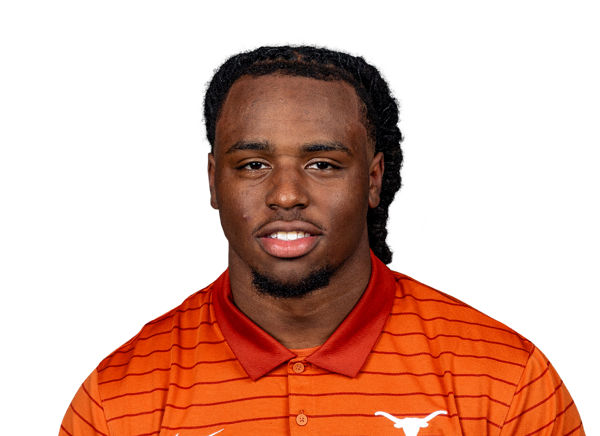 Brad Spence#14 | 3 | 1 | 0 | 0.5 | 0 | 0 | 0 |
 Graceson Littleton#29 | 3 | 1 | 0 | 0 | 1 | 0 | 0 |
| Colin Simmons#1 | 2 | 2 | 1 | 2 | 0 | 0 | 0 |
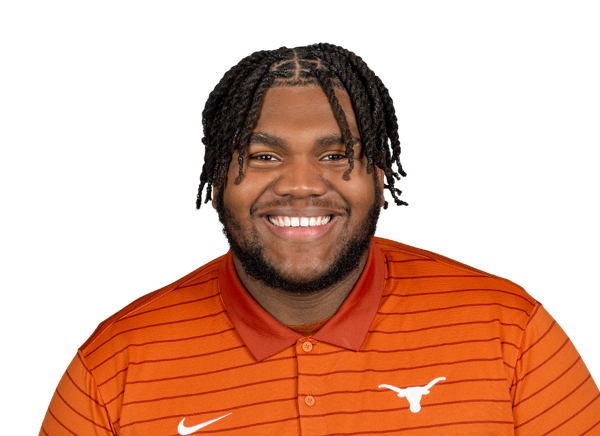 Ian Geffrard#95 | 2 | 1 | 0 | 0 | 0 | 1 | 0 |
 Bo Mascoe#5 | 2 | 1 | 0 | 0 | 0 | 0 | 0 |
| Spencer Shannon#83 | 1 | 1 | 0 | 0 | 0 | 0 | 0 |
 Jermaine Bishop Jr.#4 | 1 | 1 | 0 | 0 | 0 | 0 | 0 |
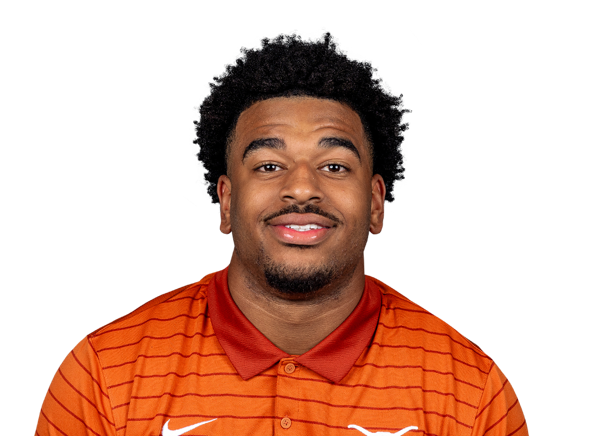 Nick Townsend#81 | 1 | 1 | 0 | 0 | 0 | 0 | 0 |
 Hero Kanu#93 | 1 | 0 | 0 | 0 | 0 | 0 | 0 |
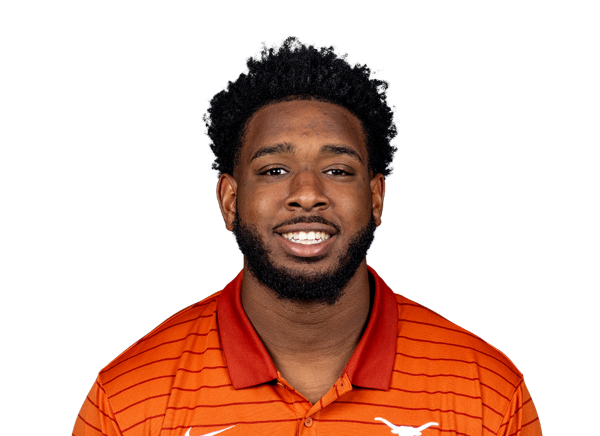 Alex January#97 | 1 | 0 | 0 | 0 | 0 | 1 | 0 |
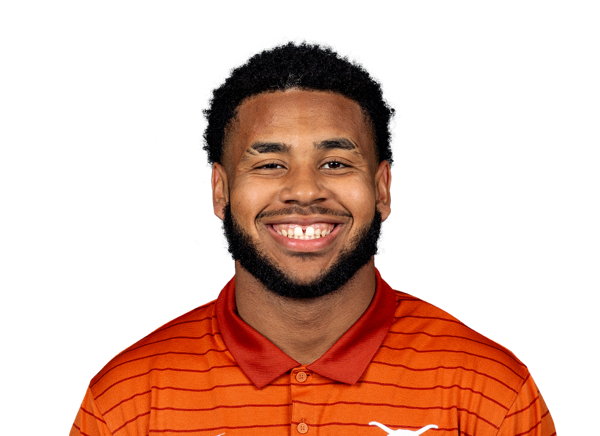 Richard Wesley#99 | 1 | 0 | 0 | 0 | 0 | 0 | 0 |
 Rett Andersen#35 | 0 | 0 | 0 | 0 | 1 | 0 | 0 |
Ohio State| Player | FUM | LOST | REC |
|---|---|---|---|
| Jay Timmons#25 | 0 | 0 | 1 |
Texas| Player | FUM | LOST | REC |
|---|---|---|---|
| Raleek Brown | 1 | 1 | 0 |
| Hollywood Smothers#2 | 1 | 0 | 0 |
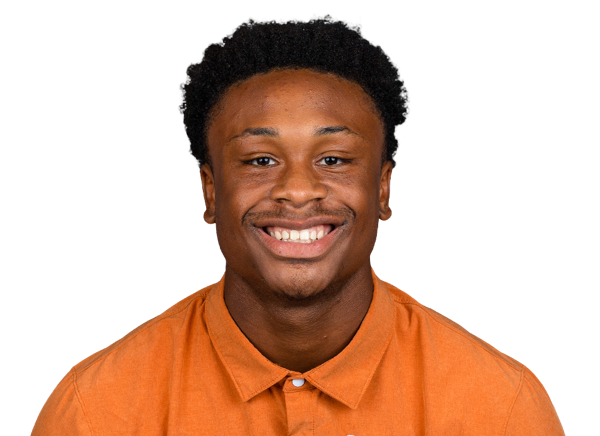 Ryan Niblett#21 | 1 | 0 | 0 |
| Emmett Mosley V#3 | 1 | 0 | 0 |
Ohio State| Player | FG | PCT | LONG | XP | PTS |
|---|---|---|---|---|---|
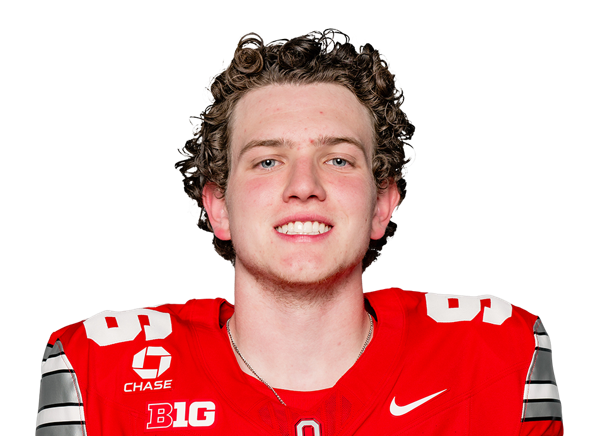 Connor Hawkins#96 | 3/4 | 75.0 | 48 | 2/2 | 11 |
Texas| Player | FG | PCT | LONG | XP | PTS |
|---|---|---|---|---|---|
 Gianni Spetic#44 | 1/1 | 100.0 | 37 | 3/3 | 6 |
Ohio State| Player | NO | YDS | AVG | TB | In 20 | LONG |
|---|---|---|---|---|---|---|
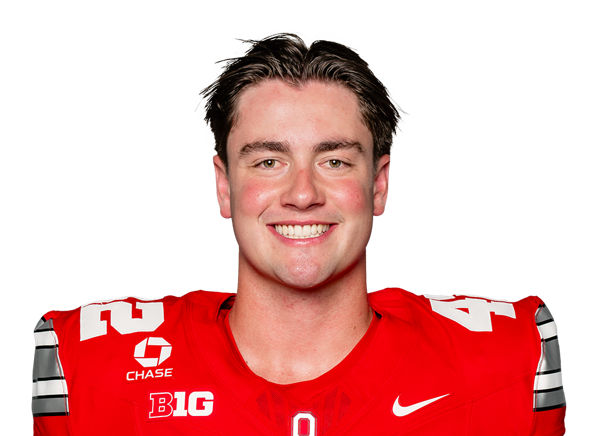 Joe McGuire#42 | 3 | 117 | 39.0 | 0 | 2 | 50 |
Texas| Player | NO | YDS | AVG | TB | In 20 | LONG |
|---|---|---|---|---|---|---|
 Mac Chiumento#43 | 3 | 122 | 40.7 | 0 | 0 | 43 |
Texas| Player | NO | YDS | AVG | LONG | TD |
|---|---|---|---|---|---|
| Hollywood Smothers#2 | 1 | 19 | 19.0 | 19 | 0 |
| Ryan Niblett#21 | 1 | 16 | 16.0 | 16 | 0 |
Ohio State| Player | NO | YDS | AVG | LONG | TD |
|---|---|---|---|---|---|
| Brandon Inniss | 2 | 16 | 8.0 | 16 | 0 |
Texas| Player | NO | YDS | AVG | LONG | TD |
|---|---|---|---|---|---|
| Ryan Niblett#21 | 1 | -2 | -2.0 | 0 | 0 |
Ohio State| Player | INT | YDS | TD |
|---|---|---|---|
| Jaylen McClain#8 | 1 | 7 | 0 |
Texas| Player | INT | YDS | TD |
|---|---|---|---|
| Graceson Littleton#29 | 1 | 0 | 0 |
Drive Summary
TEX
Fumble
-4
OSU
Field Goal
11
TEX
Interception
13
OSU
Touchdown
81
TEX
Punt
-4
OSU
Downs
36
TEX
Field Goal
69
OSU
Field Goal
63
TEX
Downs
24
OSU
Touchdown
49
TEX
End of Half
-1
OSU
Punt
36
TEX
Punt
17
OSU
Field Goal
43
TEX
Punt
1
OSU
Punt
1
TEX
Touchdown
91
OSU
Punt
6
TEX
Touchdown
72
OSU
Missed FG
48
TEX
Touchdown
73
OSU
Interception
-5
Injury Report
No current injury report is available for this matchup.
Head-to-Head
Historical meetings are not available for this matchup.
Game Information
StageWeek 2
Season2026
KickoffSat, Sep 12, 7:30 pm
VenueDKR-Texas Memorial Stadium
LocationAustin, TX
SurfaceArtificial Turf
BroadcastABC
Attendance105,044
Division Standings
FBS — Big Ten Conference
| Team | W | L | T | Pct | PF | PA | Home | Away | Strk |
|---|---|---|---|---|---|---|---|---|---|
 USC | 7 | 3 | 0 | 0.700 | 305 | 245 | 5-1 | 2-2 | L1 |
 Indiana | 9 | 1 | 0 | 0.900 | 319 | 125 | 6-1 | 3-0 | W3 |
 Iowa | 8 | 2 | 0 | 0.800 | 278 | 117 | 5-1 | 3-1 | W3 |
 Maryland | 4 | 6 | 0 | 0.400 | 273 | 303 | 2-4 | 2-2 | W2 |
 Michigan | 5 | 5 | 0 | 0.500 | 183 | 177 | 4-3 | 1-2 | L2 |
 Michigan State | 3 | 7 | 0 | 0.300 | 188 | 233 | 2-4 | 1-3 | L1 |
 Nebraska | 6 | 4 | 0 | 0.600 | 303 | 149 | 4-2 | 2-2 | W1 |
 Penn State | 6 | 4 | 0 | 0.600 | 302 | 188 | 4-2 | 2-2 | W3 |
 UCLA | 10 | 0 | 0 | 1.000 | 324 | 141 | 6-0 | 4-0 | W10 |
 Washington | 6 | 4 | 0 | 0.600 | 258 | 211 | 3-3 | 3-1 | W1 |
 Northwestern | 6 | 4 | 0 | 0.600 | 298 | 202 | 5-1 | 1-3 | L3 |
 Illinois | 6 | 4 | 0 | 0.600 | 270 | 229 | 4-2 | 2-2 | L1 |
 Minnesota | 5 | 5 | 0 | 0.500 | 236 | 240 | 4-2 | 1-3 | L3 |
| Ohio State | 7 | 3 | 0 | 0.700 | 349 | 184 | 5-1 | 2-2 | W1 |
 Oregon | 7 | 3 | 0 | 0.700 | 338 | 206 | 5-1 | 2-2 | W3 |
 Purdue | 3 | 7 | 0 | 0.300 | 272 | 319 | 2-4 | 1-3 | L4 |
 Wisconsin | 6 | 4 | 0 | 0.600 | 241 | 171 | 5-0 | 1-4 | L1 |
 Rutgers | 2 | 8 | 0 | 0.200 | 232 | 323 | 1-5 | 1-3 | L4 |
FBS — Southeastern Conference
| Team | W | L | T | Pct | PF | PA | Home | Away | Strk |
|---|---|---|---|---|---|---|---|---|---|
 Alabama | 8 | 2 | 0 | 0.800 | 358 | 189 | 4-1 | 4-1 | W3 |
 Auburn | 6 | 4 | 0 | 0.600 | 260 | 246 | 4-2 | 2-2 | W2 |
 Florida | 6 | 4 | 0 | 0.600 | 313 | 262 | 3-2 | 3-2 | W1 |
 Georgia | 9 | 1 | 0 | 0.900 | 418 | 147 | 6-1 | 3-0 | W3 |
 LSU | 6 | 4 | 0 | 0.600 | 355 | 181 | 5-2 | 1-2 | L2 |
 Mississippi State | 4 | 6 | 0 | 0.400 | 245 | 291 | 2-4 | 2-2 | L6 |
 Missouri | 6 | 4 | 0 | 0.600 | 293 | 229 | 4-1 | 2-3 | L2 |
 Ole Miss | 6 | 3 | 0 | 0.667 | 304 | 234 | 5-1 | 1-2 | L1 |
 South Carolina | 6 | 4 | 0 | 0.600 | 318 | 245 | 4-2 | 2-2 | L1 |
 Tennessee | 8 | 2 | 0 | 0.800 | 314 | 143 | 5-1 | 3-1 | W2 |
| Texas | 8 | 2 | 0 | 0.800 | 302 | 178 | 5-1 | 3-1 | W4 |
 Texas A&M | 4 | 6 | 0 | 0.400 | 242 | 190 | 4-2 | 0-4 | L3 |
 Vanderbilt | 4 | 6 | 0 | 0.400 | 213 | 286 | 3-3 | 1-3 | L1 |
 Arkansas | 4 | 6 | 0 | 0.400 | 214 | 253 | 3-3 | 1-3 | W1 |
 Oklahoma | 5 | 4 | 0 | 0.556 | 199 | 173 | 3-2 | 2-2 | W1 |
 Kentucky | 7 | 3 | 0 | 0.700 | 283 | 253 | 4-2 | 3-1 | L2 |
Ohio State
3rd in Big Ten
VS
Texas
2nd in SEC
Quarterbacks & Specialists
#42
Joe McGuire
#10
Julian Sayin
Receivers & Backs
#2
Legend Bey
Brandon Inniss
#25
Bo Jackson
#24
Ja'Kobi Jackson
#3
Devin McCuin
#83
Nate Roberts
#34
Brennen Schramm
#4
Jeremiah Smith
#32
Isaiah West
#86
Mason Williams
Defensive Line & Linebackers
#17
Tarvos Alford
#14
Christian Alliegro
#96
Eddrick Houston
#2
Kenyatta Jackson Jr.
#94
Jason Moore
#5
Riley Pettijohn
#26
Payton Pierce
#4
Qua Russaw
#3
James Smith
#53
Will Smith Jr.
#55
John Walker
#34
Khary Wilder
Defensive Backs
#21
Brenten Jones
#1
Earl Little Jr.
#7
Jermaine Mathews Jr.
#8
Jaylen McClain
#11
Terry Moore
#6
Devin Sanchez
#25
Jay Timmons
Other
#96
Connor Hawkins
Quarterbacks & Specialists
#43
Mac Chiumento
#16
Arch Manning
Receivers & Backs
#35
Rett Andersen
#4
Jermaine Bishop Jr.
Raleek Brown
#8
Cam Coleman
#3
Emmett Mosley V
#21
Ryan Niblett
#83
Spencer Shannon
#2
Hollywood Smothers
#81
Nick Townsend
#1
Ryan Wingo
#85
Emaree Winston
Defensive Line & Linebackers
#3
Rasheem Biles
#28
Justin Cryer
#95
Ian Geffrard
#97
Alex January
#93
Hero Kanu
#14
Brad Spence
Defensive Backs
#6
Kobe Black
#29
Graceson Littleton
#5
Bo Mascoe
#4
Jelani McDonald
#8
Kade Phillips
#24
Warren Roberson
#2
Derek Williams Jr.
Other
#40
Lance Jackson
#1
Colin Simmons
#44
Gianni Spetic
#19
Zina Umeozulu
#99
Richard Wesley
Ohio State
3rd in Big Ten
VS
Texas
3rd in SEC
Passing
67.2
Completion Percentage
65.2
223
Completions
195
2.70
Interception Percentage
3.30
9
Interceptions
10
75
Longest Pass
62
3,083
Net Passing Yards
2,261
308.3
Net Passing Yards Per Game
226.1
332
Passing Attempts
299
8.40
Passing Touchdown %
6.40
28
Passing Touchdowns
19
167.8
Passer Rating
143.4
20
Total Sacks
30
153
Sack Yards Lost
197
9.3
Yards Per Pass Attempt
7.6
3,083
Passing Yards
2,261
0
Passing Fumbles Lost
0
10
Team Games Played
10
458.0
Yards Per Game
354.7
34.9
Total Points Per Game
30.2
349
Total Points
302
45
Total Touchdowns
36
308.3
Passing Yards Per Game
226.1
223-332
Comp-Att
195-299
20-153
Sacks-Yards Lost
30-197
Rushing
367
Rushing Attempts
361
1,497
Rushing Yards
1,286
4.1
Yards Per Rush Attempt
3.6
65
Long Rushing
47
0
20+ Yard Rushing Plays
0
16
Rushing Touchdowns
14
149.7
Rushing Yards Per Game
128.6
0
Rushing Fumbles
0
0
Rushing Fumbles Lost
0
92
Rushing 1st downs
81
10
Team Games Played
10
4,580
Total Yards
3,547
719
Total Offensive Plays
690
34.9
Total Points Per Game
30.2
349
Total Points
302
45
Total Touchdowns
36
Receiving
223
Receptions
195
0
Receiving Targets
0
3,083
Receiving Yards
2,261
3,083
Receiving Yards
2,261
28
Receiving Touchdowns
19
75
Long Reception
62
0
20+ Yard Receiving Plays
0
308.3
Receiving Yards Per Game
226.1
0
Receiving Fumbles
0
0
Receiving Fumbles Lost
0
1309
Receiving Yards After Catch
1254
136
Receiving First Downs
98
10
Team Games Played
10
13.8
Yards Per Reception
11.6
34.9
Total Points Per Game
30.2
349
Total Points
302
45
Total Touchdowns
36
Miscellaneous
243
Total 1st downs
198
92
Rushing 1st downs
81
136
Passing 1st downs
98
15
1st downs by penalty
19
58
Third Down Conversions
57
130
Third Down Attempts
141
44.62
3rd down %
40.43
13
Fourth Down Conversions
8
22
First Downs Attempts
13
59.09
4th down %
61.54
70
Total Penalties
65
535
Total Penalty Yards
617
19566
Possession Time Seconds
18047
0.00
Red Zone Field Goal Percentage
0.00
0.00
Red Zone Scoring Percentage
0.00
0.00
Red Zone Efficiency Percentage
0.00
0.00
Red Zone Touchdown Percentage
0.00
20
Total Takeaways
16
13
Total Giveaways
17
7
Turnover Ratio
-1
0
Fumbles Lost
0
58-130
3rd down efficiency
57-141
13-22
4th down efficiency
8-13
70-535
Total-Yards
65-617
Defense
313
Solo Tackles
361
272
Assist Tackles
318
585
Total Tackles
679
16
Sacks
30
115
Sack Yards
173
77
Stuffs
88
51
Passes Defended
46
4.3
Average Interception Yards
2.1
8
Long Interception
15
0
Miscellaneous Touchdowns
0
0
Kicks Blocked
2
44
Tackles For Loss
58
10
Team Games Played
10
Defensive Interceptions
4
Interceptions
9
17
Interception Yards
19
0
Interception Touchdowns
0
4-17
INT: Total
9-19
General
8
Fumbles
14
7
Forced Fumbles
8
11
Fumbles Recovered
6
1
Fumbles Touchdowns
2
10
Games Played
10
8-0
Fumbles-Lost
14-0
Returning
15
Kick Returns
10
244
Kick Return Yards
156
16.3
Yards Per Kick Return
15.6
29
Long Kick Return
28
0
Kick Return Touchdowns
0
23
Punt Returns
20
140
Punt Return Yards
217
6.1
Yards Per Punt Return
10.9
31
Long Punt Return
63
0
Punt Return Touchdowns
1
0
Punt Return Fair Catches
0
0
Kick Return Fumbles Lost
0
0
Punt Return Fumbles Lost
0
10
Team Games Played
10
23-140
Punt: Total
20-217
Kicking
12
Field Goal Made
17
14
Field Goal Attempts
18
85.7
Field Goal Percentage
94.4
48
Long Field Goal Made
52
0
Field Goal Attempts 1-19
0
5
Field Goal Attempts 20-29
5
4
Field Goal Attempts 30-39
5
5
Field Goal Attempts 40-49
5
0
Field Goal Attempts 50+
3
41
Extra Points Made
35
41
Extra Point Attempts
35
100.0
Extra Point Percentage
100.0
0
Field Goals Made 1-19
0
5
Field Goals Made 20-29
5
4
Field Goals Made 30-39
5
3
Field Goals Made 40-49
5
0
Field Goals Made 50+
2
77
Total Kicking Points
86
10
Team Games Played
10
75
Touchback Percentage
62
0.0
Average Kickoff Return Yards
0.0
0
Kickoff Return Yards
0
0
Kickoff Returns
0
0-0
Kickoffs: Total
0-0
12-14
FG: Good-Attempts
17-18
Punting
30
Punts
44
1,300
Punt Yards
1,805
56
Long Punt
57
43.3
Gross Average Punt Yards
41.0
43.3
Net Average Punt Yards
41.0
0
Punts Blocked
0
11
Punts Inside 20
12
2
Touchbacks
2
13
Fair Catches
18
11
Punt Returns
10
0
Punt Return Yards
0
0.0
Average Punt Return Yards
0.0
10
Team Games Played
10
30-1,300
Punt: Total Yards
44-1,805
Scoring
16
Rushing Touchdowns
14
28
Receiving Touchdowns
19
0
Return Touchdowns
1
45
Total Touchdowns
36
12
Field Goals
17
41
Kick Extra Points
35
1
Total Two Point Conversions
0
349
Total Points
302
34.9
Total Points Per Game
30.2