

Ohio vs South Alabama Live Score (19 Sep, 2026)
Score by Quarter
| Team | Q1 | Q2 | Q3 | Q4 | Final |
|---|---|---|---|---|---|
 Ohio |
7 | 0 | 14 | 15 | 36 |
 South Alabama |
14 | 10 | 7 | 10 | 41 |
Scoring Plays
Q1
12:07
12:07
Keenan Phillips 6 Yd Run (Davis Little Kick)
Rushing Touchdown
0 – 7
Q1
4:37
4:37
Riley Neer 5 Yd pass from Matt Vezza (Will Hryszko Kick)
Passing Touchdown
7 – 7
Q1
1:39
1:39
Rod Gibbs 34 Yd pass from Jared Hollins (Davis Little Kick)
Pass Reception
7 – 14
Q2
14:24
14:24
Trae'von Dunbar 32 Yd Run (Davis Little Kick)
Rushing Touchdown
7 – 21
Q2
0:52
0:52
Davis Little 32 Yd Field Goal
Field Goal Good
7 – 24
Q3
13:59
13:59
Victor Rosa 33 Yd Run (Will Hryszko Kick)
Rushing Touchdown
14 – 24
Q3
12:09
12:09
Riley Neer 9 Yd pass from Matt Vezza (Will Hryszko Kick)
Passing Touchdown
21 – 24
Q3
8:05
8:05
PJ Martin 1 Yd Run (Davis Little Kick)
Rushing Touchdown
21 – 31
Q4
8:21
8:21
Trae'von Dunbar 5 Yd Run (Davis Little Kick)
Rushing Touchdown
21 – 38
Q4
5:20
5:20
AJ Miller 10 Yd pass from Levi Davis (Levi Davis Pass to AJ Miller for Two-Point Conversion)
Passing Touchdown
29 – 38
Q4
1:10
1:10
Davis Little 21 Yd Field Goal
Field Goal Good
29 – 41
Q4
0:00
0:00
Dom Dorwart 21 Yd pass from Levi Davis (Will Hryszko Kick)
Passing Touchdown
36 – 41
Game Leaders
OhioSouth Alabama
 L. Davis QB
Passing Yards
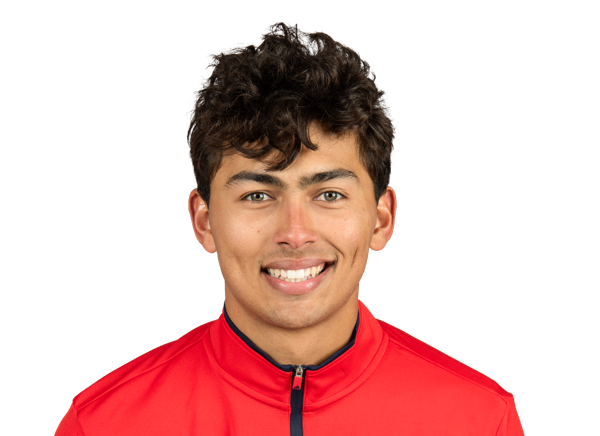 J. Hollins QB
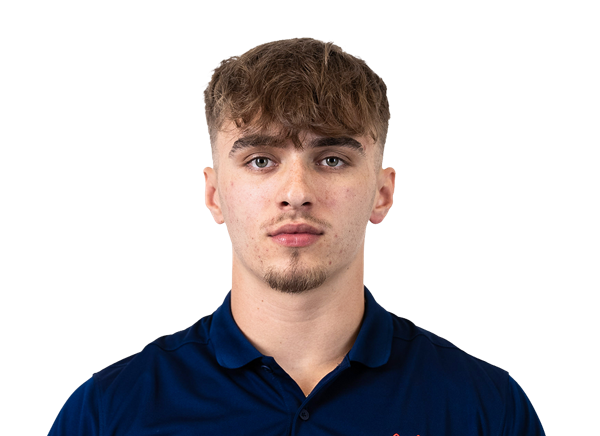 V. Rosa RB
Rushing Yards
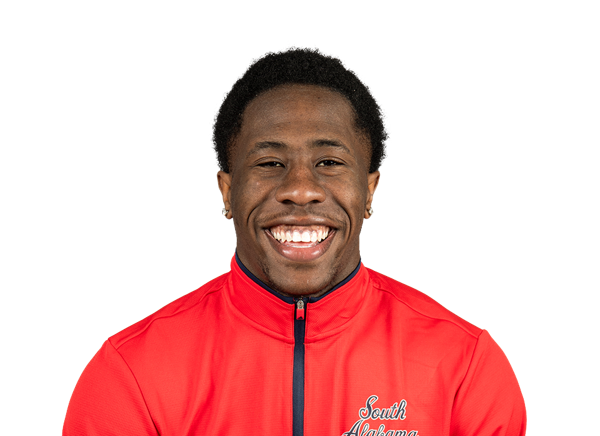 K. Phillips RB
 R. Neer WR
Receiving Yards
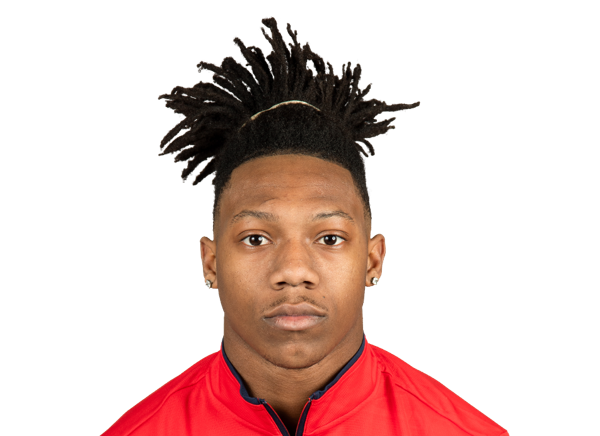 J. Jones-Thomas WR
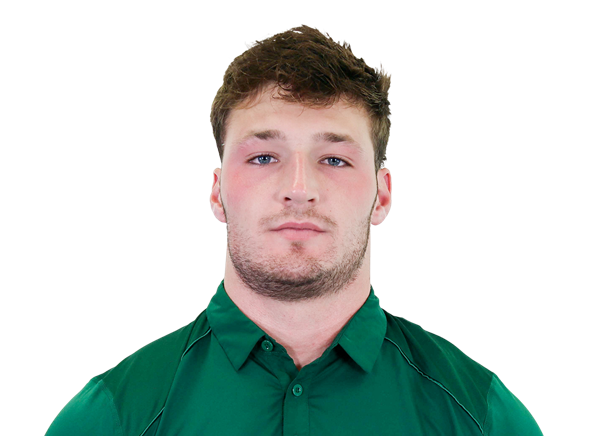 M. Molnar LB
Tackles
 J. Williams LB
—
Sacks
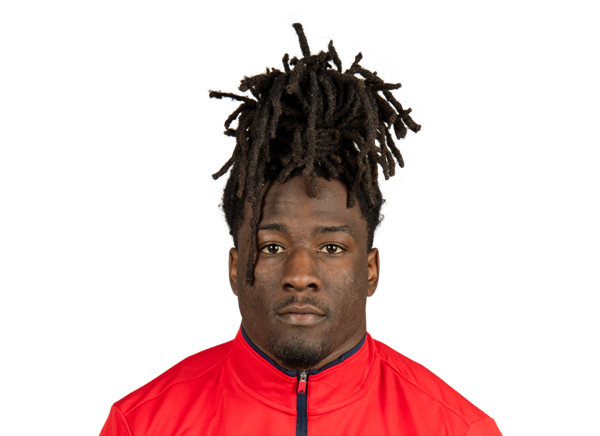 D. Darby CB
Player Box Score
Ohio| Player | C/ATT | YDS | AVG | TD | INT |
|---|---|---|---|---|---|
| Levi Davis#7 | 9/15 | 121 | 8.1 | 2 | 0 |
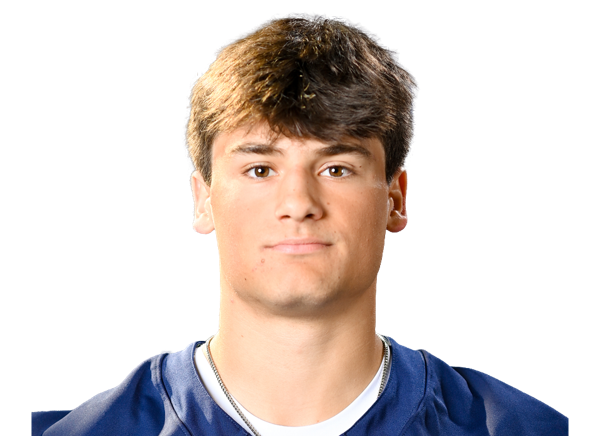 Matt Vezza#9 | 12/16 | 113 | 7.1 | 2 | 1 |
South Alabama| Player | C/ATT | YDS | AVG | TD | INT |
|---|---|---|---|---|---|
| Jared Hollins#7 | 13/20 | 192 | 9.6 | 1 | 0 |
Ohio| Player | CAR | YDS | AVG | TD | LONG |
|---|---|---|---|---|---|
| Victor Rosa#4 | 13 | 78 | 6.0 | 1 | 33 |
| Matt Vezza#9 | 9 | 46 | 5.1 | 0 | 19 |
| Levi Davis#7 | 4 | 27 | 6.8 | 0 | 18 |
| Mike Taylor Jr.#22 | 2 | 2 | 1.0 | 0 | 5 |
South Alabama| Player | CAR | YDS | AVG | TD | LONG |
|---|---|---|---|---|---|
| Keenan Phillips#3 | 18 | 116 | 6.4 | 1 | 28 |
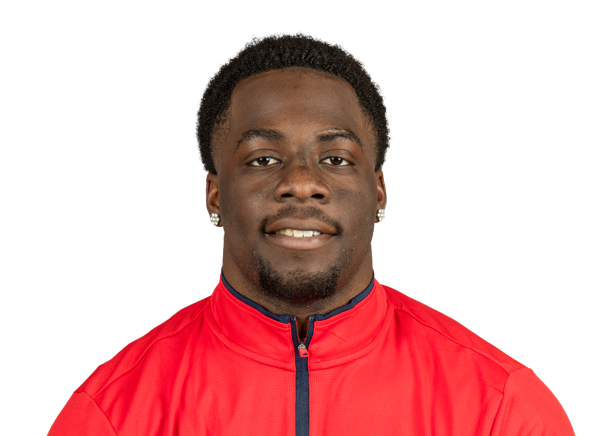 PJ Martin | 21 | 80 | 3.8 | 1 | 21 |
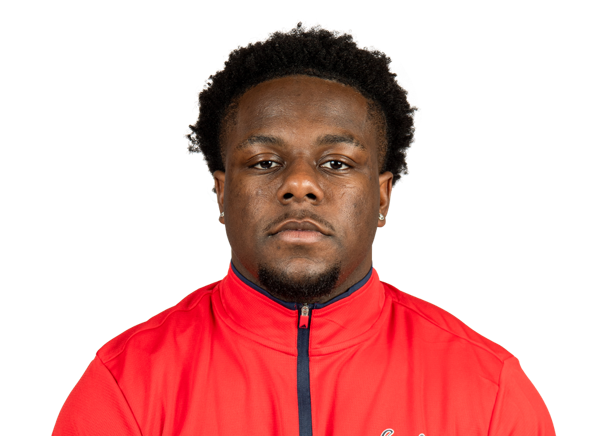 Trae'von Dunbar#21 | 6 | 52 | 8.7 | 2 | 32 |
| Jared Hollins#7 | 5 | 18 | 3.6 | 0 | 6 |
Ohio| Player | REC | YDS | AVG | TD | LONG |
|---|---|---|---|---|---|
| Riley Neer#15 | 6 | 61 | 10.2 | 2 | 17 |
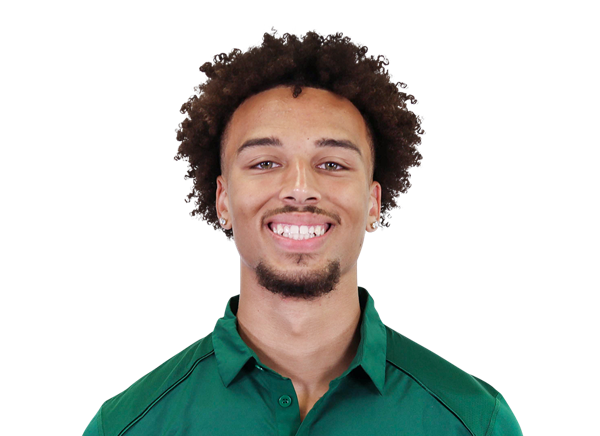 Dom Dorwart#3 | 5 | 61 | 12.2 | 1 | 21 |
| Riley Palmeter#85 | 3 | 49 | 16.3 | 0 | 41 |
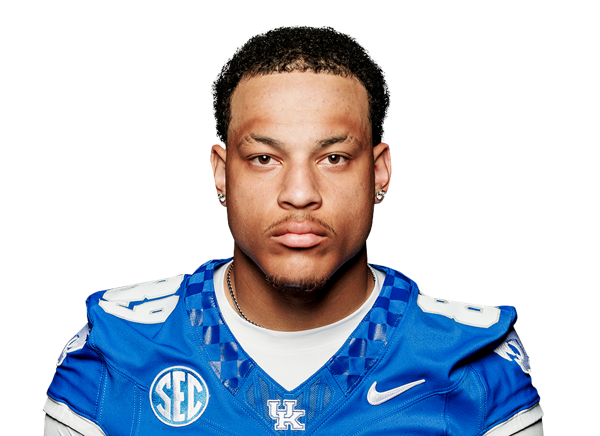 Preston Bowman#2 | 3 | 45 | 15.0 | 0 | 24 |
| Victor Rosa#4 | 2 | 13 | 6.5 | 0 | 11 |
 AJ Miller#84 | 1 | 10 | 10.0 | 1 | 10 |
 Irving Brown#24 | 1 | -5 | -5.0 | 0 | 0 |
South Alabama| Player | REC | YDS | AVG | TD | LONG |
|---|---|---|---|---|---|
| Jeremiah Jones-Thomas#2 | 6 | 74 | 12.3 | 0 | 40 |
 Micah Woods#6 | 1 | 49 | 49.0 | 0 | 49 |
 Rod Gibbs#9 | 2 | 33 | 16.5 | 1 | 34 |
| Keenan Phillips#3 | 2 | 25 | 12.5 | 0 | 15 |
 Anthony Eager#1 | 1 | 6 | 6.0 | 0 | 6 |
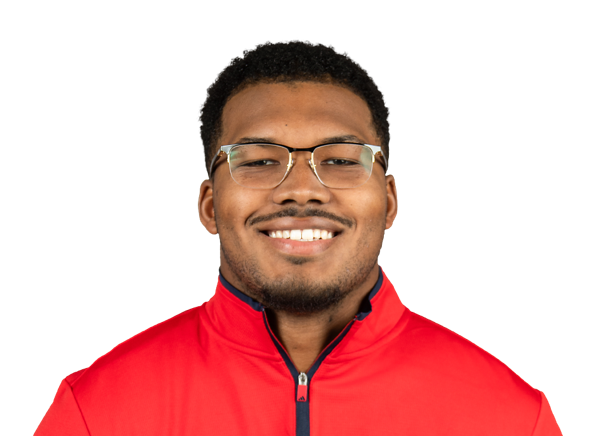 Brendan Jenkins#12 | 1 | 5 | 5.0 | 0 | 5 |
Ohio| Player | TOT | SOLO | SACKS | TFL | PD | QB HUR | TD |
|---|---|---|---|---|---|---|---|
| Michael Molnar#25 | 16 | 9 | 0 | 1 | 0 | 0 | 0 |
 DJ Walker#2 | 9 | 3 | 0 | 3 | 1 | 0 | 0 |
 Ronald Jackson Jr.#21 | 8 | 5 | 0 | 1 | 0 | 0 | 0 |
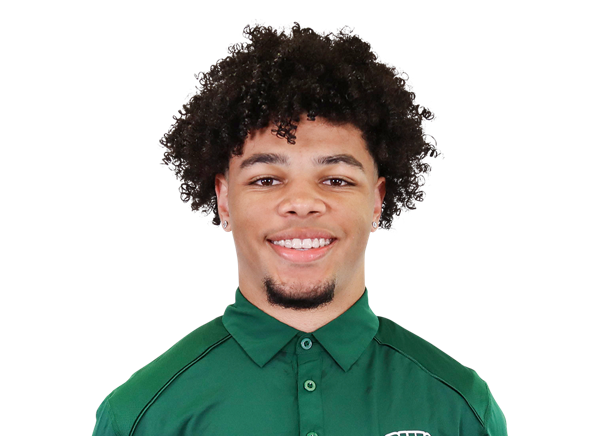 JT Haskins#3 | 8 | 2 | 0 | 0 | 0 | 0 | 0 |
 Barry Dillon#8 | 6 | 4 | 0 | 0 | 0 | 0 | 0 |
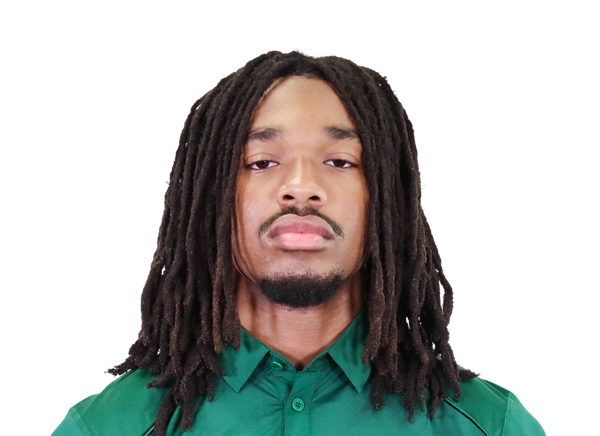 Kendall Bannister#20 | 4 | 3 | 0 | 0 | 0 | 0 | 0 |
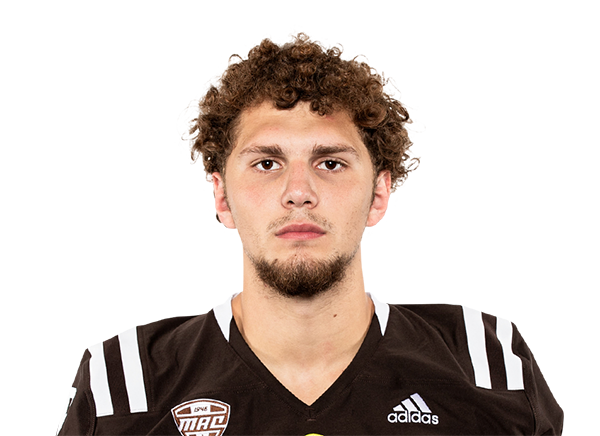 Isaiah Street#51 | 4 | 2 | 0 | 0 | 0 | 1 | 0 |
 Evan Herrmann#11 | 4 | 0 | 0 | 0 | 0 | 0 | 0 |
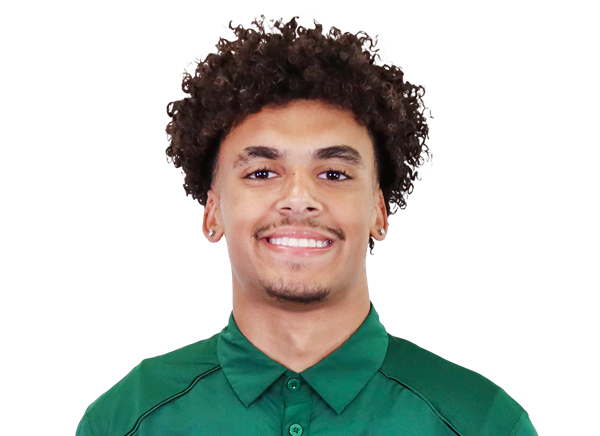 Bobby Miller#19 | 3 | 3 | 0 | 1 | 0 | 0 | 0 |
 Nathan Hale#57 | 3 | 2 | 0 | 0 | 0 | 0 | 0 |
 Jack Fries#27 | 3 | 0 | 0 | 0 | 0 | 1 | 0 |
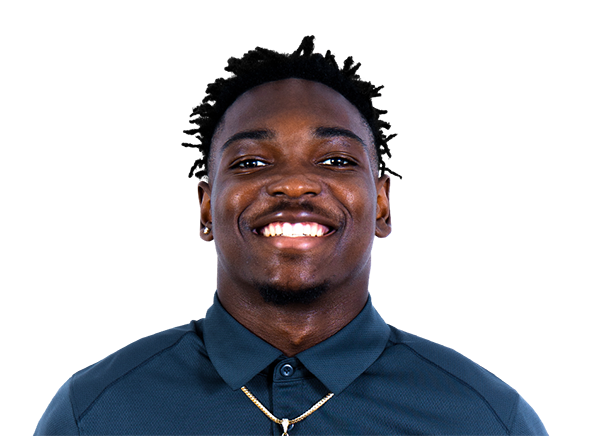 Darren James-Hamilton#4 | 3 | 0 | 0 | 0 | 0 | 0 | 0 |
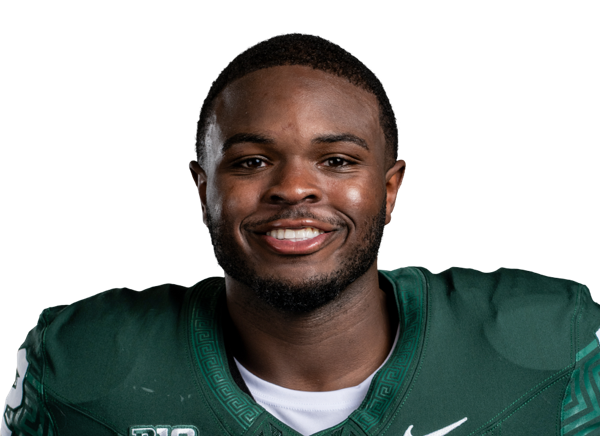 Tyler Gillison#9 | 2 | 1 | 0 | 0 | 1 | 0 | 0 |
 Owen DiFranco#50 | 2 | 0 | 0 | 0 | 0 | 0 | 0 |
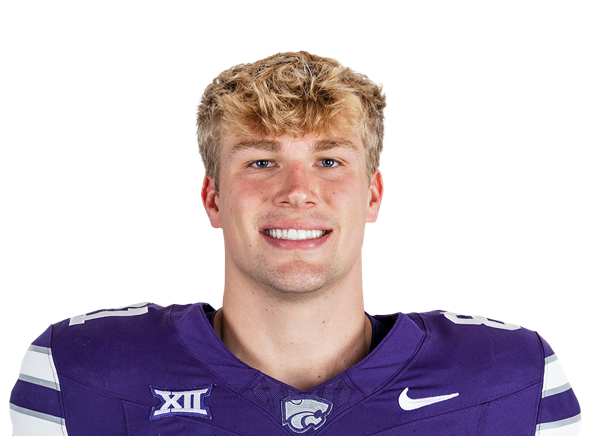 Andrew Metzger#86 | 1 | 1 | 0 | 0 | 0 | 0 | 0 |
 Miles Cremascoli#18 | 1 | 1 | 0 | 0 | 0 | 0 | 0 |
 Ty Neubert#99 | 1 | 1 | 0 | 1 | 0 | 0 | 0 |
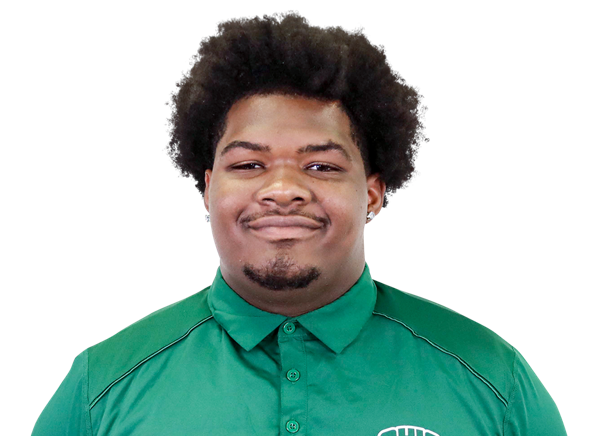 Nehemiah Dukes | 1 | 0 | 0 | 0 | 0 | 0 | 0 |
 Jermaine Minnis#12 | 1 | 0 | 0 | 0.5 | 0 | 0 | 0 |
 DJ Morton#13 | 1 | 0 | 0 | 0 | 0 | 0 | 0 |
 Tyson Long#26 | 1 | 0 | 0 | 0 | 0 | 0 | 0 |
 Derek Reagans#98 | 1 | 0 | 0 | 0.5 | 0 | 0 | 0 |
South Alabama| Player | TOT | SOLO | SACKS | TFL | PD | QB HUR | TD |
|---|---|---|---|---|---|---|---|
| Jordan Williams#48 | 7 | 2 | 0 | 0.5 | 0 | 0 | 0 |
 Cole Blaylock#14 | 6 | 2 | 0 | 0 | 0 | 0 | 0 |
 Parker Shattuck#11 | 6 | 2 | 0.5 | 0.5 | 0 | 1 | 0 |
 Jaylen Moson#12 | 4 | 4 | 0 | 0 | 0 | 0 | 0 |
| Damyrion Darby#24 | 4 | 3 | 1.5 | 1.5 | 1 | 0 | 0 |
 Tre Brown#49 | 4 | 2 | 0 | 0.5 | 0 | 0 | 0 |
 Tre'Mon Henry#25 | 4 | 0 | 0 | 1 | 0 | 0 | 0 |
 Bradley Thomas#34 | 3 | 1 | 0 | 0 | 0 | 0 | 0 |
 Stephen Johnson#56 | 3 | 0 | 0.5 | 0.5 | 0 | 0 | 0 |
 Christian Ross#17 | 3 | 0 | 0 | 0 | 0 | 0 | 0 |
 Camen Upshaw#32 | 2 | 2 | 0 | 0 | 0 | 0 | 0 |
 Mase Lewis#18 | 2 | 1 | 0 | 0 | 0 | 1 | 0 |
 Jayvon Henderson#2 | 2 | 1 | 0 | 0 | 1 | 0 | 0 |
 E'Mauri Smiley#90 | 2 | 0 | 0.5 | 0.5 | 1 | 0 | 0 |
 Deuce Vance#7 | 1 | 1 | 0 | 0 | 0 | 0 | 0 |
 Deon Callins#21 | 1 | 1 | 0 | 0 | 0 | 0 | 0 |
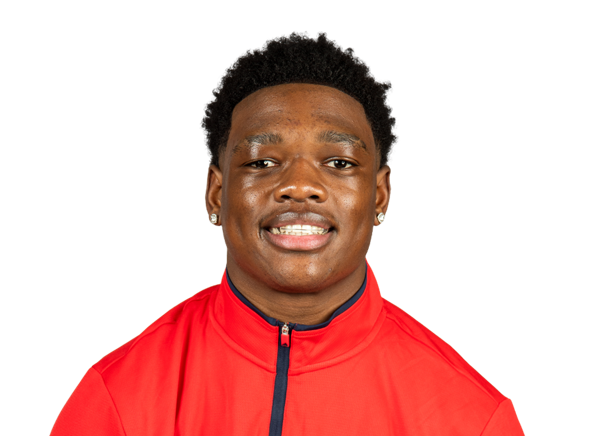 Xavious Anderson Jr.#26 | 1 | 1 | 0 | 0 | 0 | 0 | 0 |
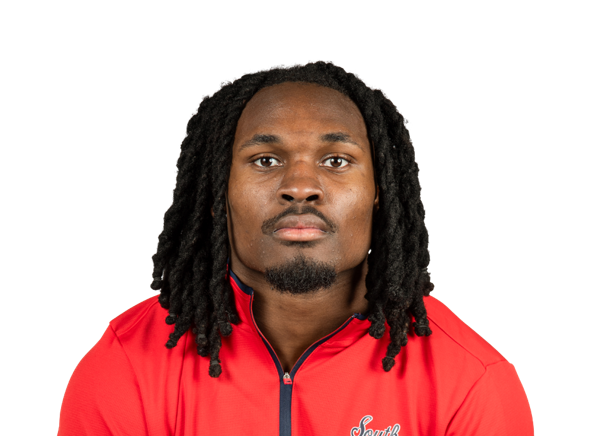 Dallas Young#8 | 1 | 0 | 0 | 0 | 0 | 0 | 0 |
 Tyler Carter#41 | 1 | 0 | 0 | 0 | 0 | 0 | 0 |
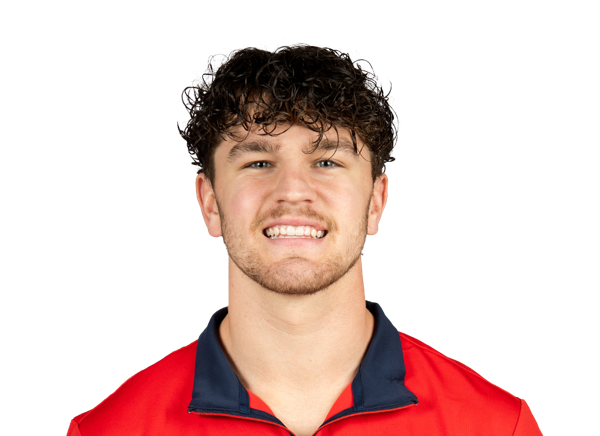 Baxter Turner#44 | 1 | 0 | 0 | 0 | 0 | 0 | 0 |
 Kaleb Jackson#29 | 1 | 0 | 0 | 0 | 0 | 0 | 0 |
 Matthew Laseter#35 | 1 | 0 | 0 | 0 | 0 | 0 | 0 |
 Colby Williams#15 | 1 | 0 | 0 | 0 | 0 | 0 | 0 |
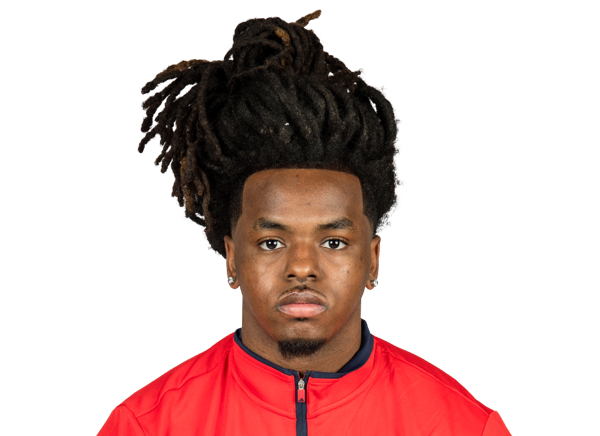 Zechariah Hall#27 | 1 | 0 | 0 | 0 | 0 | 0 | 0 |
 Cam McFarlin#34 | 1 | 0 | 0 | 0 | 0 | 0 | 0 |
Ohio| Player | FUM | LOST | REC |
|---|---|---|---|
| Matt Vezza#9 | 1 | 1 | 0 |
| Team | 1 | 0 | 0 |
South Alabama| Player | FUM | LOST | REC |
|---|---|---|---|
| Christian Ross#17 | 0 | 0 | 1 |
Ohio| Player | FG | PCT | LONG | XP | PTS |
|---|---|---|---|---|---|
 Will Hryszko#47 | 0/0 | 0.0 | 0 | 4/4 | 4 |
South Alabama| Player | FG | PCT | LONG | XP | PTS |
|---|---|---|---|---|---|
 Davis Little#35 | 2/2 | 100.0 | 32 | 5/5 | 11 |
Ohio| Player | NO | YDS | AVG | TB | In 20 | LONG |
|---|---|---|---|---|---|---|
 Magnus Haines#42 | 2 | 66 | 33.0 | 0 | 2 | 33 |
South Alabama| Player | NO | YDS | AVG | TB | In 20 | LONG |
|---|---|---|---|---|---|---|
 Aleksi Pulkkinen#40 | 3 | 86 | 28.7 | 0 | 1 | 40 |
Ohio| Player | NO | YDS | AVG | LONG | TD |
|---|---|---|---|---|---|
| Darren James-Hamilton#4 | 6 | 150 | 25.0 | 56 | 0 |
| Zach Hackleman#11 | 1 | 17 | 17.0 | 17 | 0 |
South Alabama| Player | NO | YDS | AVG | LONG | TD |
|---|---|---|---|---|---|
| Keenan Phillips#3 | 1 | 8 | 8.0 | 8 | 0 |
Ohio| Player | NO | YDS | AVG | LONG | TD |
|---|---|---|---|---|---|
| Darren James-Hamilton#4 | 1 | 7 | 7.0 | 7 | 0 |
South Alabama| Player | INT | YDS | TD |
|---|---|---|---|
 D.J. Moore#1 | 1 | 13 | 0 |
Drive Summary
USA
Touchdown
75
OHIO
Touchdown
78
USA
Touchdown
75
OHIO
Interception
14
USA
Touchdown
36
OHIO
Fumble
71
USA
Field Goal
66
OHIO
End of Half
7
OHIO
Touchdown
41
USA
Punt
8
OHIO
Touchdown
25
USA
Touchdown
75
OHIO
Punt
32
USA
Punt
10
OHIO
Punt
1
USA
Touchdown
81
OHIO
Touchdown
63
USA
Punt
5
OHIO
Downs
0
USA
Field Goal
7
OHIO
Touchdown
70
Injury Report
No current injury report is available for this matchup.
Head-to-Head
Historical meetings are not available for this matchup.
Game Information
StageWeek 3
Season2026
KickoffSat, Sep 19, 7:00 pm
VenueHancock Whitney Stadium
LocationMobile, AL
SurfaceGrass
BroadcastESPN+
Attendance15,232
Division Standings
FBS — Mid-American Conference
| Team | W | L | T | Pct | PF | PA | Home | Away | Strk |
|---|---|---|---|---|---|---|---|---|---|
 Eastern Michigan | 4 | 7 | 0 | 0.364 | 226 | 300 | 2-3 | 2-4 | L4 |
 Massachusetts | 5 | 6 | 0 | 0.455 | 276 | 257 | 3-3 | 2-3 | L2 |
 Central Michigan | 5 | 6 | 0 | 0.455 | 227 | 261 | 4-2 | 1-4 | L1 |
 Toledo | 8 | 2 | 0 | 0.800 | 343 | 220 | 5-1 | 3-1 | W4 |
 Western Michigan | 8 | 3 | 0 | 0.727 | 312 | 214 | 4-1 | 4-2 | W3 |
 Akron | 2 | 9 | 0 | 0.182 | 220 | 365 | 1-4 | 1-5 | W1 |
 Ball State | 3 | 8 | 0 | 0.273 | 241 | 376 | 2-2 | 1-6 | L3 |
 Buffalo | 8 | 3 | 0 | 0.727 | 283 | 262 | 5-1 | 3-2 | W6 |
 Kent State | 3 | 8 | 0 | 0.273 | 160 | 328 | 3-2 | 0-6 | L3 |
 Miami (OH) | 7 | 4 | 0 | 0.636 | 301 | 260 | 4-2 | 3-2 | W2 |
| Ohio | 8 | 3 | 0 | 0.727 | 317 | 257 | 5-0 | 3-3 | W1 |
 Bowling Green | 3 | 7 | 0 | 0.300 | 193 | 289 | 2-3 | 1-4 | W1 |
 Sacramento State | 2 | 9 | 0 | 0.182 | 177 | 321 | 2-4 | 0-5 | L2 |
Ohio
1st in MAC
VS
South Alabama
6th in Sun Belt
Quarterbacks & Specialists
#7
Levi Davis
#42
Magnus Haines
#9
Matt Vezza
Receivers & Backs
#2
Preston Bowman
#24
Irving Brown
#18
Miles Cremascoli
#3
Dom Dorwart
#11
Zach Hackleman
#86
Andrew Metzger
#84
AJ Miller
#15
Riley Neer
#85
Riley Palmeter
#4
Victor Rosa
#22
Mike Taylor Jr.
Defensive Line & Linebackers
#50
Owen DiFranco
Nehemiah Dukes
#27
Jack Fries
#9
Tyler Gillison
#57
Nathan Hale
#11
Evan Herrmann
#12
Jermaine Minnis
#25
Michael Molnar
#99
Ty Neubert
#98
Derek Reagans
#51
Isaiah Street
Defensive Backs
#20
Kendall Bannister
#8
Barry Dillon
#3
JT Haskins
#21
Ronald Jackson Jr.
#4
Darren James-Hamilton
#26
Tyson Long
#19
Bobby Miller
#13
DJ Morton
#2
DJ Walker
Other
#47
Will Hryszko
Quarterbacks & Specialists
#7
Jared Hollins
#40
Aleksi Pulkkinen
#44
Baxter Turner
Receivers & Backs
#21
Trae'von Dunbar
#1
Anthony Eager
#9
Rod Gibbs
#12
Brendan Jenkins
#2
Jeremiah Jones-Thomas
PJ Martin
#34
Cam McFarlin
#3
Keenan Phillips
#6
Micah Woods
Defensive Line & Linebackers
#26
Xavious Anderson Jr.
#49
Tre Brown
#41
Tyler Carter
#27
Zechariah Hall
#25
Tre'Mon Henry
#56
Stephen Johnson
#18
Masey Lewis
#17
Christian Ross
#11
Parker Shattuck
#90
E'Mauri Smiley
#48
Jordan Williams
Defensive Backs
#14
Cole Blaylock
#21
Deon Callins
#24
Damyrion Darby
#2
Jayvon Henderson
#29
Kaleb Jackson
#35
Matthew Laseter
#1
D.J. Moore
#12
Jaylen Moson
#34
Bradley Thomas
#32
Camen Upshaw
#7
Deuce Vance
#15
Colby Williams
#8
Dallas Young
Other
#35
Davis Little
Ohio
1st in MAC
VS
South Alabama
3rd in Sun Belt - West
Passing
61.2
Completion Percentage
57.0
164
Completions
147
1.90
Interception Percentage
1.90
5
Interceptions
5
78
Longest Pass
72
2,034
Net Passing Yards
1,977
184.9
Net Passing Yards Per Game
197.7
268
Passing Attempts
258
5.60
Passing Touchdown %
4.70
15
Passing Touchdowns
12
139.7
Passer Rating
133.2
20
Total Sacks
13
122
Sack Yards Lost
78
7.6
Yards Per Pass Attempt
7.7
2,034
Passing Yards
1,977
0
Passing Fumbles Lost
0
11
Team Games Played
10
369.6
Yards Per Game
408.7
28.8
Total Points Per Game
31.9
317
Total Points
319
40
Total Touchdowns
40
184.9
Passing Yards Per Game
197.7
164-268
Comp-Att
147-258
20-122
Sacks-Yards Lost
13-78
Rushing
415
Rushing Attempts
436
2,032
Rushing Yards
2,110
4.9
Yards Per Rush Attempt
4.8
91
Long Rushing
46
0
20+ Yard Rushing Plays
0
21
Rushing Touchdowns
25
184.7
Rushing Yards Per Game
211.0
0
Rushing Fumbles
0
0
Rushing Fumbles Lost
0
105
Rushing 1st downs
109
11
Team Games Played
10
4,066
Total Yards
4,087
703
Total Offensive Plays
707
28.8
Total Points Per Game
31.9
317
Total Points
319
40
Total Touchdowns
40
Receiving
164
Receptions
147
0
Receiving Targets
0
2,034
Receiving Yards
1,977
2,034
Receiving Yards
1,977
15
Receiving Touchdowns
12
78
Long Reception
72
0
20+ Yard Receiving Plays
0
184.9
Receiving Yards Per Game
197.7
0
Receiving Fumbles
0
0
Receiving Fumbles Lost
0
994
Receiving Yards After Catch
905
94
Receiving First Downs
85
11
Team Games Played
10
12.4
Yards Per Reception
13.4
28.8
Total Points Per Game
31.9
317
Total Points
319
40
Total Touchdowns
40
Miscellaneous
222
Total 1st downs
210
105
Rushing 1st downs
109
94
Passing 1st downs
85
23
1st downs by penalty
15
61
Third Down Conversions
57
139
Third Down Attempts
144
43.88
3rd down %
39.58
10
Fourth Down Conversions
21
17
First Downs Attempts
33
58.82
4th down %
63.64
57
Total Penalties
71
496
Total Penalty Yards
609
20351
Possession Time Seconds
19055
0.00
Red Zone Field Goal Percentage
0.00
0.00
Red Zone Scoring Percentage
0.00
0.00
Red Zone Efficiency Percentage
0.00
0.00
Red Zone Touchdown Percentage
0.00
13
Total Takeaways
13
14
Total Giveaways
7
-1
Turnover Ratio
6
0
Fumbles Lost
0
61-139
3rd down efficiency
57-144
10-17
4th down efficiency
21-33
57-496
Total-Yards
71-609
Defense
368
Solo Tackles
303
354
Assist Tackles
324
722
Total Tackles
627
21
Sacks
20
173
Sack Yards
126
85
Stuffs
67
43
Passes Defended
29
16.3
Average Interception Yards
22.7
45
Long Interception
72
0
Miscellaneous Touchdowns
0
2
Kicks Blocked
0
56
Tackles For Loss
30
11
Team Games Played
10
Defensive Interceptions
6
Interceptions
7
98
Interception Yards
159
2
Interception Touchdowns
1
6-98
INT: Total
7-159
General
17
Fumbles
11
7
Forced Fumbles
4
8
Fumbles Recovered
8
0
Fumbles Touchdowns
1
11
Games Played
10
17-0
Fumbles-Lost
11-0
Returning
23
Kick Returns
22
595
Kick Return Yards
561
25.9
Yards Per Kick Return
25.5
100
Long Kick Return
100
2
Kick Return Touchdowns
1
11
Punt Returns
4
76
Punt Return Yards
34
6.9
Yards Per Punt Return
8.5
17
Long Punt Return
14
0
Punt Return Touchdowns
0
0
Punt Return Fair Catches
0
0
Kick Return Fumbles Lost
0
0
Punt Return Fumbles Lost
0
11
Team Games Played
10
11-76
Punt: Total
4-34
Kicking
11
Field Goal Made
13
15
Field Goal Attempts
16
73.3
Field Goal Percentage
81.3
50
Long Field Goal Made
50
0
Field Goal Attempts 1-19
0
3
Field Goal Attempts 20-29
5
1
Field Goal Attempts 30-39
5
10
Field Goal Attempts 40-49
4
1
Field Goal Attempts 50+
2
38
Extra Points Made
36
38
Extra Point Attempts
38
100.0
Extra Point Percentage
94.7
0
Field Goals Made 1-19
0
3
Field Goals Made 20-29
5
1
Field Goals Made 30-39
4
6
Field Goals Made 40-49
3
1
Field Goals Made 50+
1
71
Total Kicking Points
75
11
Team Games Played
10
48
Touchback Percentage
10
0.0
Average Kickoff Return Yards
0.0
0
Kickoff Return Yards
0
0
Kickoff Returns
0
0-0
Kickoffs: Total
0-0
11-15
FG: Good-Attempts
13-16
Punting
39
Punts
34
1,691
Punt Yards
1,286
53
Long Punt
53
43.4
Gross Average Punt Yards
37.8
43.4
Net Average Punt Yards
37.8
0
Punts Blocked
0
12
Punts Inside 20
17
1
Touchbacks
0
15
Fair Catches
11
10
Punt Returns
8
0
Punt Return Yards
0
0.0
Average Punt Return Yards
0.0
11
Team Games Played
10
39-1,691
Punt: Total Yards
34-1,286
Scoring
21
Rushing Touchdowns
25
15
Receiving Touchdowns
12
2
Return Touchdowns
1
38
Total Touchdowns
39
11
Field Goals
13
38
Kick Extra Points
36
3
Total Two Point Conversions
1
317
Total Points
319
28.8
Total Points Per Game
31.9