

Oklahoma vs Georgia Live Score (26 Sep, 2026)
Score by Quarter
| Team | Q1 | Q2 | Q3 | Q4 | Final |
|---|---|---|---|---|---|
 Oklahoma |
0 | 0 | 6 | 7 | 13 |
 Georgia |
7 | 21 | 3 | 10 | 41 |
Scoring Plays
Q1
3:16
3:16
Chauncey Bowens 2 Yd Run (Peyton Woodring Kick)
Rushing Touchdown
0 – 7
Q2
14:20
14:20
Talyn Taylor 35 Yd pass from Gunner Stockton (Peyton Woodring Kick)
Passing Touchdown
0 – 14
Q2
8:58
8:58
Chris Cole 85 Yd Fumble Return (Peyton Woodring Kick)
Fumble Return Touchdown
0 – 21
Q2
0:57
0:57
Chauncey Bowens 6 Yd Run (Peyton Woodring Kick)
Rushing Touchdown
0 – 28
Q3
10:26
10:26
Rocky Beers 17 Yd pass from John Mateer (Two-Point Run Conversion Failed)
Passing Touchdown
6 – 28
Q3
7:58
7:58
Peyton Woodring 45 Yd Field Goal
Field Goal Good
6 – 31
Q4
12:33
12:33
Dwight Phillips Jr. 54 Yd Run (Peyton Woodring Kick)
Rushing Touchdown
6 – 38
Q4
8:13
8:13
Peyton Woodring 49 Yd Field Goal
Field Goal Good
6 – 41
Q4
3:23
3:23
Manny Choice 14 Yd pass from John Mateer (Tate Sandell Kick)
Passing Touchdown
13 – 41
Game Leaders
OklahomaGeorgia
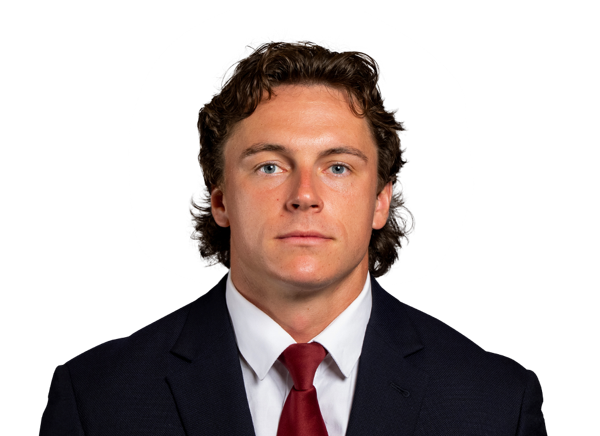 J. Mateer QB
Passing Yards
 G. Stockton QB
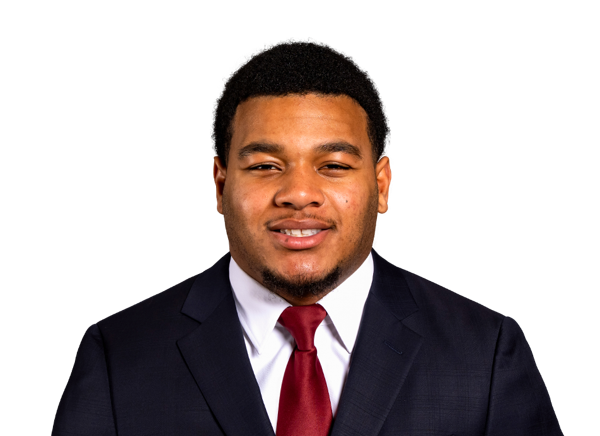 L. Avant RB
Rushing Yards
 D. Phillips Jr. RB
 R. Beers TE
Receiving Yards
 T. Taylor WR
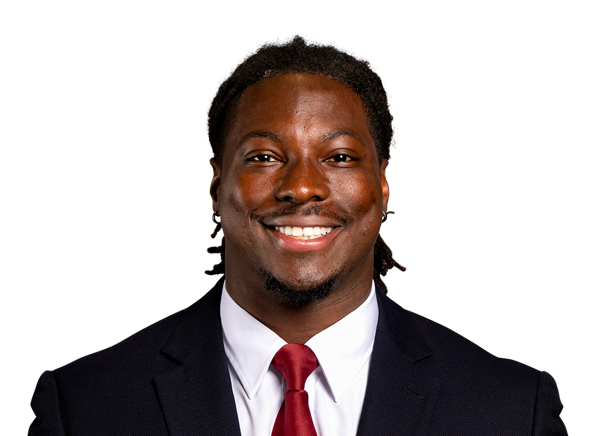 K. Lewis LB
Sacks
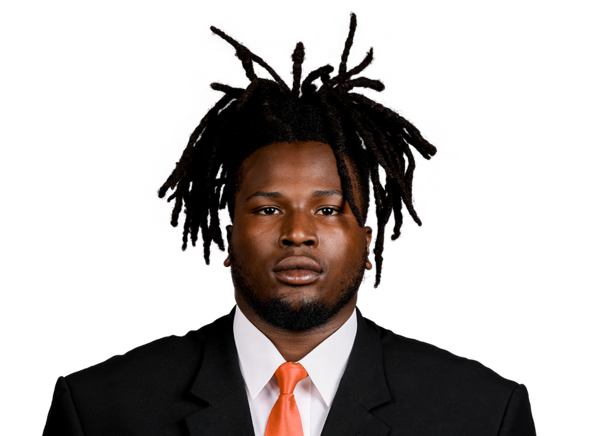 J. Horton DTK. Lewis LB
Tackles
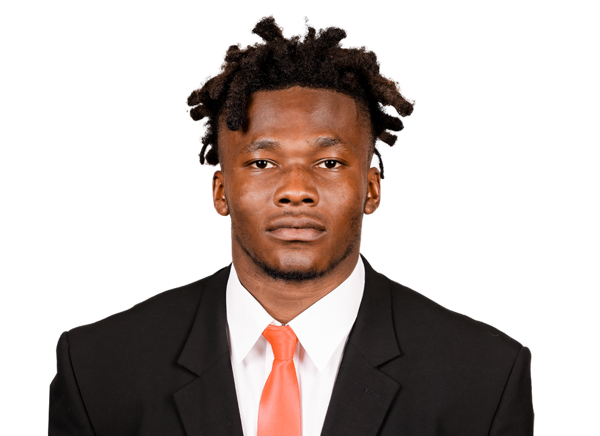 R. Wilson LB
Player Box Score
Oklahoma| Player | C/ATT | YDS | AVG | TD | INT | QBR |
|---|---|---|---|---|---|---|
| John Mateer#10 | 25/34 | 231 | 6.8 | 2 | 1 | 49.8 |
Georgia| Player | C/ATT | YDS | AVG | TD | INT | QBR |
|---|---|---|---|---|---|---|
| Gunner Stockton#14 | 14/25 | 171 | 6.8 | 1 | 1 | 67.7 |
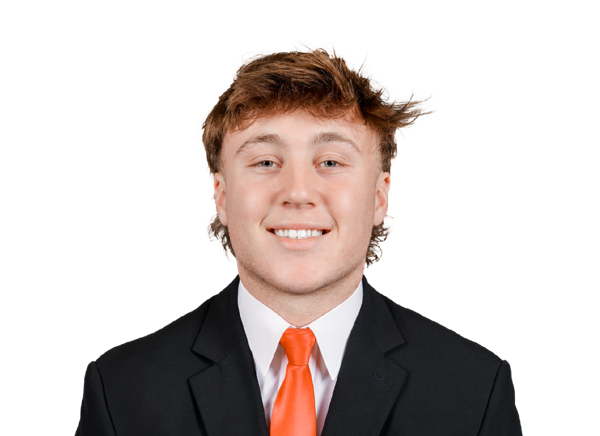 Ryan Puglisi#12 | 1/2 | 6 | 3.0 | 0 | 0 | -- |
Oklahoma| Player | CAR | YDS | AVG | TD | LONG |
|---|---|---|---|---|---|
| Lloyd Avant#9 | 10 | 23 | 2.3 | 0 | 5 |
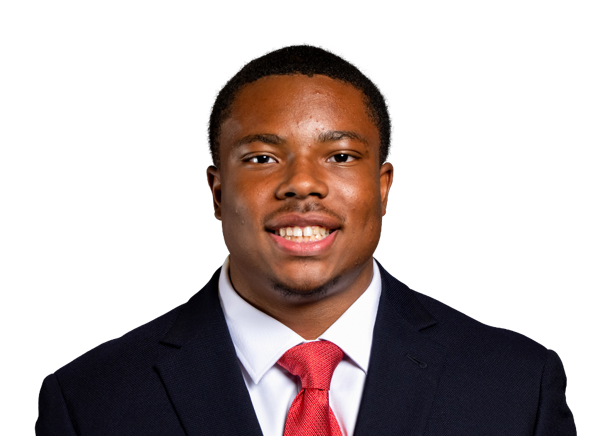 Jonathan Hatton Jr.#20 | 5 | 14 | 2.8 | 0 | 8 |
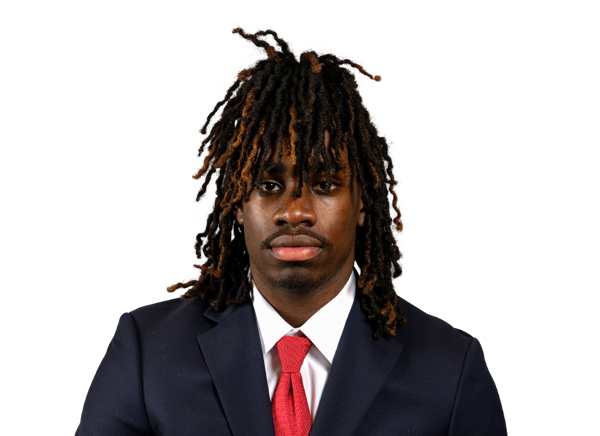 Tory Blaylock#6 | 3 | 10 | 3.3 | 0 | 5 |
| John Mateer#10 | 15 | 7 | 0.5 | 0 | 9 |
 Isaiah Sategna III#1 | 1 | 6 | 6.0 | 0 | 6 |
 Xavier Robinson#21 | 1 | 5 | 5.0 | 0 | 5 |
Georgia| Player | CAR | YDS | AVG | TD | LONG |
|---|---|---|---|---|---|
| Dwight Phillips Jr.#20 | 8 | 84 | 10.5 | 1 | 54 |
 Chauncey Bowens#5 | 9 | 26 | 2.9 | 2 | 7 |
 Bo Walker#24 | 3 | 11 | 3.7 | 0 | 5 |
 Jaden Reddell#23 | 1 | 8 | 8.0 | 0 | 8 |
| Gunner Stockton#14 | 5 | 0 | 0.0 | 0 | 5 |
Oklahoma| Player | REC | YDS | AVG | TD | LONG |
|---|---|---|---|---|---|
| Rocky Beers#81 | 8 | 84 | 10.5 | 1 | 17 |
| Isaiah Sategna III#1 | 8 | 81 | 10.1 | 0 | 37 |
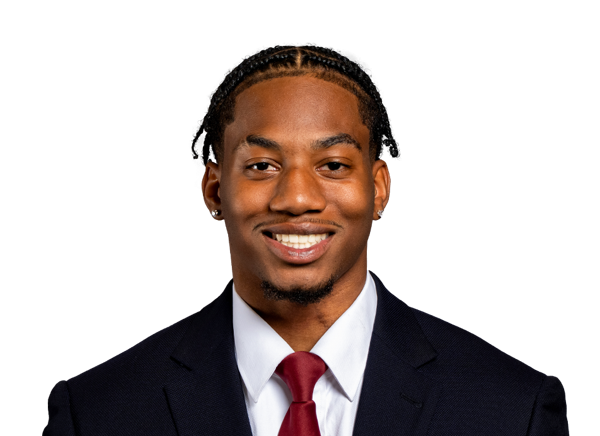 Mackenzie Alleyne#17 | 3 | 18 | 6.0 | 0 | 14 |
 Parker Livingstone#3 | 2 | 17 | 8.5 | 0 | 17 |
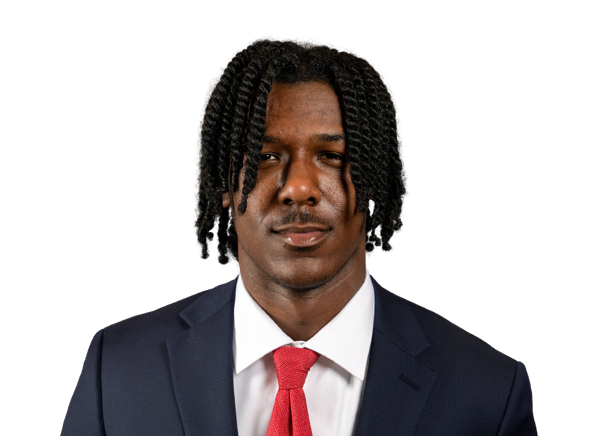 Manny Choice | 1 | 14 | 14.0 | 1 | 14 |
| Lloyd Avant#9 | 2 | 12 | 6.0 | 0 | 9 |
 Elijah Thomas#14 | 1 | 5 | 5.0 | 0 | 5 |
Georgia| Player | REC | YDS | AVG | TD | LONG |
|---|---|---|---|---|---|
| Talyn Taylor#1 | 4 | 110 | 27.5 | 1 | 41 |
| Chauncey Bowens#5 | 1 | 24 | 24.0 | 0 | 24 |
 London Humphreys#16 | 2 | 12 | 6.0 | 0 | 7 |
| Dwight Phillips Jr.#20 | 1 | 7 | 7.0 | 0 | 7 |
 Landon Roldan#8 | 1 | 6 | 6.0 | 0 | 6 |
 Lawson Luckie#7 | 1 | 5 | 5.0 | 0 | 5 |
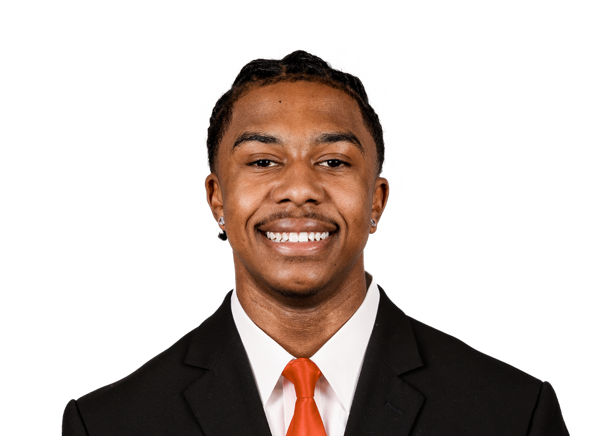 Craig Dandridge#81 | 1 | 5 | 5.0 | 0 | 5 |
 Sacovie White-Helton | 2 | 4 | 2.0 | 0 | 2 |
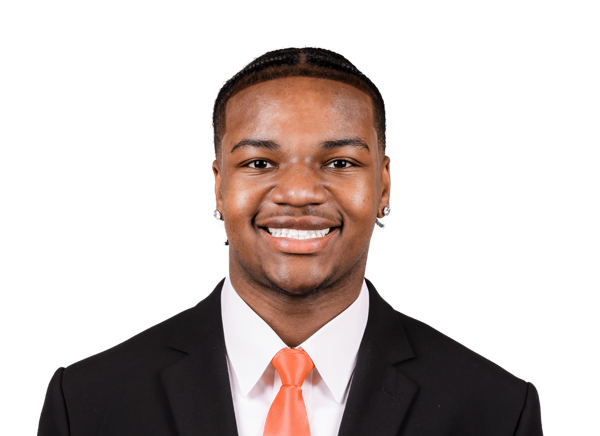 Ethan Barbour#9 | 1 | 3 | 3.0 | 0 | 3 |
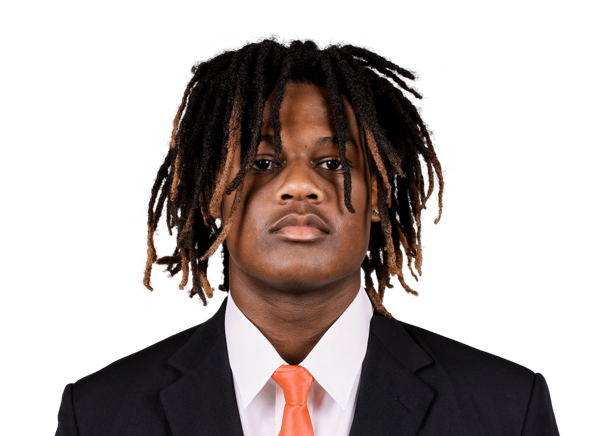 Elyiss Williams#10 | 1 | 1 | 1.0 | 0 | 1 |
Oklahoma| Player | TOT | SOLO | SACKS | TFL | PD | QB HUR | TD |
|---|---|---|---|---|---|---|---|
| Kip Lewis#10 | 5 | 4 | 0.5 | 0.5 | 1 | 0 | 0 |
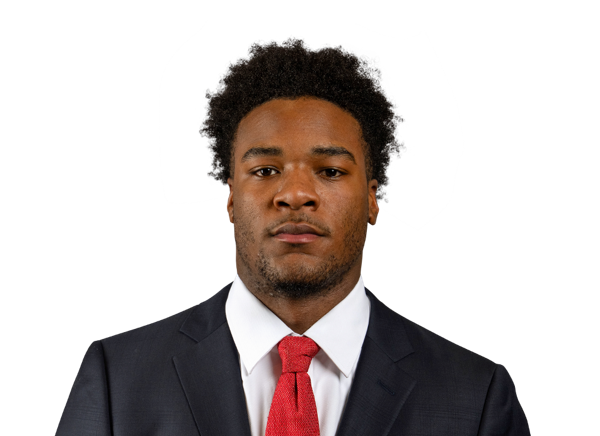 Omarion Robinson#2 | 5 | 2 | 0 | 0 | 0 | 0 | 0 |
 Eli Bowen#23 | 4 | 4 | 0 | 0 | 1 | 0 | 0 |
 James Nesta#47 | 4 | 2 | 0 | 0 | 0 | 0 | 0 |
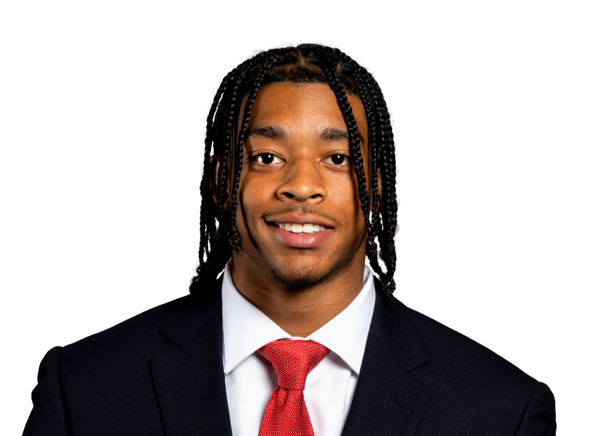 Courtland Guillory#4 | 3 | 3 | 0 | 0 | 0 | 0 | 0 |
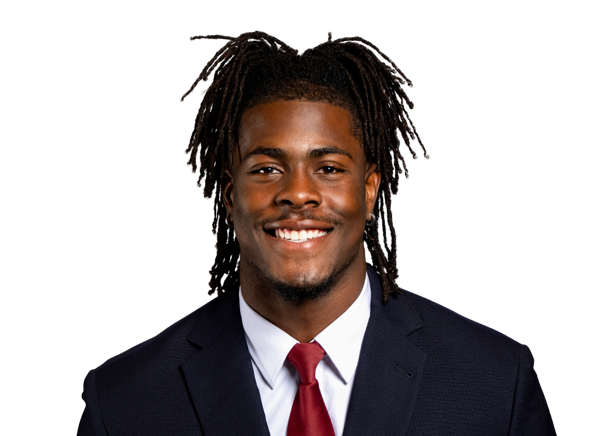 Danny Okoye#16 | 3 | 2 | 0 | 0 | 0 | 0 | 0 |
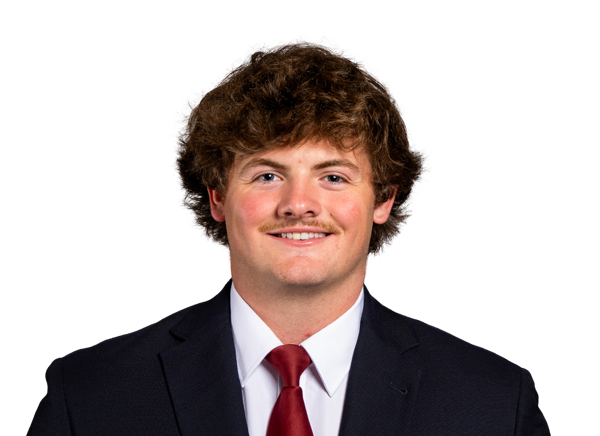 Wyatt Gilmore#42 | 3 | 2 | 0 | 0 | 0 | 0 | 0 |
 Peyton Bowen#22 | 3 | 1 | 0 | 0 | 0 | 0 | 0 |
 Adepoju Adebawore#34 | 3 | 1 | 0 | 0 | 0 | 0 | 0 |
 Owen Heinecke#38 | 3 | 1 | 0 | 0 | 0 | 0 | 0 |
 David Stone | 2 | 2 | 0 | 0 | 0 | 0 | 0 |
 Jacobe Johnson#24 | 2 | 0 | 0 | 0 | 0 | 0 | 0 |
 Hayden Hansen#89 | 1 | 1 | 0 | 0 | 0 | 0 | 0 |
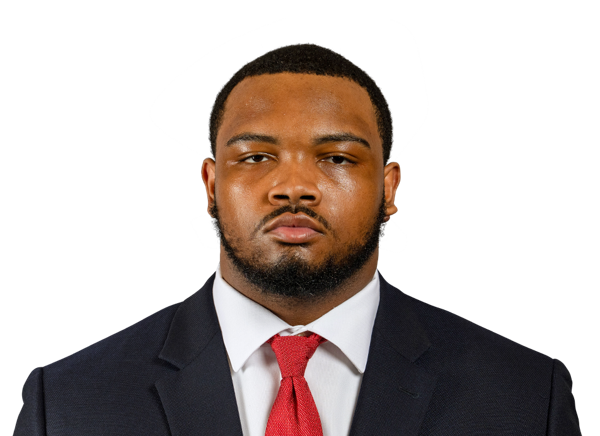 Trent Wilson#90 | 1 | 1 | 0 | 1 | 0 | 0 | 0 |
 Reggie Powers III#3 | 1 | 1 | 0 | 0 | 1 | 0 | 0 |
 James Carrington#58 | 1 | 1 | 0 | 0 | 0 | 0 | 0 |
 Jake Kreul#98 | 1 | 1 | 0 | 0 | 0 | 0 | 0 |
 Dane Bathurst#30 | 1 | 1 | 0 | 0 | 0 | 0 | 0 |
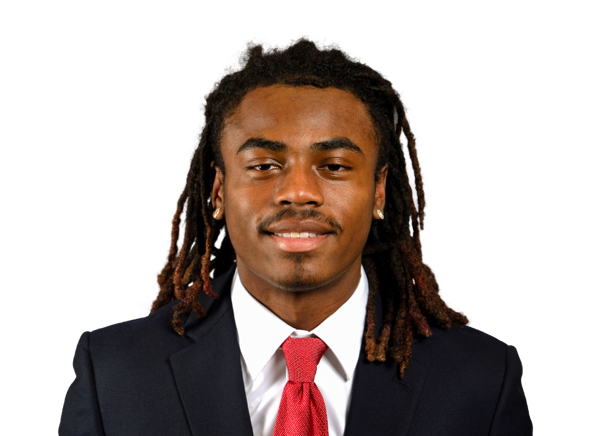 Trystan Haynes#14 | 1 | 1 | 0 | 0 | 0 | 0 | 0 |
 Bishop Thomas#8 | 1 | 0 | 0 | 0 | 1 | 0 | 0 |
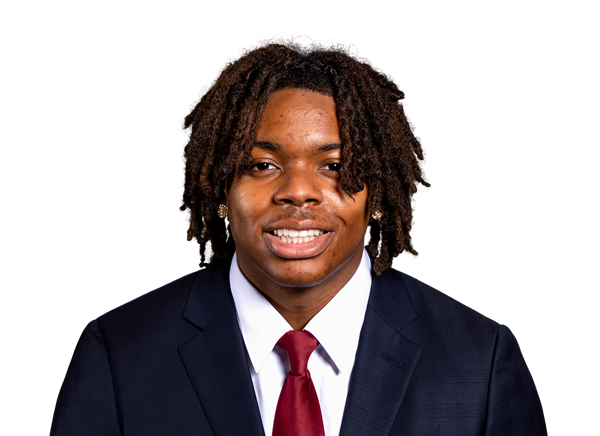 Dakoda Fields#9 | 1 | 0 | 0 | 0 | 0 | 0 | 0 |
 Jayden Jackson#65 | 1 | 0 | 0.5 | 0.5 | 0 | 0 | 0 |
| Elijah Thomas#14 | 1 | 0 | 0 | 0 | 0 | 0 | 0 |
Georgia| Player | TOT | SOLO | SACKS | TFL | PD | QB HUR | TD |
|---|---|---|---|---|---|---|---|
| Raylen Wilson#5 | 11 | 8 | 1 | 1.5 | 0 | 0 | 0 |
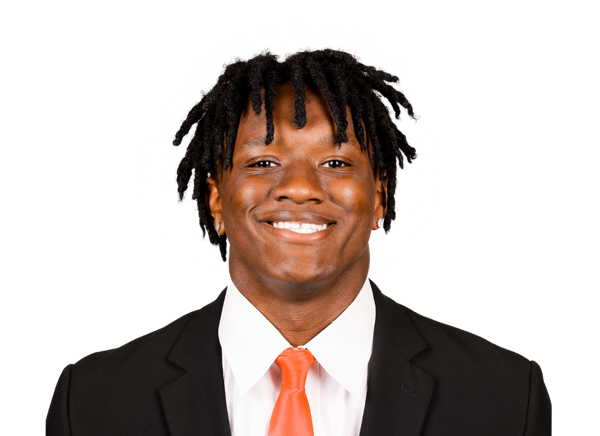 Chris Cole#9 | 8 | 7 | 1 | 1 | 0 | 0 | 1 |
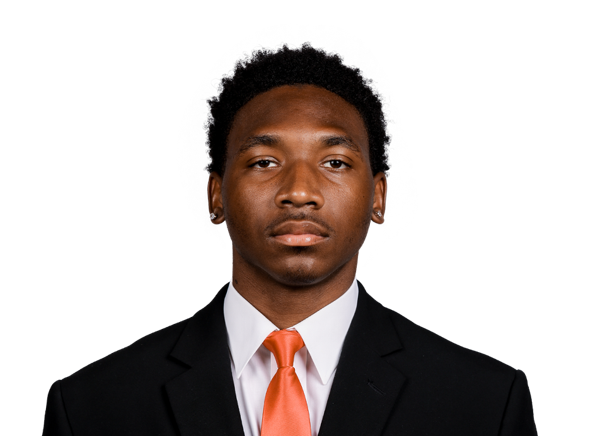 Rasean Dinkins#14 | 4 | 3 | 0 | 0 | 0 | 0 | 0 |
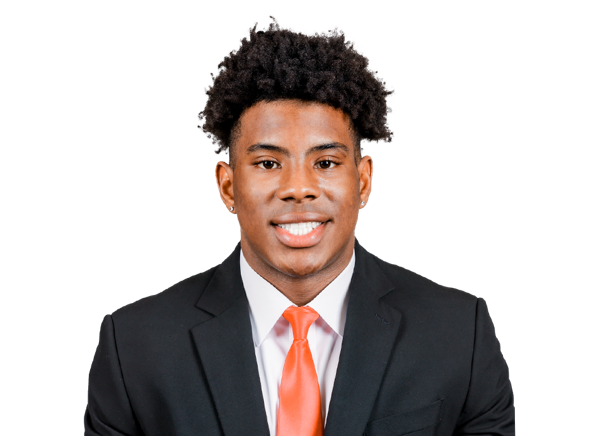 Justin Williams#19 | 4 | 2 | 0 | 0 | 0 | 0 | 0 |
 Quintavius Johnson#3 | 4 | 2 | 0 | 0 | 0 | 0 | 0 |
 AJ Kruah#13 | 3 | 3 | 0 | 0 | 0 | 0 | 0 |
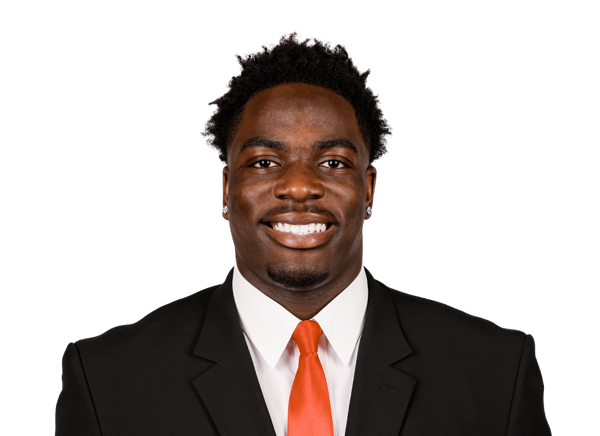 Valdin Sone#52 | 3 | 3 | 0 | 0 | 0 | 0 | 0 |
 Braylon Conley#24 | 3 | 2 | 0 | 0 | 0 | 0 | 0 |
| Josh Horton#81 | 2 | 2 | 1 | 1 | 0 | 0 | 0 |
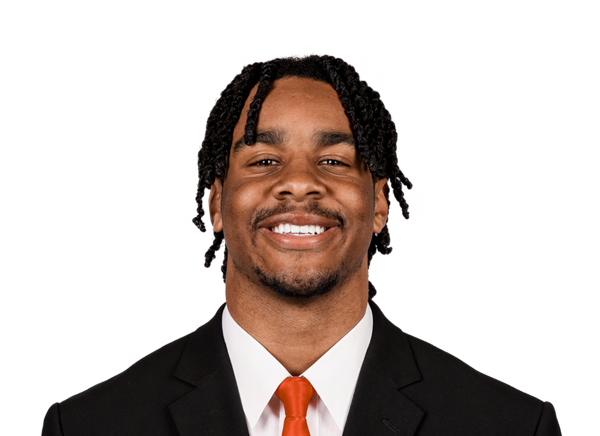 Khalil Barnes#7 | 2 | 2 | 0 | 0 | 1 | 0 | 0 |
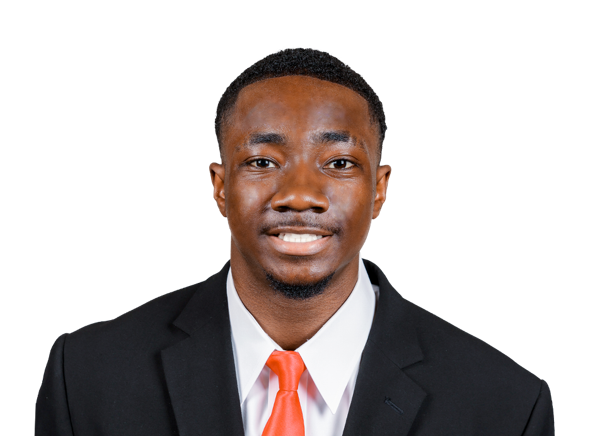 Ellis Robinson IV#1 | 2 | 2 | 0 | 0 | 0 | 0 | 0 |
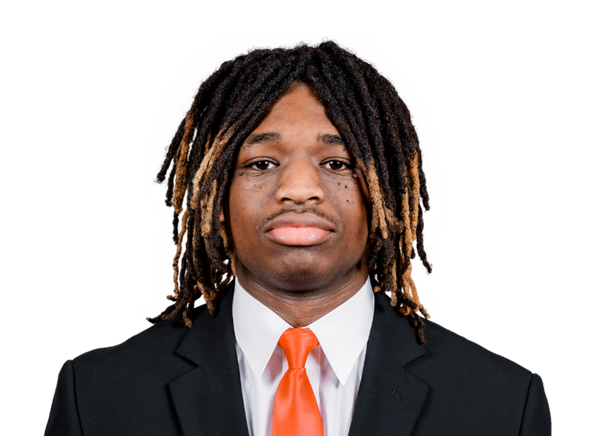 Demello Jones#8 | 2 | 2 | 0 | 0 | 0 | 0 | 0 |
 Joseph Jonah-Ajonye#99 | 2 | 1 | 0 | 0 | 0 | 0 | 0 |
 Elijah Griffin#90 | 2 | 1 | 0 | 0 | 0 | 0 | 0 |
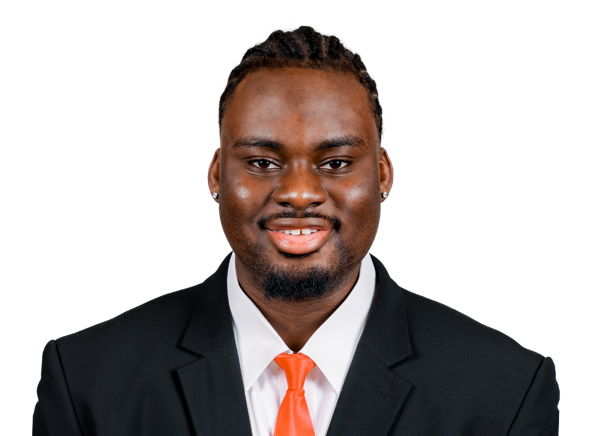 Nnamdi Ogboko#95 | 2 | 1 | 0 | 0.5 | 0 | 0 | 0 |
 Zion Branch#2 | 1 | 1 | 0 | 0 | 0 | 0 | 0 |
 Gentry Williams#26 | 1 | 1 | 0 | 0 | 0 | 0 | 0 |
 Gabe Harris Jr. | 1 | 1 | 0 | 0 | 0 | 0 | 0 |
 Jordan Hall#44 | 1 | 1 | 0 | 1 | 0 | 0 | 0 |
 Justin Greene#91 | 1 | 1 | 0 | 0 | 0 | 0 | 0 |
 Zech Fort#20 | 1 | 1 | 0 | 0 | 0 | 0 | 0 |
 JJ Hanne#96 | 1 | 1 | 0 | 0 | 0 | 0 | 0 |
 KJ Bolden#4 | 1 | 0 | 0 | 0 | 0 | 0 | 0 |
 Kyron Jones#31 | 1 | 0 | 0 | 0 | 0 | 0 | 0 |
 Zayden Walker#10 | 1 | 0 | 0 | 0 | 0 | 0 | 0 |
 Khamari Brooks#15 | 1 | 0 | 0 | 0 | 0 | 0 | 0 |
 Anthony Lonon Jr.#38 | 1 | 0 | 0 | 0 | 0 | 0 | 0 |
 Blake Stewart#27 | 0 | 0 | 0 | 0 | 1 | 0 | 0 |
Oklahoma| Player | FUM | LOST | REC |
|---|---|---|---|
| John Mateer#10 | 2 | 2 | 0 |
| Rocky Beers#81 | 1 | 1 | 0 |
| Bishop Thomas#8 | 0 | 0 | 1 |
Georgia| Player | FUM | LOST | REC |
|---|---|---|---|
| Chauncey Bowens#5 | 1 | 1 | 0 |
| Rasean Dinkins#14 | 0 | 0 | 1 |
| Chris Cole#9 | 0 | 0 | 2 |
Oklahoma| Player | FG | PCT | LONG | XP | PTS |
|---|---|---|---|---|---|
 Tate Sandell#29 | 0/1 | 0.0 | 0 | 1/1 | 1 |
Georgia| Player | FG | PCT | LONG | XP | PTS |
|---|---|---|---|---|---|
 Peyton Woodring#91 | 2/2 | 100.0 | 49 | 5/5 | 11 |
Oklahoma| Player | NO | YDS | AVG | TB | In 20 | LONG |
|---|---|---|---|---|---|---|
 Jacob Ulrich#87 | 6 | 293 | 48.8 | 0 | 1 | 56 |
Georgia| Player | NO | YDS | AVG | TB | In 20 | LONG |
|---|---|---|---|---|---|---|
 Drew Miller#90 | 5 | 250 | 50.0 | 2 | 3 | 56 |
Oklahoma| Player | NO | YDS | AVG | LONG | TD |
|---|---|---|---|---|---|
| Isaiah Sategna III#1 | 2 | 49 | 24.5 | 28 | 0 |
Oklahoma| Player | NO | YDS | AVG | LONG | TD |
|---|---|---|---|---|---|
| Isaiah Sategna III#1 | 1 | 0 | 0.0 | 0 | 0 |
Georgia| Player | NO | YDS | AVG | LONG | TD |
|---|---|---|---|---|---|
| Sacovie White-Helton | 3 | 20 | 6.7 | 13 | 0 |
Oklahoma| Player | INT | YDS | TD |
|---|---|---|---|
| Omarion Robinson#2 | 1 | 0 | 0 |
Georgia| Player | INT | YDS | TD |
|---|---|---|---|
| KJ Bolden#4 | 1 | 29 | 0 |
Drive Summary
UGA
Punt
9
OU
Punt
13
UGA
Touchdown
79
OU
Punt
-5
UGA
Touchdown
54
OU
Fumble Return Touchdown
60
OU
Interception
32
UGA
Punt
3
OU
Fumble
14
UGA
Touchdown
11
OU
End of Half
16
OU
Punt
1
UGA
Interception
1
OU
Touchdown
35
UGA
Punt
19
OU
Fumble
8
UGA
Field Goal
1
OU
Punt
4
UGA
Fumble
11
OU
Missed FG
1
UGA
Punt
5
OU
Punt
22
UGA
Touchdown
81
OU
Punt
2
UGA
Field Goal
36
OU
Touchdown
75
UGA
Punt
6
OU
Downs
9
UGA
End of Game
6
Injury Report
No current injury report is available for this matchup.
Head-to-Head
Historical meetings are not available for this matchup.
Game Information
StageWeek 4
Season2026
KickoffSat, Sep 26, 3:30 pm
VenueSanford Stadium
LocationAthens, GA
SurfaceGrass
BroadcastESPN, Disney+
Attendance93,033
Division Standings
FBS — Southeastern Conference
| Team | W | L | T | Pct | PF | PA | Home | Away | Strk |
|---|---|---|---|---|---|---|---|---|---|
 Alabama | 8 | 2 | 0 | 0.800 | 358 | 189 | 4-1 | 4-1 | W3 |
 Florida | 6 | 4 | 0 | 0.600 | 313 | 262 | 3-2 | 3-2 | W1 |
| Georgia | 9 | 1 | 0 | 0.900 | 418 | 147 | 6-1 | 3-0 | W3 |
 Mississippi State | 4 | 6 | 0 | 0.400 | 245 | 291 | 2-4 | 2-2 | L6 |
 Texas | 8 | 2 | 0 | 0.800 | 302 | 178 | 5-1 | 3-1 | W4 |
 Ole Miss | 6 | 3 | 0 | 0.667 | 304 | 234 | 5-1 | 1-2 | L1 |
 Auburn | 6 | 4 | 0 | 0.600 | 260 | 246 | 4-2 | 2-2 | W2 |
 Kentucky | 7 | 3 | 0 | 0.700 | 283 | 253 | 4-2 | 3-1 | L2 |
 LSU | 6 | 4 | 0 | 0.600 | 355 | 181 | 5-2 | 1-2 | L2 |
 Missouri | 6 | 4 | 0 | 0.600 | 293 | 229 | 4-1 | 2-3 | L2 |
 Tennessee | 8 | 2 | 0 | 0.800 | 314 | 143 | 5-1 | 3-1 | W2 |
 Vanderbilt | 4 | 6 | 0 | 0.400 | 213 | 286 | 3-3 | 1-3 | L1 |
 Arkansas | 4 | 6 | 0 | 0.400 | 214 | 253 | 3-3 | 1-3 | W1 |
| Oklahoma | 5 | 4 | 0 | 0.556 | 199 | 173 | 3-2 | 2-2 | W1 |
 South Carolina | 6 | 4 | 0 | 0.600 | 318 | 245 | 4-2 | 2-2 | L1 |
 Texas A&M | 4 | 6 | 0 | 0.400 | 242 | 190 | 4-2 | 0-4 | L3 |
Oklahoma
6th in SEC
VS
Georgia
1st in SEC
Quarterbacks & Specialists
#10
John Mateer
#87
Jacob Ulrich
Receivers & Backs
#17
Mackenzie Alleyne
#9
Lloyd Avant
#81
Rocky Beers
#6
Tory Blaylock
Manny Choice
#89
Hayden Hansen
#20
Jonathan Hatton Jr.
#3
Parker Livingstone
#21
Xavier Robinson
#1
Isaiah Sategna III
#14
Elijah Thomas
Defensive Line & Linebackers
#34
Adepoju Adebawore
#30
Dane Bathurst
#58
James Carrington
#42
Wyatt Gilmore
#38
Owen Heinecke
#65
Jayden Jackson
#98
Jake Kreul
#10
Kip Lewis
#47
James Nesta
#16
Danny Okoye
David Stone
#8
Bishop Thomas
#90
Trent Wilson
Defensive Backs
#23
Eli Bowen
#22
Peyton Bowen
#9
Dakoda Fields
#4
Courtland Guillory
#14
Trystan Haynes
#24
Jacobe Johnson
#3
Reggie Powers III
#2
Omarion Robinson
Other
#29
Tate Sandell
Quarterbacks & Specialists
#90
Drew Miller
#12
Ryan Puglisi
#14
Gunner Stockton
Receivers & Backs
#9
Ethan Barbour
#5
Chauncey Bowens
#81
Craig Dandridge
#16
London Humphreys
#7
Lawson Luckie
#20
Dwight Phillips Jr.
#23
Jaden Reddell
#8
Landon Roldan
#1
Talyn Taylor
#24
Bo Walker
Sacovie White-Helton
#10
Elyiss Williams
Defensive Line & Linebackers
#15
Khamari Brooks
#9
Chris Cole
#91
Justin Greene
#90
Elijah Griffin
#44
Jordan Hall
#96
JJ Hanne
Gabe Harris Jr.
#81
Josh Horton
#3
Quintavius Johnson
#99
Joseph Jonah-Ajonye
#13
AJ Kruah
#38
Anthony Lonon Jr.
#95
Nnamdi Ogboko
#52
Valdin Sone
#10
Zayden Walker
#19
Justin Williams
#5
Raylen Wilson
Defensive Backs
#7
Khalil Barnes
#4
KJ Bolden
#2
Zion Branch
#24
Braylon Conley
#14
Rasean Dinkins
#20
Zech Fort
#8
Demello Jones
#31
Kyron Jones
#1
Ellis Robinson IV
#27
Blake Stewart
#26
Gentry Williams
Other
#91
Peyton Woodring
Oklahoma
6th in SEC
VS
Georgia
1st in SEC
Passing
64.0
Completion Percentage
70.1
194
Completions
183
2.60
Interception Percentage
1.50
8
Interceptions
4
54
Longest Pass
70
2,159
Net Passing Yards
2,478
215.9
Net Passing Yards Per Game
247.8
303
Passing Attempts
261
5.00
Passing Touchdown %
9.20
15
Passing Touchdowns
24
134.8
Passer Rating
177.2
25
Total Sacks
11
129
Sack Yards Lost
69
7.1
Yards Per Pass Attempt
9.5
2,159
Passing Yards
2,478
0
Passing Fumbles Lost
0
10
Team Games Played
10
334.5
Yards Per Game
455.6
22.3
Total Points Per Game
41.8
223
Total Points
418
25
Total Touchdowns
55
215.9
Passing Yards Per Game
247.8
194-303
Comp-Att
183-261
25-129
Sacks-Yards Lost
11-69
Rushing
358
Rushing Attempts
355
1,186
Rushing Yards
2,078
3.3
Yards Per Rush Attempt
5.9
47
Long Rushing
70
0
20+ Yard Rushing Plays
0
5
Rushing Touchdowns
27
118.6
Rushing Yards Per Game
207.8
0
Rushing Fumbles
0
0
Rushing Fumbles Lost
0
69
Rushing 1st downs
97
10
Team Games Played
10
3,345
Total Yards
4,556
686
Total Offensive Plays
627
22.3
Total Points Per Game
41.8
223
Total Points
418
25
Total Touchdowns
55
Receiving
194
Receptions
183
0
Receiving Targets
0
2,159
Receiving Yards
2,478
2,159
Receiving Yards
2,478
15
Receiving Touchdowns
24
54
Long Reception
70
0
20+ Yard Receiving Plays
0
215.9
Receiving Yards Per Game
247.8
0
Receiving Fumbles
0
0
Receiving Fumbles Lost
0
1068
Receiving Yards After Catch
1402
94
Receiving First Downs
105
10
Team Games Played
10
11.1
Yards Per Reception
13.5
22.3
Total Points Per Game
41.8
223
Total Points
418
25
Total Touchdowns
55
Miscellaneous
183
Total 1st downs
220
69
Rushing 1st downs
97
94
Passing 1st downs
105
20
1st downs by penalty
17
61
Third Down Conversions
58
150
Third Down Attempts
112
40.67
3rd down %
51.79
6
Fourth Down Conversions
4
12
First Downs Attempts
6
50.00
4th down %
66.67
68
Total Penalties
47
565
Total Penalty Yards
443
18832
Possession Time Seconds
18524
0.00
Red Zone Field Goal Percentage
0.00
0.00
Red Zone Scoring Percentage
0.00
0.00
Red Zone Efficiency Percentage
0.00
0.00
Red Zone Touchdown Percentage
0.00
13
Total Takeaways
16
15
Total Giveaways
10
-2
Turnover Ratio
6
0
Fumbles Lost
0
61-150
3rd down efficiency
58-112
6-12
4th down efficiency
4-6
68-565
Total-Yards
47-443
Defense
298
Solo Tackles
377
344
Assist Tackles
208
642
Total Tackles
585
28
Sacks
31
164
Sack Yards
207
85
Stuffs
84
27
Passes Defended
39
12.1
Average Interception Yards
20.7
42
Long Interception
43
0
Miscellaneous Touchdowns
0
1
Kicks Blocked
2
45
Tackles For Loss
58
10
Team Games Played
10
Defensive Interceptions
9
Interceptions
9
109
Interception Yards
186
2
Interception Touchdowns
1
9-109
INT: Total
9-186
General
9
Fumbles
16
5
Forced Fumbles
10
5
Fumbles Recovered
12
0
Fumbles Touchdowns
2
10
Games Played
10
9-0
Fumbles-Lost
16-0
Returning
7
Kick Returns
8
149
Kick Return Yards
249
21.3
Yards Per Kick Return
31.1
28
Long Kick Return
91
0
Kick Return Touchdowns
1
15
Punt Returns
23
239
Punt Return Yards
194
15.9
Yards Per Punt Return
8.4
88
Long Punt Return
35
3
Punt Return Touchdowns
0
0
Punt Return Fair Catches
0
0
Kick Return Fumbles Lost
0
0
Punt Return Fumbles Lost
0
10
Team Games Played
10
15-239
Punt: Total
23-194
Kicking
17
Field Goal Made
11
25
Field Goal Attempts
15
68.0
Field Goal Percentage
73.3
53
Long Field Goal Made
49
0
Field Goal Attempts 1-19
0
1
Field Goal Attempts 20-29
3
9
Field Goal Attempts 30-39
3
10
Field Goal Attempts 40-49
8
5
Field Goal Attempts 50+
1
22
Extra Points Made
55
22
Extra Point Attempts
55
100.0
Extra Point Percentage
100.0
0
Field Goals Made 1-19
0
1
Field Goals Made 20-29
3
8
Field Goals Made 30-39
2
6
Field Goals Made 40-49
6
2
Field Goals Made 50+
0
73
Total Kicking Points
88
10
Team Games Played
10
74
Touchback Percentage
64
0.0
Average Kickoff Return Yards
0.0
0
Kickoff Return Yards
0
0
Kickoff Returns
0
0-0
Kickoffs: Total
0-0
17-25
FG: Good-Attempts
11-15
Punting
43
Punts
28
1,893
Punt Yards
1,285
62
Long Punt
65
44.0
Gross Average Punt Yards
45.9
44.0
Net Average Punt Yards
45.9
0
Punts Blocked
0
14
Punts Inside 20
10
1
Touchbacks
6
19
Fair Catches
9
18
Punt Returns
6
0
Punt Return Yards
0
0.0
Average Punt Return Yards
0.0
10
Team Games Played
10
43-1,893
Punt: Total Yards
28-1,285
Scoring
5
Rushing Touchdowns
27
15
Receiving Touchdowns
24
3
Return Touchdowns
1
23
Total Touchdowns
54
17
Field Goals
11
22
Kick Extra Points
55
0
Total Two Point Conversions
0
223
Total Points
418
22.3
Total Points Per Game
41.8