

Oklahoma vs Michigan Live Score (12 Sep, 2026)
Score by Quarter
| Team | Q1 | Q2 | Q3 | Q4 | Final |
|---|---|---|---|---|---|
 Oklahoma |
0 | 0 | 7 | 3 | 10 |
 Michigan |
7 | 3 | 0 | 7 | 17 |
Scoring Plays
Q1
0:47
0:47
Bryce Underwood 38 Yd Run (Trey Butkowski Kick)
Rushing Touchdown
0 – 7
Q2
2:28
2:28
Trey Butkowski 40 Yd Field Goal
Field Goal Good
0 – 10
Q3
8:30
8:30
Mackenzie Alleyne 22 Yd pass from John Mateer (Tate Sandell Kick)
Passing Touchdown
7 – 10
Q4
11:49
11:49
Tate Sandell 34 Yd Field Goal
Field Goal Good
10 – 10
Q4
7:53
7:53
Jordan Marshall 1 Yd Run (Trey Butkowski Kick)
Rushing Touchdown
10 – 17
Game Leaders
OklahomaMichigan
 J. Mateer QB
Passing Yards
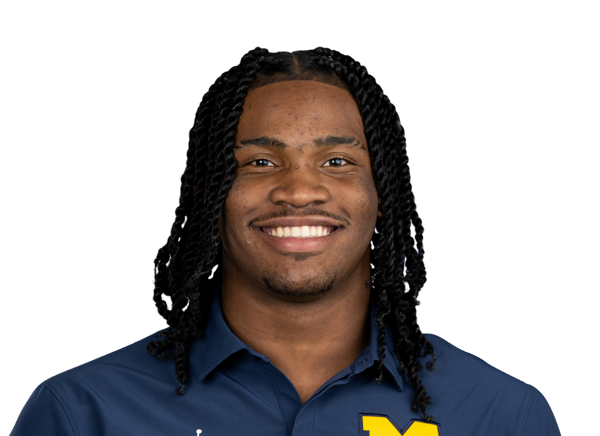 B. Underwood QBJ. Mateer QB
Rushing Yards
B. Underwood QB R. Beers TE
Receiving Yards
 J. Buchanan WR
 O. Heinecke LB
Sacks
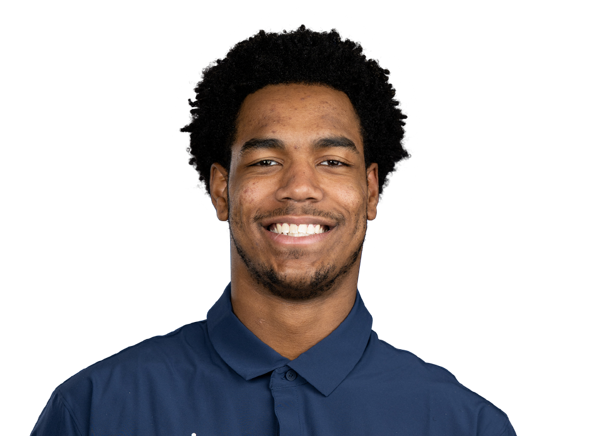 N. Marshall DEO. Heinecke LB
Tackles
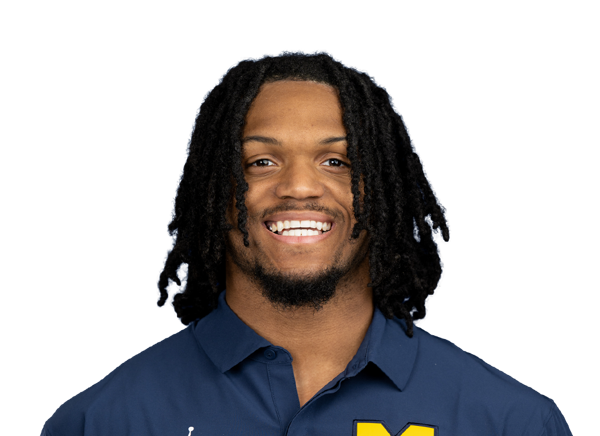 T. Bowles LB
Player Box Score
Oklahoma| Player | C/ATT | YDS | AVG | TD | INT | QBR |
|---|---|---|---|---|---|---|
| John Mateer#10 | 17/33 | 189 | 5.7 | 1 | 1 | 61.1 |
Michigan| Player | C/ATT | YDS | AVG | TD | INT | QBR |
|---|---|---|---|---|---|---|
| Bryce Underwood#19 | 9/17 | 111 | 6.5 | 0 | 0 | 74.4 |
Oklahoma| Player | CAR | YDS | AVG | TD | LONG |
|---|---|---|---|---|---|
| John Mateer#10 | 13 | 45 | 3.5 | 0 | 22 |
 Lloyd Avant#9 | 9 | 35 | 3.9 | 0 | 11 |
 Isaiah Sategna III#1 | 3 | 11 | 3.7 | 0 | 7 |
 Xavier Robinson#21 | 3 | 6 | 2.0 | 0 | 4 |
 Tory Blaylock#6 | 1 | 3 | 3.0 | 0 | 3 |
Michigan| Player | CAR | YDS | AVG | TD | LONG |
|---|---|---|---|---|---|
| Bryce Underwood#19 | 18 | 87 | 4.8 | 1 | 38 |
 Jordan Marshall#23 | 11 | 32 | 2.9 | 1 | 8 |
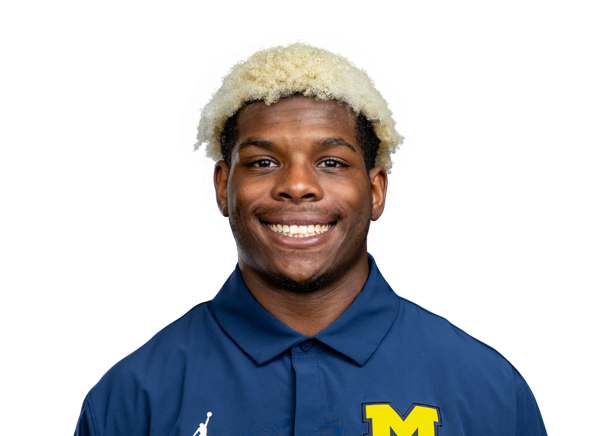 Andrew Marsh#3 | 1 | 15 | 15.0 | 0 | 15 |
 Bryson Kuzdzal#24 | 3 | 12 | 4.0 | 0 | 7 |
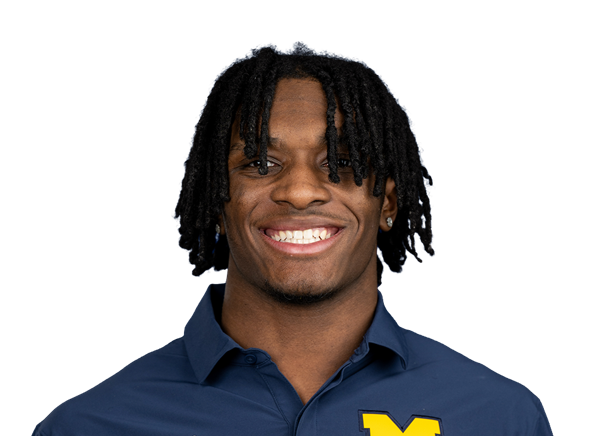 Savion Hiter#5 | 8 | 6 | 0.8 | 0 | 5 |
Oklahoma| Player | REC | YDS | AVG | TD | LONG |
|---|---|---|---|---|---|
| Rocky Beers#81 | 6 | 94 | 15.7 | 0 | 43 |
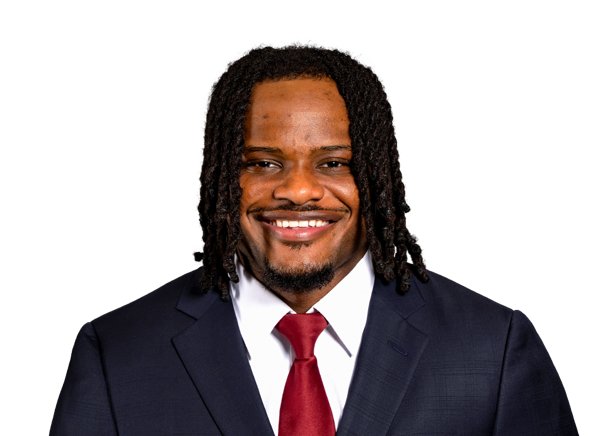 Trell Harris#11 | 4 | 43 | 10.8 | 0 | 17 |
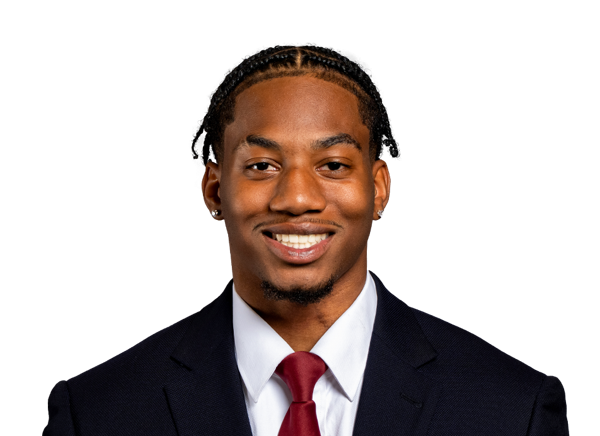 Mackenzie Alleyne#17 | 1 | 22 | 22.0 | 1 | 22 |
| Lloyd Avant#9 | 3 | 13 | 4.3 | 0 | 7 |
| Isaiah Sategna III#1 | 2 | 9 | 4.5 | 0 | 6 |
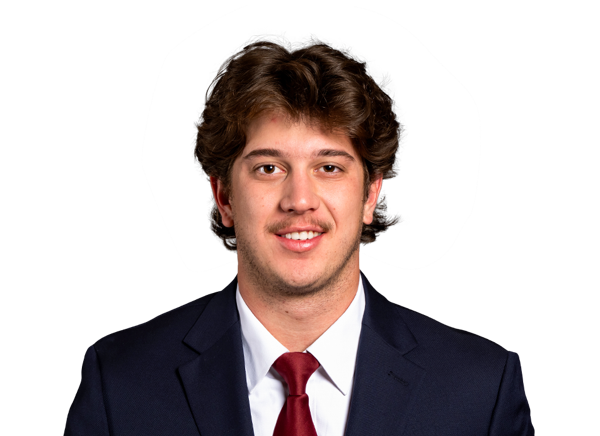 Parker Livingstone#3 | 1 | 8 | 8.0 | 0 | 8 |
Michigan| Player | REC | YDS | AVG | TD | LONG |
|---|---|---|---|---|---|
| JJ Buchanan#6 | 2 | 48 | 24.0 | 0 | 36 |
| Savion Hiter#5 | 3 | 41 | 13.7 | 0 | 19 |
| Andrew Marsh#3 | 3 | 13 | 4.3 | 0 | 12 |
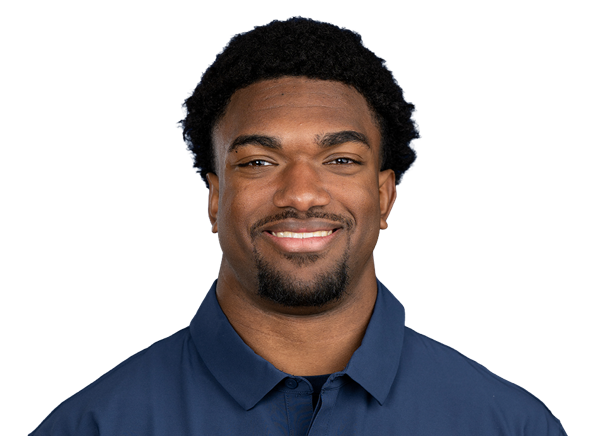 Jalen Hoffman#42 | 1 | 9 | 9.0 | 0 | 9 |
Oklahoma| Player | TOT | SOLO | SACKS | TFL | PD | QB HUR | TD |
|---|---|---|---|---|---|---|---|
| Owen Heinecke#38 | 10 | 6 | 1 | 1 | 0 | 0 | 0 |
 Jayden Jackson#65 | 6 | 5 | 0 | 1 | 0 | 0 | 0 |
 Taylor Wein#44 | 6 | 4 | 0 | 1.5 | 0 | 0 | 0 |
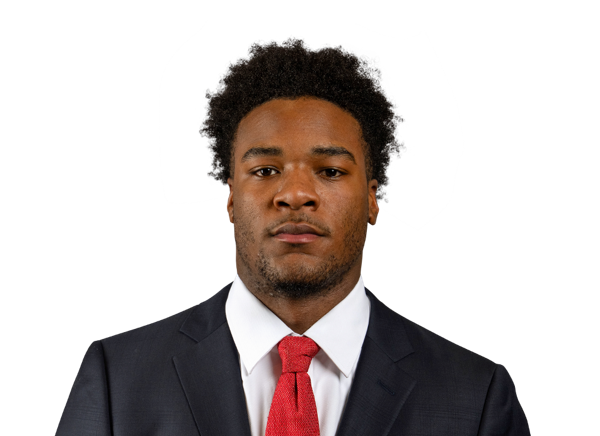 Omarion Robinson#2 | 6 | 3 | 0 | 0 | 0 | 0 | 0 |
 Peyton Bowen#22 | 6 | 2 | 0 | 0 | 1 | 0 | 0 |
 Michael Boganowski#25 | 5 | 4 | 0 | 0 | 0 | 0 | 0 |
 Reggie Powers III#3 | 4 | 4 | 1 | 2 | 1 | 0 | 0 |
 David Stone | 3 | 2 | 0 | 0.5 | 0 | 0 | 0 |
 James Nesta#47 | 3 | 2 | 0 | 0 | 0 | 0 | 0 |
 Bishop Thomas#8 | 3 | 1 | 0 | 0 | 0 | 0 | 0 |
 Eli Bowen#23 | 2 | 2 | 0 | 0 | 1 | 0 | 0 |
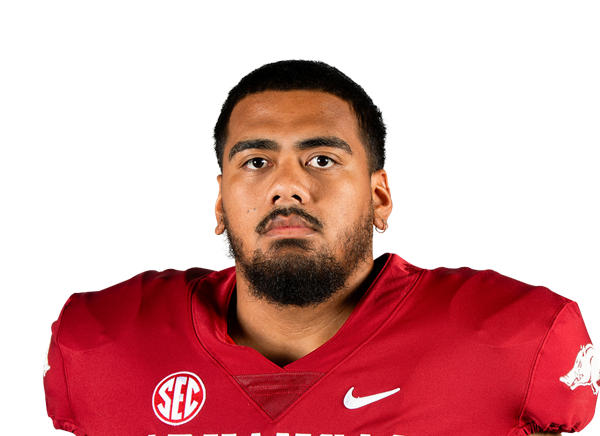 Danny Saili#55 | 2 | 1 | 0 | 0 | 0 | 0 | 0 |
| John Mateer#10 | 1 | 1 | 0 | 0 | 0 | 0 | 0 |
 Elijah Thomas#14 | 1 | 1 | 0 | 0 | 0 | 0 | 0 |
 Cole Sullivan#18 | 1 | 0 | 0 | 0 | 0 | 0 | 0 |
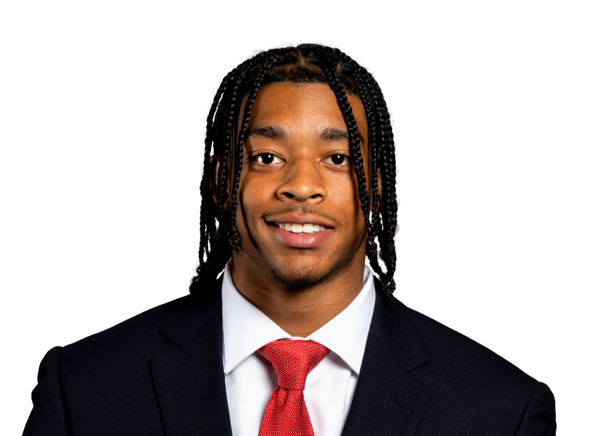 Courtland Guillory#4 | 1 | 0 | 0 | 0 | 1 | 0 | 0 |
Michigan| Player | TOT | SOLO | SACKS | TFL | PD | QB HUR | TD |
|---|---|---|---|---|---|---|---|
| Troy Bowles#18 | 9 | 4 | 0 | 0 | 0 | 0 | 0 |
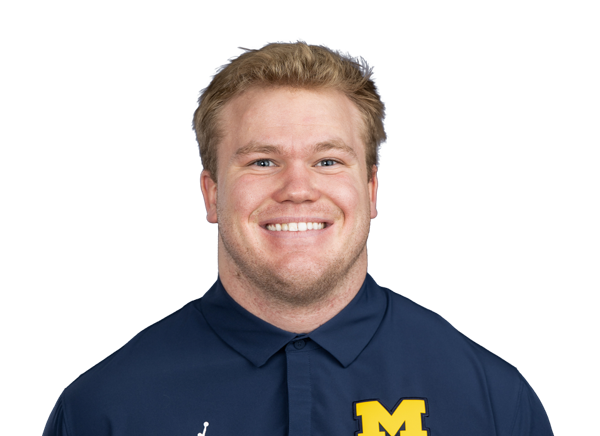 John Henry Daley#90 | 8 | 4 | 1 | 3 | 0 | 0 | 0 |
 Nathaniel Staehling#44 | 7 | 2 | 0 | 0.5 | 0 | 0 | 0 |
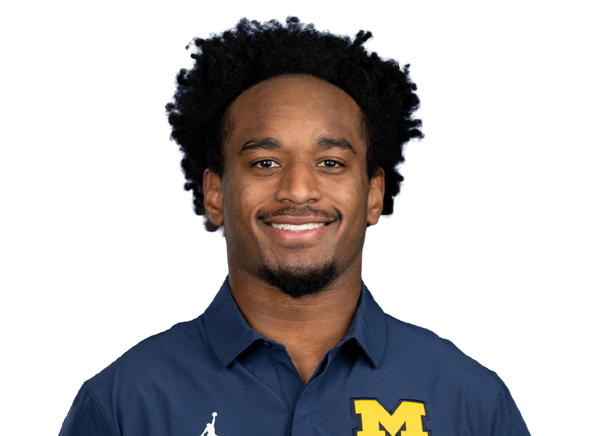 Chris Bracy#7 | 6 | 5 | 0 | 0 | 0 | 0 | 0 |
 Jyaire Hill | 5 | 3 | 0 | 0 | 0 | 0 | 0 |
 Zeke Berry#10 | 4 | 3 | 0 | 0 | 0 | 0 | 0 |
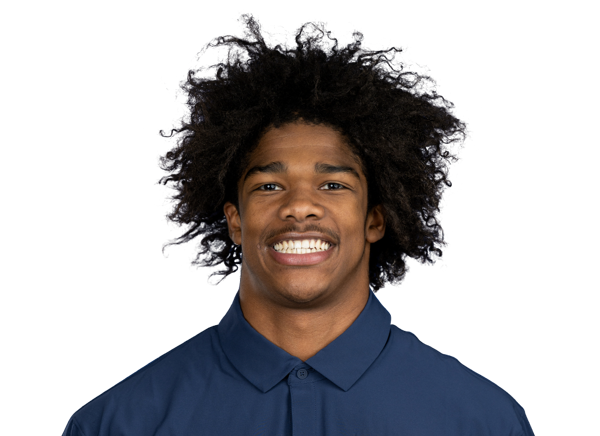 Chase Taylor#4 | 4 | 2 | 0.5 | 0.5 | 1 | 0 | 0 |
 Rod Moore Jr.#1 | 3 | 2 | 0 | 0 | 0 | 0 | 0 |
 Enow Etta#17 | 3 | 0 | 0 | 1 | 0 | 0 | 0 |
 Smith Snowden#3 | 2 | 2 | 0 | 0 | 0 | 0 | 0 |
 Trey Pierce#95 | 2 | 2 | 0 | 1 | 0 | 0 | 0 |
| Nate Marshall#94 | 2 | 1 | 1 | 1.5 | 0 | 0 | 0 |
 Jonah Lea'ea#91 | 2 | 0 | 0 | 0 | 0 | 0 | 0 |
 Kendrick Bell | 1 | 1 | 0 | 0 | 0 | 0 | 0 |
 Nathaniel Owusu-Boateng#12 | 1 | 1 | 0 | 0 | 0 | 0 | 0 |
 Dom Nichols#8 | 1 | 0 | 0.5 | 0.5 | 0 | 1 | 0 |
 Bobby Kanka#99 | 0 | 0 | 0 | 0 | 0 | 1 | 0 |
Oklahoma| Player | FUM | LOST | REC |
|---|---|---|---|
| Parker Livingstone#3 | 1 | 1 | 0 |
Michigan| Player | FUM | LOST | REC |
|---|---|---|---|
| Bryce Underwood#19 | 1 | 0 | 0 |
| Savion Hiter#5 | 1 | 0 | 0 |
| Troy Bowles#18 | 0 | 0 | 1 |
Oklahoma| Player | FG | PCT | LONG | XP | PTS |
|---|---|---|---|---|---|
 Tate Sandell#29 | 1/1 | 100.0 | 34 | 1/1 | 4 |
Michigan| Player | FG | PCT | LONG | XP | PTS |
|---|---|---|---|---|---|
 Trey Butkowski#99 | 1/1 | 100.0 | 40 | 2/2 | 5 |
Oklahoma| Player | NO | YDS | AVG | TB | In 20 | LONG |
|---|---|---|---|---|---|---|
 Grayson Miller#43 | 5 | 243 | 48.6 | 0 | 3 | 62 |
Michigan| Player | NO | YDS | AVG | TB | In 20 | LONG |
|---|---|---|---|---|---|---|
 Cam Brown#33 | 7 | 296 | 42.3 | 0 | 6 | 51 |
Michigan| Player | NO | YDS | AVG | LONG | TD |
|---|---|---|---|---|---|
| Bryson Kuzdzal#24 | 1 | 24 | 24.0 | 24 | 0 |
Oklahoma| Player | NO | YDS | AVG | LONG | TD |
|---|---|---|---|---|---|
| Isaiah Sategna III#1 | 3 | 17 | 5.7 | 12 | 0 |
Michigan| Player | INT | YDS | TD |
|---|---|---|---|
| Jyaire Hill | 1 | 24 | 0 |
Drive Summary
OU
Punt
13
MICH
Punt
35
OU
Punt
28
MICH
Touchdown
91
OU
Fumble
48
MICH
Punt
31
OU
Punt
3
MICH
Field Goal
34
OU
Punt
28
MICH
End of Half
4
MICH
Punt
8
OU
Touchdown
90
MICH
Punt
33
OU
Field Goal
83
MICH
Punt
4
OU
Interception
1
MICH
Touchdown
6
OU
Punt
12
MICH
Punt
8
OU
Downs
3
MICH
Punt
6
OU
End of Game
10
Injury Report
No current injury report is available for this matchup.
Head-to-Head
Historical meetings are not available for this matchup.
Game Information
StageWeek 2
Season2026
KickoffSat, Sep 12, 12:00 pm
VenueMichigan Stadium
LocationAnn Arbor, MI
SurfaceArtificial Turf
BroadcastFOX, ERADM
Attendance111,240
Division Standings
FBS — Southeastern Conference
| Team | W | L | T | Pct | PF | PA | Home | Away | Strk |
|---|---|---|---|---|---|---|---|---|---|
 Alabama | 8 | 2 | 0 | 0.800 | 358 | 189 | 4-1 | 4-1 | W3 |
 Auburn | 6 | 4 | 0 | 0.600 | 260 | 246 | 4-2 | 2-2 | W2 |
 Florida | 6 | 4 | 0 | 0.600 | 313 | 262 | 3-2 | 3-2 | W1 |
 Georgia | 9 | 1 | 0 | 0.900 | 418 | 147 | 6-1 | 3-0 | W3 |
 LSU | 6 | 4 | 0 | 0.600 | 355 | 181 | 5-2 | 1-2 | L2 |
 Mississippi State | 4 | 6 | 0 | 0.400 | 245 | 291 | 2-4 | 2-2 | L6 |
 Missouri | 6 | 4 | 0 | 0.600 | 293 | 229 | 4-1 | 2-3 | L2 |
 Ole Miss | 6 | 3 | 0 | 0.667 | 304 | 234 | 5-1 | 1-2 | L1 |
 South Carolina | 6 | 4 | 0 | 0.600 | 318 | 245 | 4-2 | 2-2 | L1 |
 Tennessee | 8 | 2 | 0 | 0.800 | 314 | 143 | 5-1 | 3-1 | W2 |
 Texas | 8 | 2 | 0 | 0.800 | 302 | 178 | 5-1 | 3-1 | W4 |
 Texas A&M | 4 | 6 | 0 | 0.400 | 242 | 190 | 4-2 | 0-4 | L3 |
 Vanderbilt | 4 | 6 | 0 | 0.400 | 213 | 286 | 3-3 | 1-3 | L1 |
 Arkansas | 4 | 6 | 0 | 0.400 | 214 | 253 | 3-3 | 1-3 | W1 |
| Oklahoma | 5 | 4 | 0 | 0.556 | 199 | 173 | 3-2 | 2-2 | W1 |
 Kentucky | 7 | 3 | 0 | 0.700 | 283 | 253 | 4-2 | 3-1 | L2 |
FBS — Big Ten Conference
| Team | W | L | T | Pct | PF | PA | Home | Away | Strk |
|---|---|---|---|---|---|---|---|---|---|
 USC | 7 | 3 | 0 | 0.700 | 305 | 245 | 5-1 | 2-2 | L1 |
 Indiana | 9 | 1 | 0 | 0.900 | 319 | 125 | 6-1 | 3-0 | W3 |
 Iowa | 8 | 2 | 0 | 0.800 | 278 | 117 | 5-1 | 3-1 | W3 |
 Maryland | 4 | 6 | 0 | 0.400 | 273 | 303 | 2-4 | 2-2 | W2 |
| Michigan | 5 | 5 | 0 | 0.500 | 183 | 177 | 4-3 | 1-2 | L2 |
 Michigan State | 3 | 7 | 0 | 0.300 | 188 | 233 | 2-4 | 1-3 | L1 |
 Nebraska | 6 | 4 | 0 | 0.600 | 303 | 149 | 4-2 | 2-2 | W1 |
 Penn State | 6 | 4 | 0 | 0.600 | 302 | 188 | 4-2 | 2-2 | W3 |
 UCLA | 10 | 0 | 0 | 1.000 | 324 | 141 | 6-0 | 4-0 | W10 |
 Washington | 6 | 4 | 0 | 0.600 | 258 | 211 | 3-3 | 3-1 | W1 |
 Northwestern | 6 | 4 | 0 | 0.600 | 298 | 202 | 5-1 | 1-3 | L3 |
 Illinois | 6 | 4 | 0 | 0.600 | 270 | 229 | 4-2 | 2-2 | L1 |
 Minnesota | 5 | 5 | 0 | 0.500 | 236 | 240 | 4-2 | 1-3 | L3 |
 Ohio State | 7 | 3 | 0 | 0.700 | 349 | 184 | 5-1 | 2-2 | W1 |
 Oregon | 7 | 3 | 0 | 0.700 | 338 | 206 | 5-1 | 2-2 | W3 |
 Purdue | 3 | 7 | 0 | 0.300 | 272 | 319 | 2-4 | 1-3 | L4 |
 Wisconsin | 6 | 4 | 0 | 0.600 | 241 | 171 | 5-0 | 1-4 | L1 |
 Rutgers | 2 | 8 | 0 | 0.200 | 232 | 323 | 1-5 | 1-3 | L4 |
Oklahoma
6th in SEC
VS
Michigan
15th in Big Ten
Quarterbacks & Specialists
#10
John Mateer
Receivers & Backs
#17
Mackenzie Alleyne
#9
Lloyd Avant
#81
Rocky Beers
#6
Tory Blaylock
#11
Trell Harris
#3
Parker Livingstone
#21
Xavier Robinson
#1
Isaiah Sategna III
#14
Elijah Thomas
Defensive Line & Linebackers
#38
Owen Heinecke
#65
Jayden Jackson
#47
James Nesta
#55
Danny Saili
David Stone
#18
Cole Sullivan
#8
Bishop Thomas
#44
Taylor Wein
Defensive Backs
#25
Michael Boganowski
#23
Eli Bowen
#22
Peyton Bowen
#4
Courtland Guillory
#3
Reggie Powers III
#2
Omarion Robinson
Other
#43
Grayson Miller
#29
Tate Sandell
Quarterbacks & Specialists
#33
Cam Brown
#19
Bryce Underwood
Receivers & Backs
Kendrick Bell
#6
JJ Buchanan
#5
Savion Hiter
#42
Jalen Hoffman
#24
Bryson Kuzdzal
#3
Andrew Marsh
#23
Jordan Marshall
Defensive Line & Linebackers
#18
Troy Bowles
#90
John Henry Daley
#17
Enow Etta
#99
Bobby Kanka
#91
Jonah Lea'ea
#94
Nate Marshall
#8
Dom Nichols
#12
Nathaniel Owusu-Boateng
#95
Trey Pierce
#44
Nathaniel Staehling
#4
Chase Taylor
Defensive Backs
#10
Zeke Berry
#7
Chris Bracy
Jyaire Hill
#1
Rod Moore Jr.
#3
Smith Snowden
Other
#99
Trey Butkowski
Oklahoma
6th in SEC
VS
Michigan
14th in Big Ten
Passing
64.0
Completion Percentage
58.8
194
Completions
141
2.60
Interception Percentage
3.80
8
Interceptions
9
54
Longest Pass
49
2,159
Net Passing Yards
1,636
215.9
Net Passing Yards Per Game
163.6
303
Passing Attempts
240
5.00
Passing Touchdown %
2.90
15
Passing Touchdowns
7
134.8
Passer Rating
117.9
25
Total Sacks
22
129
Sack Yards Lost
132
7.1
Yards Per Pass Attempt
6.8
2,159
Passing Yards
1,636
0
Passing Fumbles Lost
0
10
Team Games Played
10
334.5
Yards Per Game
300.9
22.3
Total Points Per Game
18.3
223
Total Points
183
25
Total Touchdowns
24
215.9
Passing Yards Per Game
163.6
194-303
Comp-Att
141-240
25-129
Sacks-Yards Lost
22-132
Rushing
358
Rushing Attempts
364
1,186
Rushing Yards
1,373
3.3
Yards Per Rush Attempt
3.8
47
Long Rushing
70
0
20+ Yard Rushing Plays
0
5
Rushing Touchdowns
15
118.6
Rushing Yards Per Game
137.3
0
Rushing Fumbles
0
0
Rushing Fumbles Lost
0
69
Rushing 1st downs
72
10
Team Games Played
10
3,345
Total Yards
3,009
686
Total Offensive Plays
626
22.3
Total Points Per Game
18.3
223
Total Points
183
25
Total Touchdowns
24
Receiving
194
Receptions
141
0
Receiving Targets
0
2,159
Receiving Yards
1,636
2,159
Receiving Yards
1,636
15
Receiving Touchdowns
7
54
Long Reception
49
0
20+ Yard Receiving Plays
0
215.9
Receiving Yards Per Game
163.6
0
Receiving Fumbles
0
0
Receiving Fumbles Lost
0
1068
Receiving Yards After Catch
652
94
Receiving First Downs
76
10
Team Games Played
10
11.1
Yards Per Reception
11.6
22.3
Total Points Per Game
18.3
223
Total Points
183
25
Total Touchdowns
24
Miscellaneous
183
Total 1st downs
165
69
Rushing 1st downs
72
94
Passing 1st downs
76
20
1st downs by penalty
17
61
Third Down Conversions
53
150
Third Down Attempts
130
40.67
3rd down %
40.77
6
Fourth Down Conversions
8
12
First Downs Attempts
14
50.00
4th down %
57.14
68
Total Penalties
62
565
Total Penalty Yards
566
18832
Possession Time Seconds
17494
0.00
Red Zone Field Goal Percentage
0.00
0.00
Red Zone Scoring Percentage
0.00
0.00
Red Zone Efficiency Percentage
0.00
0.00
Red Zone Touchdown Percentage
0.00
13
Total Takeaways
11
15
Total Giveaways
19
-2
Turnover Ratio
-8
0
Fumbles Lost
0
61-150
3rd down efficiency
53-130
6-12
4th down efficiency
8-14
68-565
Total-Yards
62-566
Defense
298
Solo Tackles
326
344
Assist Tackles
304
642
Total Tackles
630
28
Sacks
23
164
Sack Yards
119
85
Stuffs
80
27
Passes Defended
27
12.1
Average Interception Yards
21.7
42
Long Interception
79
0
Miscellaneous Touchdowns
0
1
Kicks Blocked
2
45
Tackles For Loss
44
10
Team Games Played
10
Defensive Interceptions
9
Interceptions
7
109
Interception Yards
152
2
Interception Touchdowns
2
9-109
INT: Total
7-152
General
9
Fumbles
15
5
Forced Fumbles
3
5
Fumbles Recovered
2
0
Fumbles Touchdowns
0
10
Games Played
10
9-0
Fumbles-Lost
15-0
Returning
7
Kick Returns
9
149
Kick Return Yards
191
21.3
Yards Per Kick Return
21.2
28
Long Kick Return
36
0
Kick Return Touchdowns
0
15
Punt Returns
11
239
Punt Return Yards
72
15.9
Yards Per Punt Return
6.5
88
Long Punt Return
13
3
Punt Return Touchdowns
0
0
Punt Return Fair Catches
0
0
Kick Return Fumbles Lost
0
0
Punt Return Fumbles Lost
0
10
Team Games Played
10
15-239
Punt: Total
11-72
Kicking
17
Field Goal Made
6
25
Field Goal Attempts
11
68.0
Field Goal Percentage
54.5
53
Long Field Goal Made
49
0
Field Goal Attempts 1-19
0
1
Field Goal Attempts 20-29
4
9
Field Goal Attempts 30-39
2
10
Field Goal Attempts 40-49
4
5
Field Goal Attempts 50+
1
22
Extra Points Made
21
22
Extra Point Attempts
21
100.0
Extra Point Percentage
100.0
0
Field Goals Made 1-19
0
1
Field Goals Made 20-29
3
8
Field Goals Made 30-39
0
6
Field Goals Made 40-49
3
2
Field Goals Made 50+
0
73
Total Kicking Points
39
10
Team Games Played
10
74
Touchback Percentage
67
0.0
Average Kickoff Return Yards
0.0
0
Kickoff Return Yards
0
0
Kickoff Returns
0
0-0
Kickoffs: Total
0-0
17-25
FG: Good-Attempts
6-11
Punting
43
Punts
46
1,893
Punt Yards
1,948
62
Long Punt
52
44.0
Gross Average Punt Yards
42.3
44.0
Net Average Punt Yards
42.3
0
Punts Blocked
0
14
Punts Inside 20
20
1
Touchbacks
2
19
Fair Catches
21
18
Punt Returns
11
0
Punt Return Yards
0
0.0
Average Punt Return Yards
0.0
10
Team Games Played
10
43-1,893
Punt: Total Yards
46-1,948
Scoring
5
Rushing Touchdowns
15
15
Receiving Touchdowns
7
3
Return Touchdowns
0
23
Total Touchdowns
22
17
Field Goals
6
22
Kick Extra Points
21
0
Total Two Point Conversions
0
223
Total Points
183
22.3
Total Points Per Game
18.3